1545
Superpixels-based Segmentation and Automated Identification of Active Tumour and Necrotic regions in Bone Tumor using T1 and Diffusion Weighted Imaging1Centre for Biomedical Engineering, Indian Institute of Technology Delhi, New Delhi, India, 2Department of Radiology, All India Institute of Medical Sciences, New Delhi, India, 3Department of Medical Oncology, IRCH, All India Institute of Medical Sciences, New Delhi, India
Synopsis
Proper Delineation of the tumour boundary and assessment of tumour size can take crucial part in treatment planning and monitoring treatment response. We investigate a fully automated Simple linear iterative clustering (SLIC) superpixel-based method for detection and segmentation of pathological tissues like oedema, tumour and necrosis associated with Osteosarcoma. Experimental results provide a close match to expert delineation and was able to estimate areas of active tumor and necrosis with good accuracy.
Introduction:
Osteosarcoma is a primary bone-tumor in children and adolescents with significant morbidity and poor prognosis1. Delineation of tumour and assessment is vital in treatment planning and monitoring. Therefor accurate and non-invasive method is needed since manual segmentation is time-consuming and prone to error & operator subjectivity2. Superpixels based segmentation technique on MRimages has been successfully applied for tumor segmentation3,4. In primary bone tumors, T2W images are commonly used to define tumour extent; Diffusion weighted imaging(DWI) and Apparent Diffusion Coefficient(ADC) are used to detect cellular changes in tumors exporting diffusion restriction5. We investigate a fully automated Simple-Linear-Iterative-Clustering(SLIC)6 superpixels-based method for detection and sub-segmentation of Osteosarcoma.Methods:
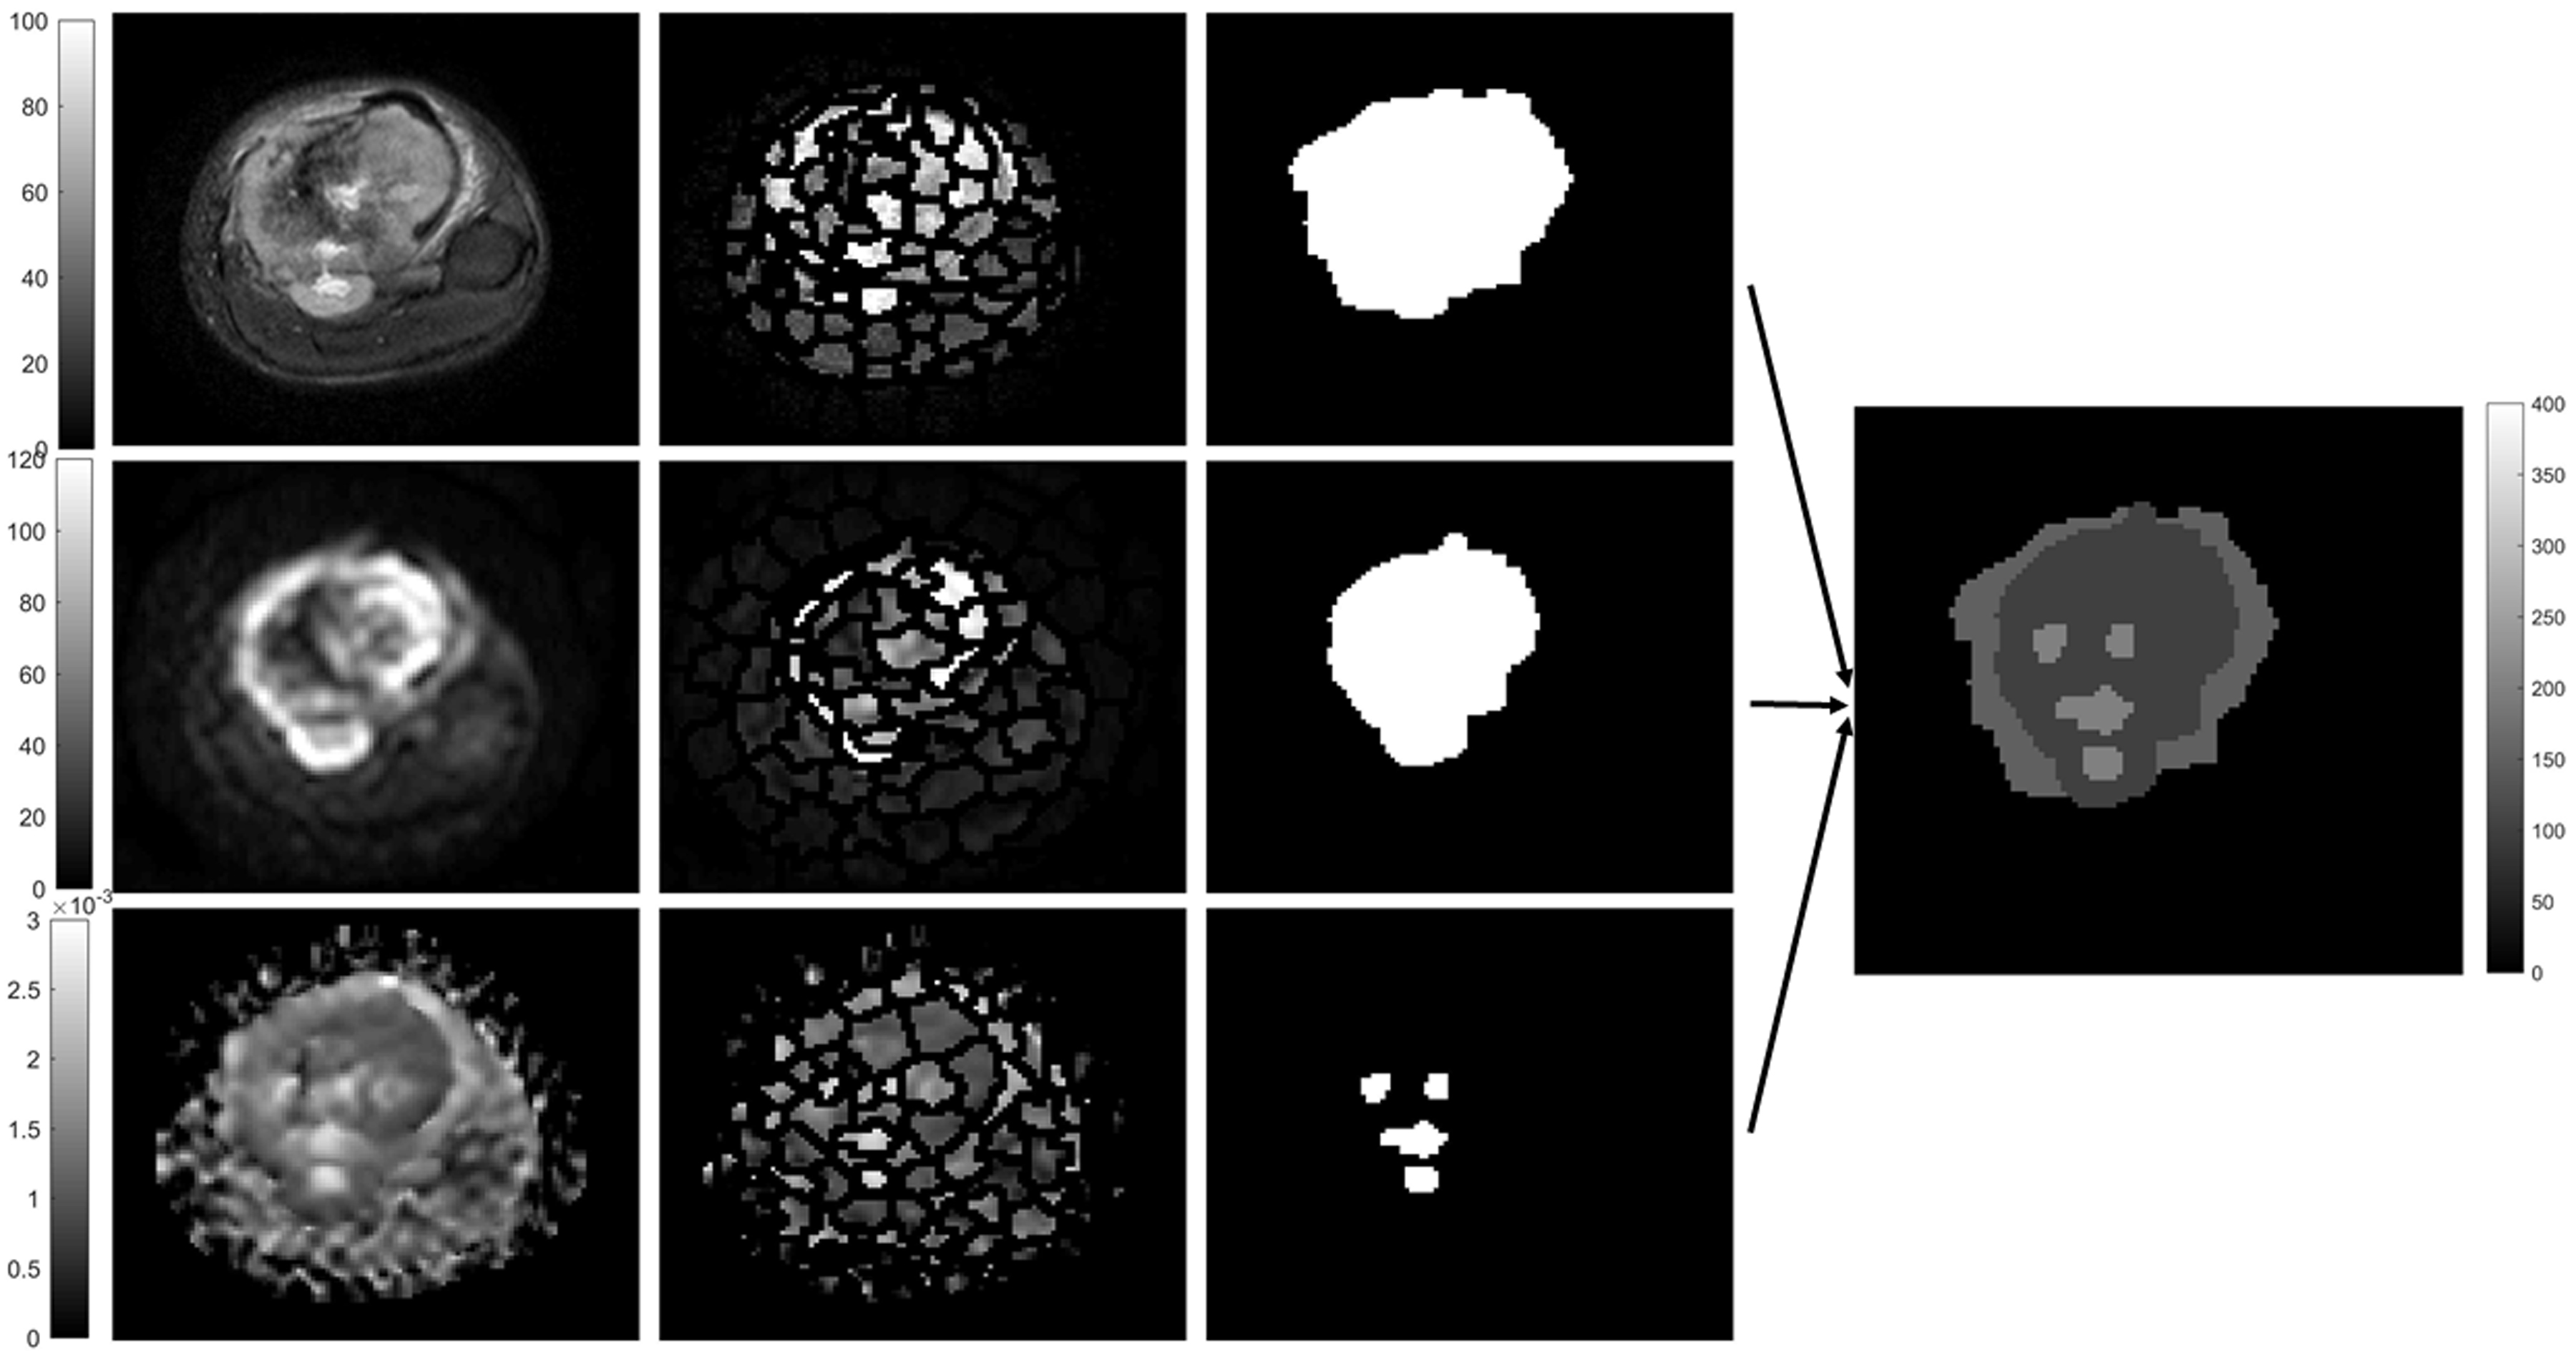
MRI dataset for six patients (n=6,M:F=6:0,Age=15.7±2.3yrs), with Osteosarcoma were acquired under Institutional Review Board approved protocol(IEC-103/05.02.2016,RP-26/2016). For one patient dataset was acquired again after 3cycles of chemotherapy. The acquisition was performed on1.5T Philips Achieva MRIscanner. DWI was acquired with Spin-Echo-Echo-Planar-imaging with TR/TE=7541/67msec, matrix-size=192×192, slice-thickness/Gap=5mm/0.5mm, voxel-size=2.98/3.52/5.0mm, b-values=0-800s/mm2. T2W images were acquired using Turbo-Spin-Echo with TR/TE=73795/85msec, matrix-size=384×384. ADC value was calculated with higher b-values. DWI with b=800 s/mm2 and T2W-fat-saturated (T2-fatsat) image were used for differentiation between tumor and edema. ADC-map was used to capture necrotic region within tumor. Ground truth region-of-interest (ROI) for tumor tissue (tumor-mask) and necrosis (necrosis-mask) were demarcated on DWI (b=800s/mm2) and corresponding ADC maps respectively for all patients by an expert radiologist. T2W images were registered with DWI images and hyper-intense area was demarked (T2-mask) as region with tumor+edema. Figure1a,d&g shows DWI (b=800s/mm2), ADC map, T2W (fatsat) images for one representative patient.
SLIC Superpixels-based technique was used in five images with maximum tumor burden for each patient to segment the solid tumor, necrosis and edema. 100superpixel for T2w(fatsat) and DWI and 150superpixel for ADC were used to identify the regional variations. SLIC generates superpixels by clustering pixels based on intensity similarity and proximity in plane. Superpixels were then marked with the mean intensity of individual superpixel. Histogram analysis of these superpixels in a slice was performed and 4 Ostu thresholds were estimated considering multi-Gaussian distribution. Superpixels with similar mean intensity values were then combined to belong to a single region. In T2w (fatsat) image superpixels above threshold 3 were merged and masked as region with tumor+edema; DWI image superpixels above threshold 3 were merged and masked as region with tumor (having active tumor and necrosis); superpixels above threshold 4 were masked as region with necrosis. Finally, Edema=superpixels mask from T2W–superpixels mask from DWI. ActiveTumor= superpixels mask from DWI–superpixels mask from ADC and Nectrosis= superpixels mask from ADC.
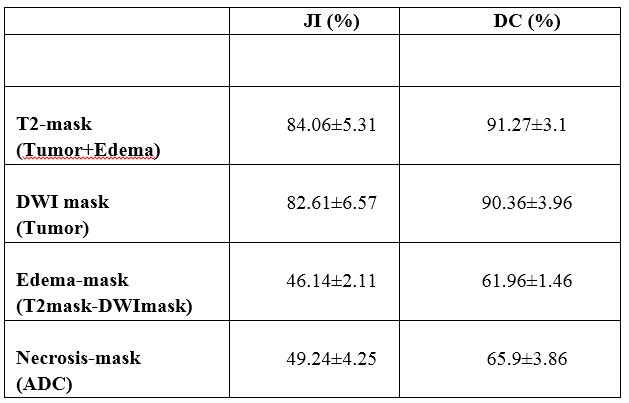
Ground truth ROIs and segmentation results were compared to evaluate the performance using jacquard index(JI) and dice coefficient(DC). Here, DC = 2.(|A∩B|/(|A|+|B|)) and JI = (|A∩B|/|A∪B|), where A and B are areas demarcated by radiologist and segmentation algorithm respectively. Segmentation and accuracy calculation were performed using an in-house built toolbox in MATLAB.
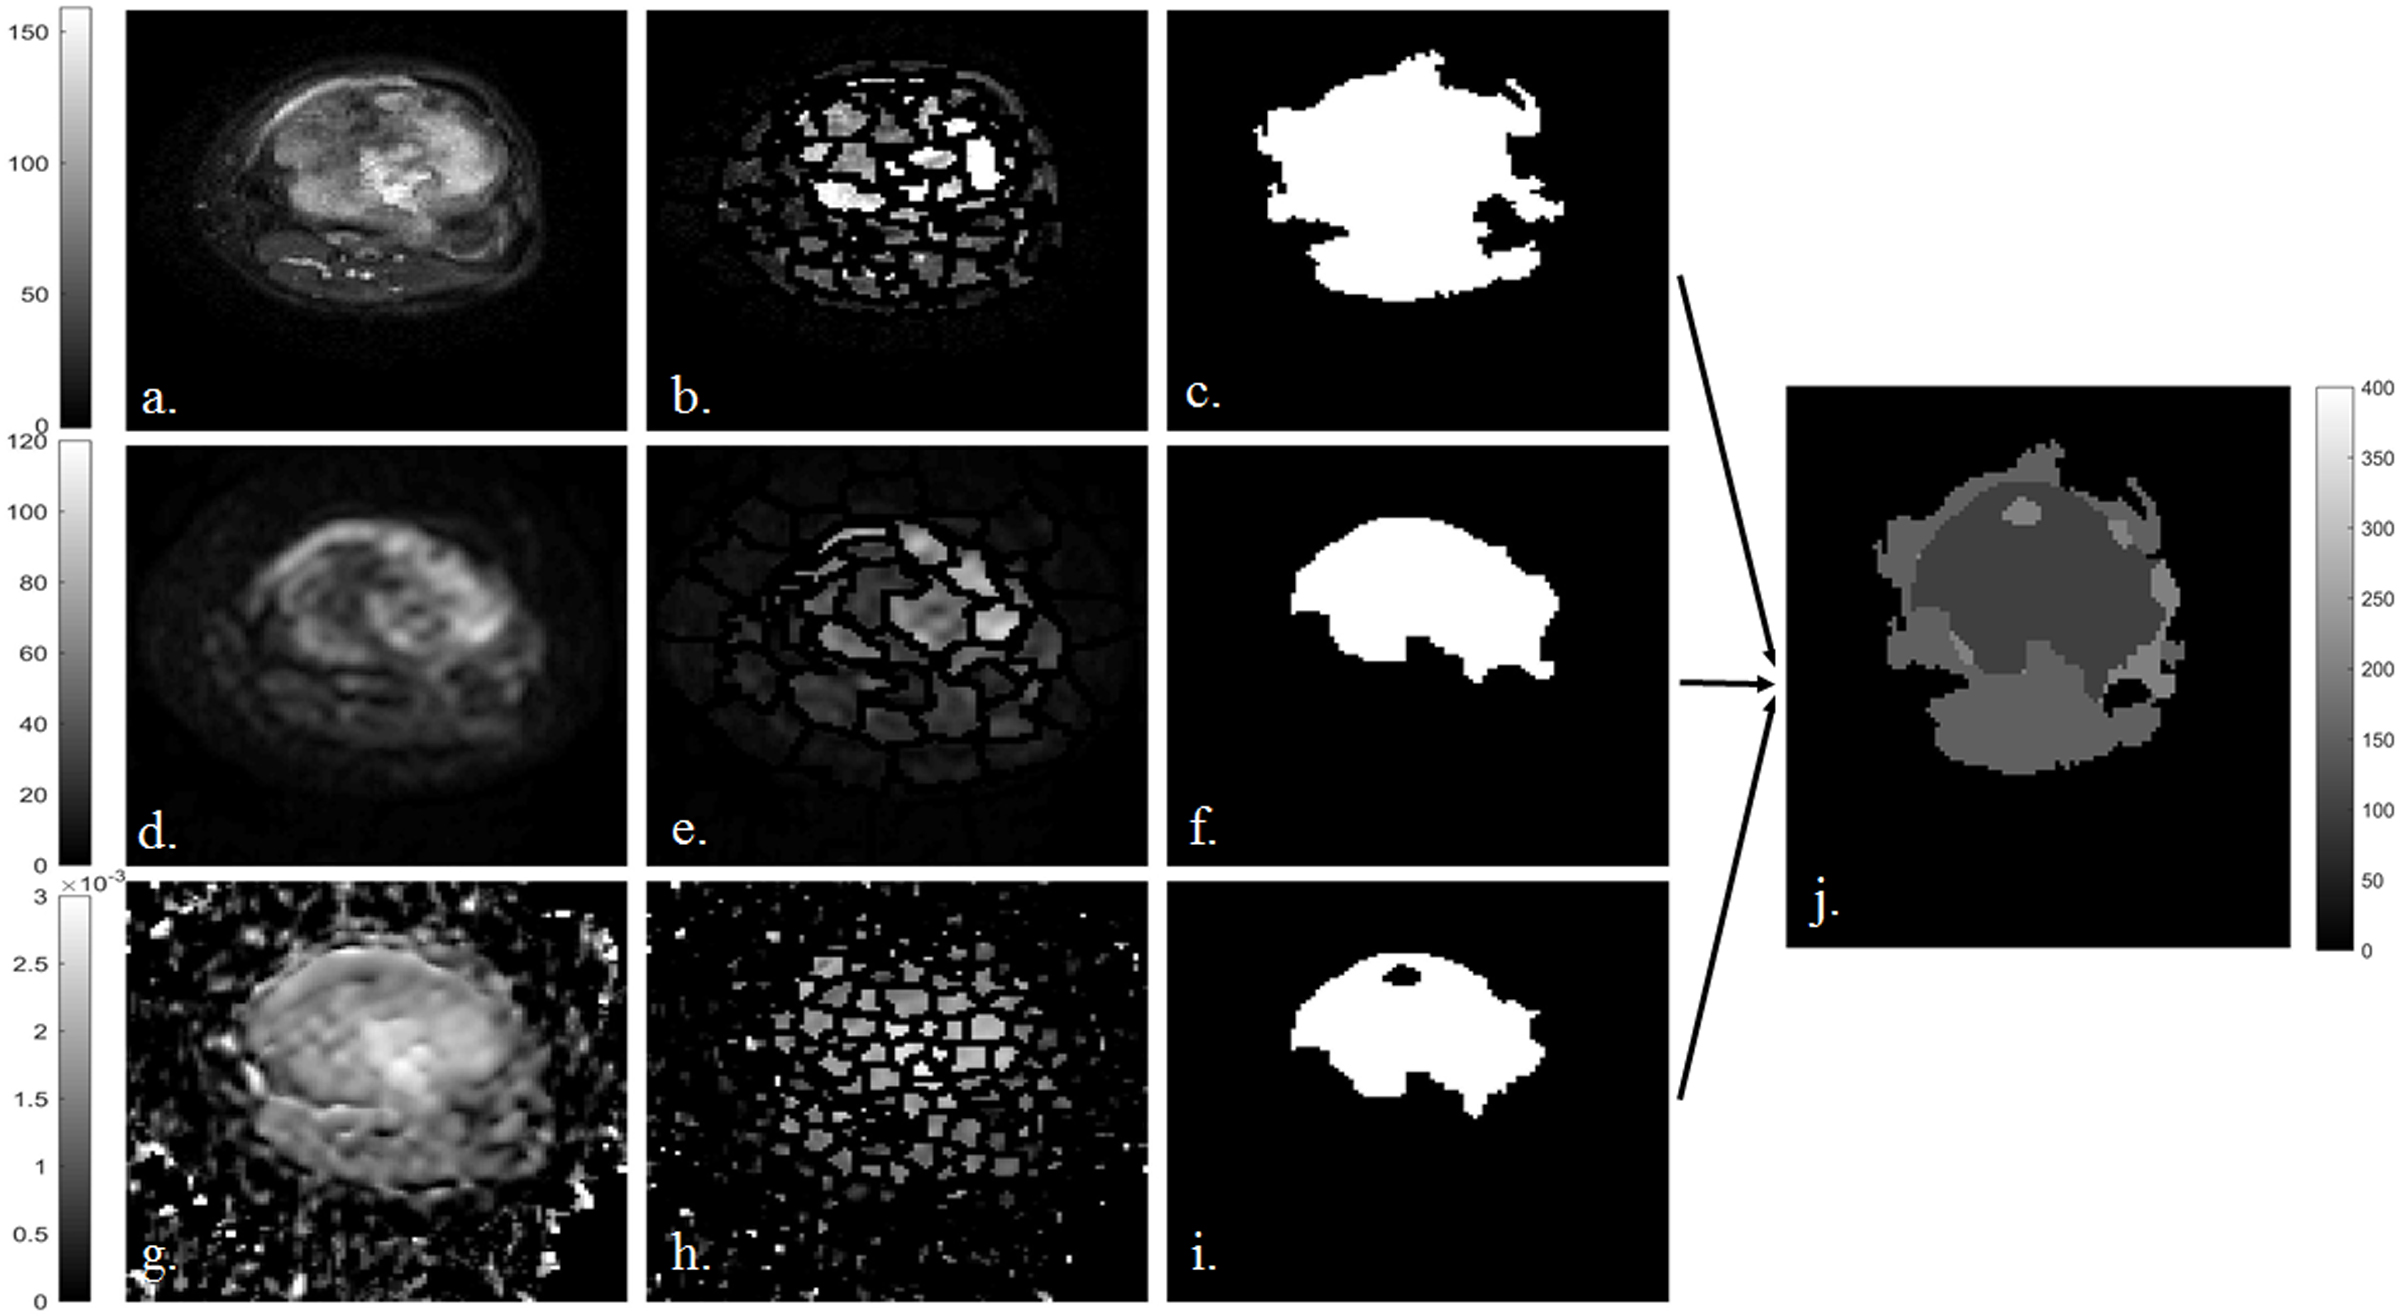
Same analysis was performed on the dataset of one patient acquired after 3cycles of chemotherapy. It was further analysed to measure the change in volume of edema, active tumor and necrosis. For this specific patient resection was performed later and histopathological sample revealed a 90% necrosis after 3 cycles of chemotherapy.
Results:
Figure1 represents the superpixels-based segmentation of T2 (fatsat), DWI and ADC map and mask created for edema, tumor and necrosis for a tumor slice of a representative patient. Segmentation accuracy for T2-mask, edema-, tumor and necrosis are summarized in Table1. Accuracy for estimation of tumor bulk and T2-mask was highly satisfactory (JI:77-91% and DC:86-96%) whereas moderate in estimation of edema and necrosis (JI:43-55% and DC:60-71%). Execution time for all segmentation and volume calculation was 0.22±0.05sec/slice. Figure 2 shows the segmentation of edema,turmor and necrosis region in the same patient (figure 1) at similar slice after 3 cycles of chemotherapy. Comparison of pre- and post-chemotherapy superpixel MRI analysis showed reduction in active tumor bulk from 95% to 12.5%, increase in necrosis region from 5% to 87.5% and increase in edema from 7.5% to 78.4%. This is in close match to 90% necrosis reported with histopathological analysis.Discussion:
SLIC is an automated method that requires few input parameters, yielding lower under-segmentation error, higher boundary recall, control on Superpixel numbers with lower computational cost and increases memory efficiency. With our proposed approach it is now possible to sub-segment tumour into edema, active tumor and necrosis region with reasonably good accuracy. It is also demonstrated that method could be further useful in evaluating chemotherapy response which in our case was observed to be in close range with histopathological reporting; however this needs to be further evaluated with larger dataset.Acknowledgements
Authors would like to thank Govt. of India, MHRD for providing fellowship funding support to Esha Badiya Kayal. Also would like to thank clinical staff at AIIMS, New Delhi in helping patient recruitment.References
1. Mirabello Let al. Osteosarcoma incidence and survival rates from 1973 to 2004: data from the Surveillance, Epidemiology, and End Results Program. Cancer 2009;115(7):1531–1543. 2. Aslian H et al. Magnetic resonance imaging-based target volume delineation in radiation therapy treatment planning for brain tumors using localized region-based active contour. Int J CARS (2017) 12:183–203, J Radiat Oncol Biol Phys 87:195–201. doi:10.1016/j.ijrobp.2013.04.049. 3. Irving et al. Automated Colorectal Tumour Segmentation in DCE-MRI using Supervoxel Neighbourhood Contrast Characteristics. Med Image Comput Comput Assist Interv. 2014;17(Pt 1):609-16. 4. Soltaninejad M. et al. Automated brain tumour detection and segmentation using superpixel-based extremely randomized trees in FLAIR MRI. Int J CARS (2017) 12:183–203. Doi:10.1007/s11548-016-1483-3 5. Murphey MD, Robbin MR, McRae GA, Flemming DJ, Temple HT, KransdorfMJ.; “The many faces of osteosarcoma”. RadioGraphics 1997;17(5): 1205–1231. 6. Achanta et al. SLIC Superpixels Compared to State-of-the-Art Superpixel Methods. IEEE Transactions on analysis and machine intelligence, vol. 34, NO. 11, Nov, 2012.Figures