1544
Dose reduction in myxoid liposarcomas: Initial descriptive results in the evaluation of response using multiparametric MRI.1CR-UK and EPSRC Cancer Imaging Centre, Royal Marsden NHS Foundation Trust & Institute of Cancer Research, Sutton, United Kingdom, 2Sarcoma Unit, Royal Marsden NHS Foundation Trust, London, United Kingdom, 3Pathology, Royal Marsden NHS Foundation Trust, London, United Kingdom, 4Academic Surgery, Royal Marsden NHS Foundation Trust, London, United Kingdom, 5Radiology, Royal Marsden NHS Foundation Trust, London, United Kingdom, 6Radiotherapy, Royal Marsden NHS Foundation Trust, London, United Kingdom, 7Radiotherapy, Neetherlands Cancer Institute, Amsterdam, Netherlands
Synopsis
Compared to other soft tissue sarcomas (STSs), myxoid liposarcomas (MLSs) are exquisitely radiosensitive. The clinicopathological response following pre-operative radiotherapy at 50 Gy/25# in MLS might be due to radiation induction vascular damage. Here we report initial results in using multiparametric MRI (diffusion-weighted imaging, pharmacokinetic modelling and T2* measurements) to evaluate MLS response during and after preoperative RT. Dynamic contrast-enhanced examinations demonstrated both heterogeneous and homogeneous enhancement patterns. The tissue enhancement curve was monotonically-increasing in all cases, suggesting a distinct vascular pattern. Permeability and perfusion decreases from baseline in responders show Ktrans and IAUGC60 can potentially predict response.
Introduction
Compared to other soft tissue sarcomas (STSs), myxoid liposarcomas (MLSs) are exquisitely radiosensitive [1,2]. The clinicopathological response following pre-operative radiotherapy at 50 Gy/25# in MLS might be due to radiation induced vascular damage [3]. After RT the plexiform vascular pattern is completely lost with the induction of arteriole obliteration and necrosis (defined as a therapeutic effect). The vascular damage can occur at lower doses [4], it is hypothesised that MLS can be effectively treated at lower doses of irradiation.
Functional magnetic resonance imaging (MRI) can estimate imaging biomarkers associated with tissue biological properties and their utility in assessing response and surgical staging of STSs has been demonstrated [5,6,7]. Here we report initial results in using multiparametric MRI to evaluate MLS response during and after preoperative RT.
Methods
The international DOREMY study of reduced pre-operative radiotherapy was approved by the Research Ethics Committee. Ten patients with biopsy-proven MLS were treated with reduced dose 36x2Gy. A parallel translational study was undertaken. Pre-operative MRI scans (3T, Siemens, Skyra) were performed pre-RT, twice during RT and twice post-RT. All patients underwent biopsy during treatment, surgery post-RT with pathology review.
The MRI protocol comprised:
i) Pre-contrast 3D T1-w (flip angle=16o) and proton-density (PD) (flip angle=4o) Dixon gradient-echo (GRE) sequences (TR/TE=7/2.46ms,Voxel size=1.25x1.25x2mm), and Diffusion-weighted imaging (DWI) (TR/TE=11200/77ms, b-values=50,300,600,900s/mm2,voxel size=1x1x4mm) covering the entire lesion.
ii) A pre-contrast 10-echo GRE sequence (TR/TE=100/4.92-68.88ms,voxel size=1.5x1.5x3mm) was performed over a small tumour region centred on a slice chosen by a specialist radiologist.
iii) A high temporal resolution (3ms) dynamic contrast enhanced (DCE)-MRI was obtained (3D Dixon, flip angle=16o,TR/TE=5.74/2.46ms,voxel size=1.5x1.5x3mm, contrast injection at 2ml/s) combined with a PD sequence covering the same tumour volume as in (ii).
iv) The whole lesion 3D datasets in (i) were also acquired post-contrast.
For all MRI visits, T2*, apparent diffusion coefficient (ADC), the initial area under the gadolinium curve (IAUGV60) and the transfer coefficient (Ktrans) maps were calculated for a central tumour volume using in-house software (ADEPT, MRIW). The DCE images were registered using non-rigid registration (MIRT[8], Matlab R2016b). One patient did not receive gadolinium and hence pharmacokinetic analysis was impossible.
For responders, the %viable tumour within the resected specimen was <10% in the final histopathological assessment. Responder and non-responder measurements were compared using the Mann-Whitney U test (p<0.05).
Results
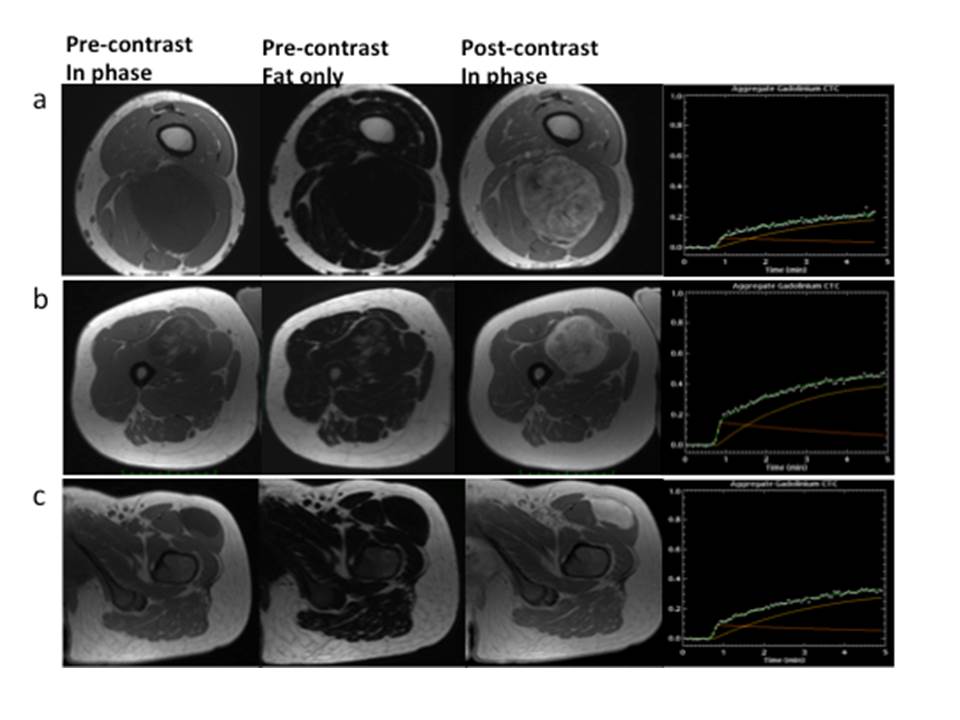
There were 6 responders and 4 non-responders. MLS exhibited low signal intensities on the non-enhanced T1w Dixon images due to its myxoid component [9] (Figure 1a). High signal intensity foci correspond to fat within the tumour (Figure 1b). Both heterogeneous and homogenous enhancement patterns were observed (Figures 1a, 1c respectively), and the tissue enhancement curve was monotonically-increasing (Figure 1d).
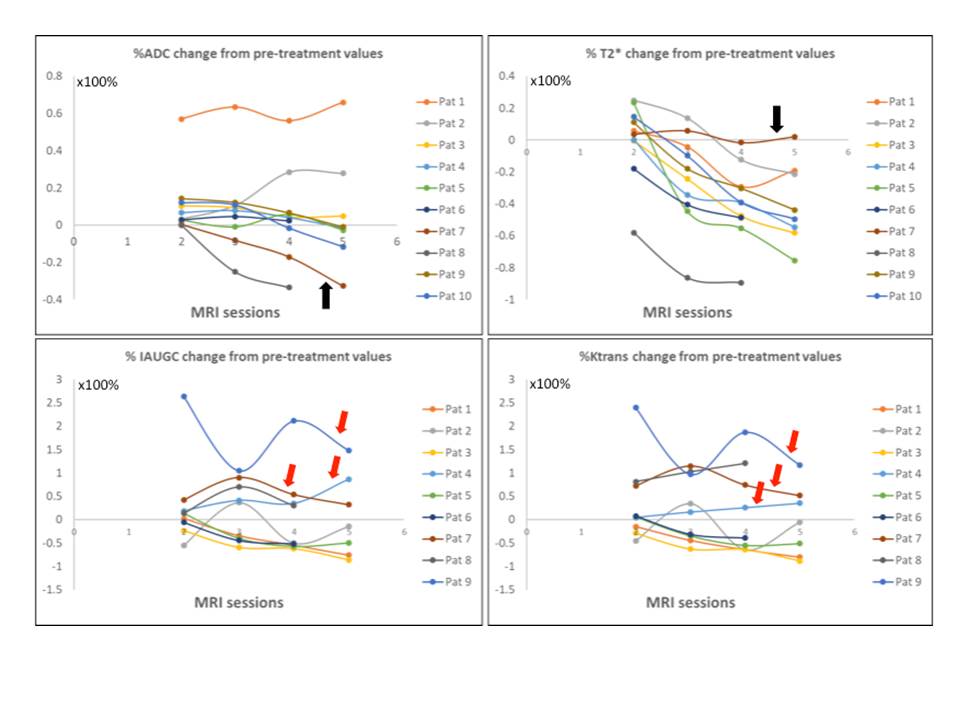
The mean baseline parameter values were: ADC=226.8±37.6mm2/s; T2*=123.9±81.3ms;Ktrans=0.06±0.04min-1;IAUGC60=7.3±5.3mmol*s. For each patient, figure 2 shows % change in all parameters from pre-treatment. There is a general trend for T2* to decrease and for ADC to initially increase but then progressively decrease. RT-induced necrosis was only reported for 1 non-responder. For this patient T2* did not change substantially from its pre-treatment value, but ADC decreased steeply and continuously, reflecting the presence of viable tumour within the excised specimen (Figure 2, black arrows). For the 3 non-responders who received gadolinium, IAUGC60 and Ktrans increased, suggesting these parameters can potentially predict response (Figure 2, red arrows). IAUGC60 and Ktrans %changes were similar throughout.
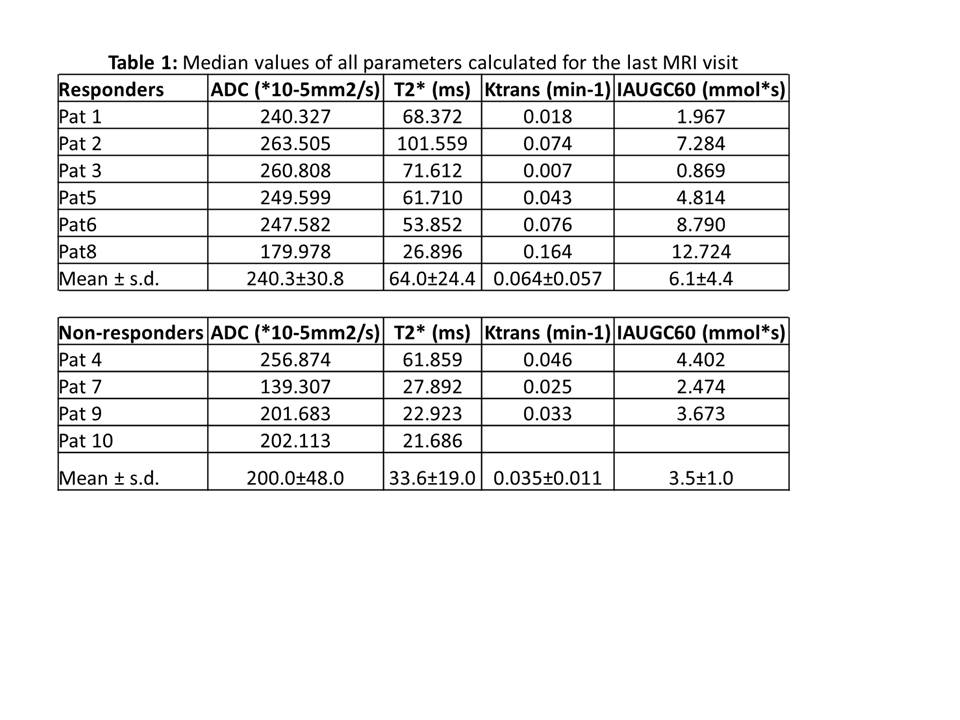
Table 1 lists the median parameter values for all patients and the mean±standard deviation for responders and non-responders from the final MRI visit. There is a trend for responders to have larger ADC, T2*, IAUGC60 and Ktrans values but it was not statistically significant.
Discussion
We used multiparametric MRI in a small cohort to demonstrate the changes in functional parameters before and after radiotherapy. Decreased Ktrans values compared to other tumours [10] and continuous accumulation of contrast-agent at baseline suggest less angiogenesis-induced abnormal vasculature for MLS and large interstitial spaces respectively [11].
Reductions of T2* and ADC during and post-treatment may be consistent with areas of sclerotic tissue. As in [7], permeability and perfusion decreases from baseline in responders show Ktrans and IAUGC60 can potentially predict response.
Our analysis may be affected by registration algorithms and averaging effects; all parameter values are global, fatty tissue or necrosis have not been excluded and functional variations within tumours may cancel out. However, our preliminary analyses show that the relationship between MRI functional parameters is different in responders versus non-responders, and warrants further investigation.
Acknowledgements
CRUK and EPSRC in association with MRC, NHS funding Biomedical Research Centre and Clinical Facility in Imaging.References
1. Chung PW, et al. Cancer. 2009; 115: 3254-61.
2. Roberge D, et al. Radiother Oncol. 2010; 97: 404-407.
3. de Vreeze R, et al. Int J Radiat Oncol Biol Phys 2008; 72: 1480-1487.
4. Moser EC, E.M. et al. Blood 2006; 107: 2912–2919
5. Messiou C, et al. EJC 2016; 56:37-44.
6. Soldatos T, et al. Radiology 2016;278:831-40
7. Huang W, et al. Tomography 2016; 2:308-316.
8. Dr Andriy Myronenko, https://sites.google.com/site/myronenko/research/mirt
9. Sung M et al. 2000;20:1007-1019.
10. Jajamovich GH et al. MAGMA 2016;149-58.
11. Cuenod CA et al. Diagn Interv Radiol 2013;94:1187-1204.
Figures