1543
Creating patient-specific computational head models for the study of tissue-electric field interactions using deformable templates1Novocure, Haifa, Israel, 2Novocure GbmH, Root, Switzerland
Synopsis
Tumor Treating Fields (TTFields) are electric fields at an intermediate frequency approved for treatment of Glioblastoma Multiforme. Understanding how TTFields distribution in the brain influences disease progression can be studied using numerical simulations. Creation of computational patient models involves accurate segmentation of patient MRIs, a task that cannot be performed automatically, and is therefore time-consuming. We present a method for rapidly creating patient head models using a healthy head model as a deformable template. The method is robust even when MRI data quality is low. It is enabling a study correlating the spatial distribution of TTFields and patient outcome.
Introduction
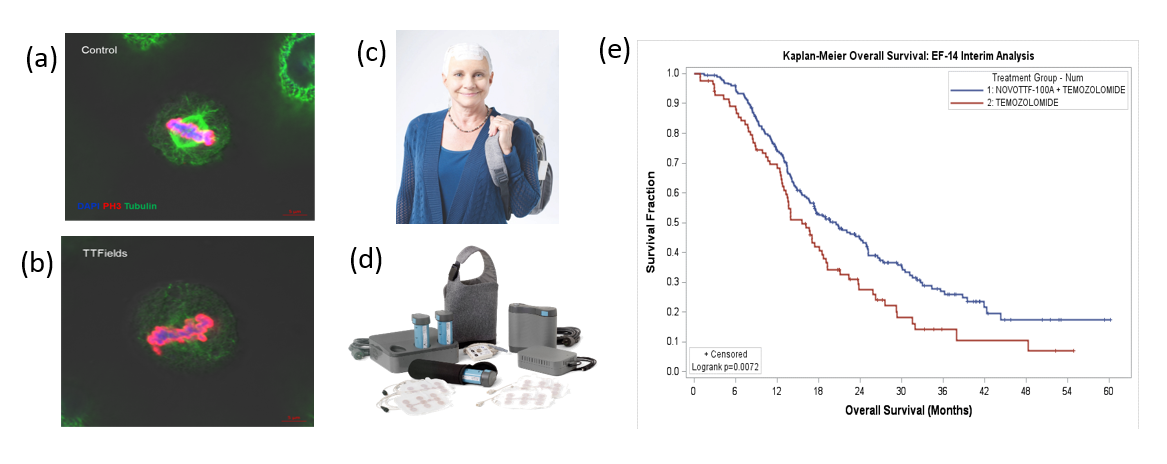
Tumor Treating Fields (TTFields) are low intensity electric fields at a frequency of 100-500 kHz that exert an anti-mitotic effect on cancer cells (figure 1). A pivotal clinical trial (EF-14) demonstrated that combining TTFields with chemoradiation extends Overall Survival (OS) of newly diagnosed Glioblastoma Multiforme (GBM) patients by over 5 months1 (Figure 1). When treating GBM, TTFields are delivered to the brain through two pairs of transducer arrays placed on the patient’s scalp. TTFields distribution in the brain is heterogeneous and depends on the position of the arrays, patient anatomy and the electric properties of the tissues and tumor2. Understanding how this field distribution influences disease progression is important to optimizing delivery of TTFields. Measuring field distributions within the brain is challenging. Therefore, numerical simulations of field distributions in a large number of patients is the only practical means for studying this topic. However, the preparation of a realistic computational patient models involves accurate segmentation of patient MRIs, a task that cannot be performed in a fully automatic manner, and is therefore time consuming. In addition, in clinical scenarios, MRI acquisition time is often reduced by increasing the slice spacing, limiting the field of view to the region of the tumor, or increasing scan speed, leading to increased background noise, aliasing and MRI data covering a limited field of view all of which hamper attempts to rapidly create computational models of patients. To overcome these limitations, we have developed a method in which a realistic head model of a healthy individual is used as a deformable template with which the patient model is derived.Methods
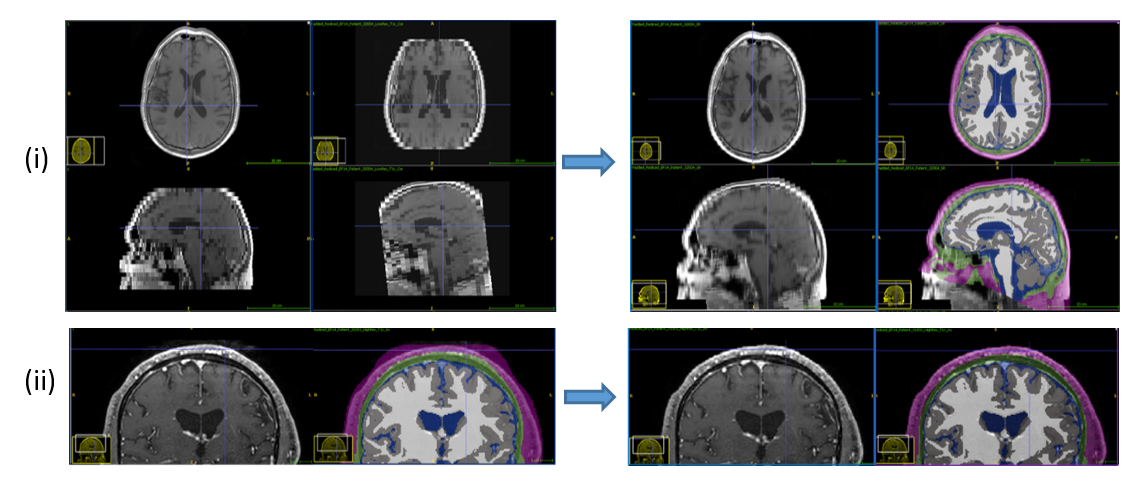
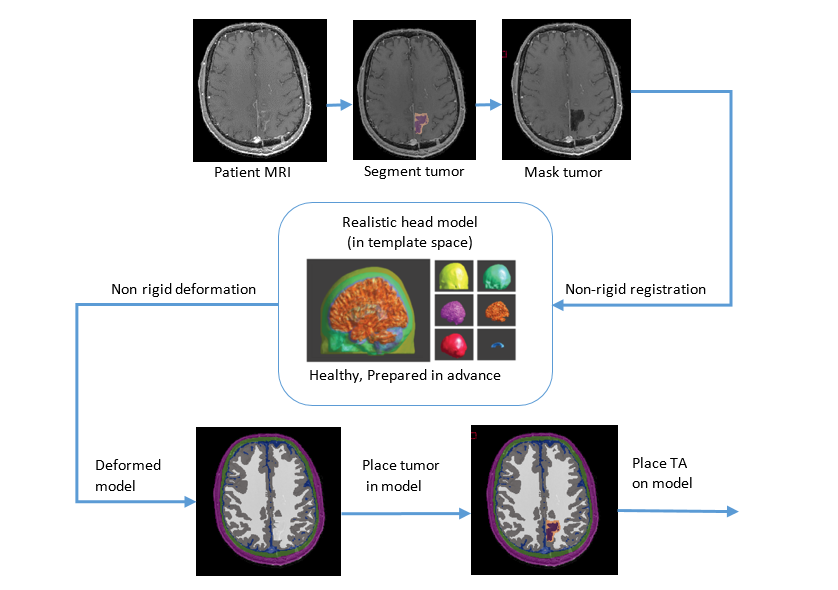
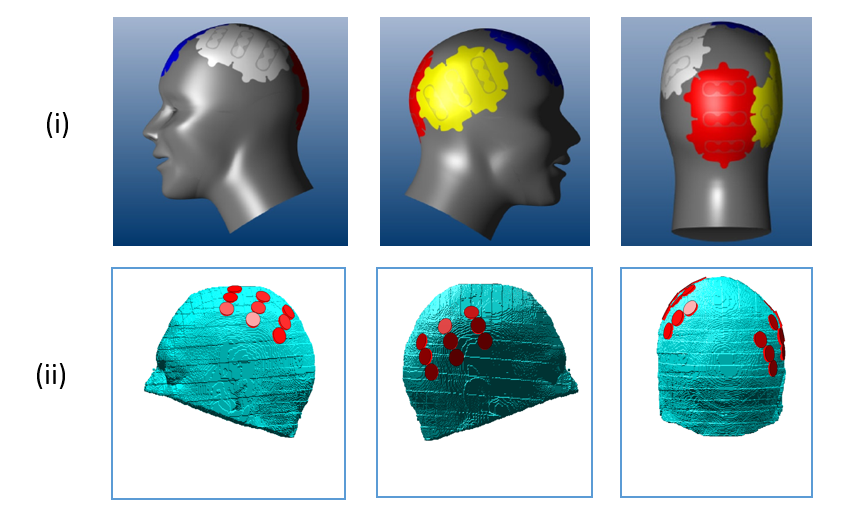
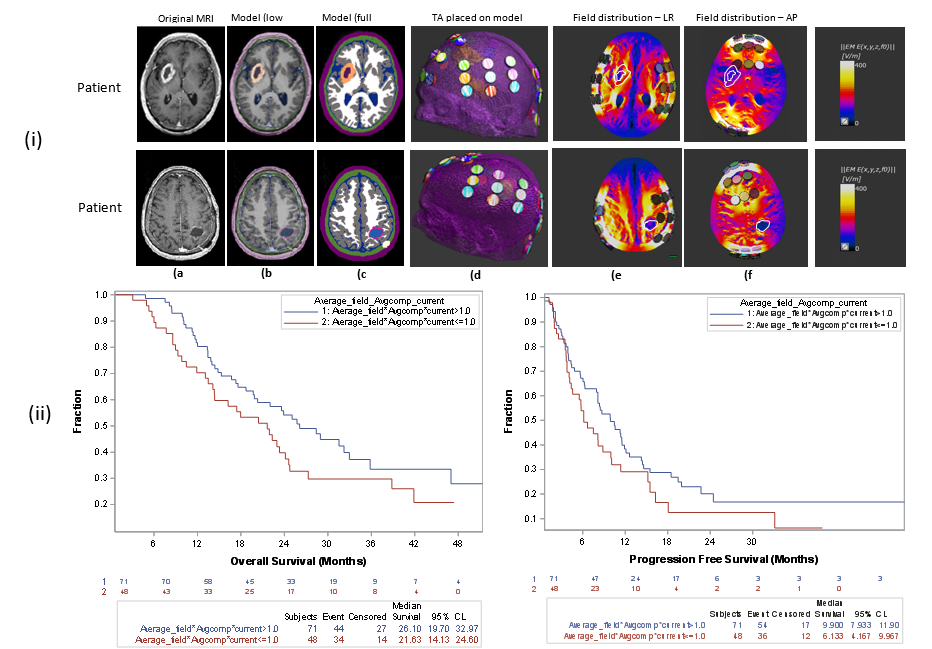
A prerequisite for our method is the creation of a highly detailed healthy head model which serves as a deformable template from which patient models are created. Prior to creating the patient model the MRI datasets undergo preprocessing. Prepocessing involves a combination of denoising and background noise reduction, as well as application of super-resolution algorithms3 when needed. The super-resolution algorithms are used to either decrease line-spacing or increase the field of view to include the entire head (Figure 2). Next, the tumor is segmented manually and masked followed by, non-rigid registration of the healthy regions of the patient MRI images on to a 3D image representing the deformable template. The registration yields a non-rigid mapping of the patient's head in to the template space, as well as the inverse transformation that maps the template in to the patient space. The inverse transformation is applied to the 3D deformable template and an approximation of the patient head in the absence of tumor is found. The segmented tumor is planted back into the deformed template to yield a full patient model (Figure 3). Next, automatic identification of landmarks on the patient’s head is used to set the position of the transducer arrays on the head, and the transducer arrays are introduced into the model using a previously described algorithm4 (Figure 4). Finally, boundary conditions are set, and delivery of the field is simulated using Finite Differences Time Domain (FDTD) method (Sim4Life V3.0, ZMT-Zurich)Results
To date, we have simulated field delivery to over 119 patients that were treated with TTFields as part of the EF-14 trial. To test the hypothesis that patient outcome correlates with field intensity field intensity, distributions in a tumor bed comprising the Gross Tumor Volume (GTV) and a Proximal Boundary Zone extending 1 cm from the GTV were derived (figure 2). In addition, the average compliance (fraction of time patient receives active treatment) and average current delivered to the patients over the first six months were extracted from Optune™ (The devices used to deliver TTFields) output log files. Using these data, Eaverage: the average field intensity in the tumor bed multiplied by compliance and average current was calculated for each patient. Patients were divided into two groups based on threshold values of Eaverage, and OS and Progression Free Survival (PFS) of the groups were compared. A threshold value of Eaverage =1.0 V/cm yielded the most statistically significant difference in OS between the groups (figure 5), suggesting that higher field intensity in the tumor bed is associated with improved patient outcome.Conclusions and discussion
Our process for rapidly creating patient presents a breakthrough that has enabled the first study in which the spatial distribution of therapeutic electric fields have been correlated with patient outcome. In the future similar techniques could be used for clinical studies investigating other electrotherapeutics such as Trans-Cranial Direct Current Stimulation or Trans Cranial Magnetic Stimulation.Acknowledgements
No acknowledgement found.References
1. Stupp, Roger, et al. "Maintenance therapy with tumor-treating fields plus temozolomide vs temozolomide alone for glioblastoma: a randomized clinical trial." Jama 314.23 (2015): 2535-2543.
2. Wenger, Cornelia, et al. "Improving Tumor Treating Fields treatment efficacy in patients with glioblastoma using personalized array layouts." International Journal of Radiation Oncology* Biology* Physics 94.5 (2016): 1137-1143.
3. Woo, Jonghye, et al. "Reconstruction of high-resolution tongue volumes from MRI." IEEE Transactions on Biomedical Engineering59.12 (2012): 3511-3524.
4. Bomzon, Z., et al. "Modelling tumor treating fields for the treatment of lung-based tumors." Engineering in Medicine and Biology Society (EMBC), 2015 37th Annual International Conference of the IEEE. IEEE, 2015.
5. Yushkevich, Paul A., et al. "User-guided 3D active contour segmentation of anatomical structures: significantly improved efficiency and reliability." Neuroimage 31.3 (2006): 1116-1128.
6. Friston, Karl J. "Statistical parametric mapping and other analyses of functional imaging data." Arthur W. Toga and John C. Mazziotta, editors, Brain Mapping: The Methods (1996): 363-386.
Figures