1535
Multiparametric MR approach for monitoring the pathological response of breast cancer patients to neoadjuvant chemotherapy1Department of NMR and MRI Facility, All India Institute of Medical Sciences, New Delhi, India, 2Department of Pathology, All India Institute of Medical Sciences, New Delhi, India, 3Department of Surgery, All India Institute of Medical Sciences, New Delhi, India
Synopsis
A multiparametric MR approach using total choline (tCho), apparent diffusion coefficient (ADC) and tumor volume was undertaken for prediction of pathological response in 42 locally advanced breast cancer (LABC) patients undergoing neoadjuvant chemotherapy (NACT). 24 were pathologically responders (complete and partial) while 18 were non-responders. Percentage change in tCho, ADC and volume was higher in pathological responders than in non-responders after III NACT. Individually, all three parameters showed equal sensitivity (66.7%) with specificity in the range 64.7% to 70.6% for pathological response prediction. Combination of all three MR parameters yielded 66.7% sensitivity and a specificity of 64.7%.
Introduction:
Neoadjuvant chemotherapy (NACT) is the standard care to reduce tumor size to facilitate breast conservation surgery. Chemotherapy has several side effects and the response rate is variable while complete pathologic response rates are much lower (10 to 30%). Thus, it is essential to monitor tumor response to avoid toxic effects of chemotherapy in non-responders. Several MR parameters are used for assessing therapeutic response and the present study was designed to carry out sequential multi-parametric MR measurements to investigate systematically the changes in tCho, ADC and tumor volume in patients undergoing NACT and to determine its potential clinical utility in the pathological assessment of tumor response.
Methods:
42 breast cancer patients were investigated at 1.5T. Institutional ethical committee approved the study and written informed consents were obtained. Patients were evaluated using triple assessment criteria that included clinical history, physical examination and radiological assessment and pathology evaluation. TNM criteria were followed for the clinical staging. Biopsied tissues were subjected to histology and immunohistochemical examinations. Assessment of treatment response was by Miller Payne (MP) grading system. Fat saturated T2W images were acquired in three orthogonal planes using short inversion recovery sequence (TR/TE = 6940/58ms; slice thickness = 3 to 5 mm with no slice gap; matrix size = 320 × 256). Pre-therapy (Tp0) MR was performed one week after core biopsy. A total of 145 MR investigations were carried out on 42 patients. All had their pre-therapy MR at Tp0. 38 patients were monitored one week after I NACT (Tp1), twenty four after II NACT (Tp2) and 41 after III NACT (Tp3). A single-shot echo planar imaging (EPI) sequence was used to acquire DW images in transverse plane covering both the breasts (b = 0, 500 and 1000 s/mm2; TR/TE = 5000/87 ms; NS = 1; EPI factor =128; acquisition matrix = 128 × 128; and slice thickness = 5 mm without any inter slice gap. Single voxel in-vivo 1H MRS was acquired using PRESS (TR/TE = 1500/100 ms with 128 averages) with water and lipid suppression. A voxel of appropriate size depending on tumor volume was used. Internal water signal was used as reference for tCho concentration calculation1 by acquiring an additional spectrum of the same voxel without water and lipid suppression.
Results and Discussion:
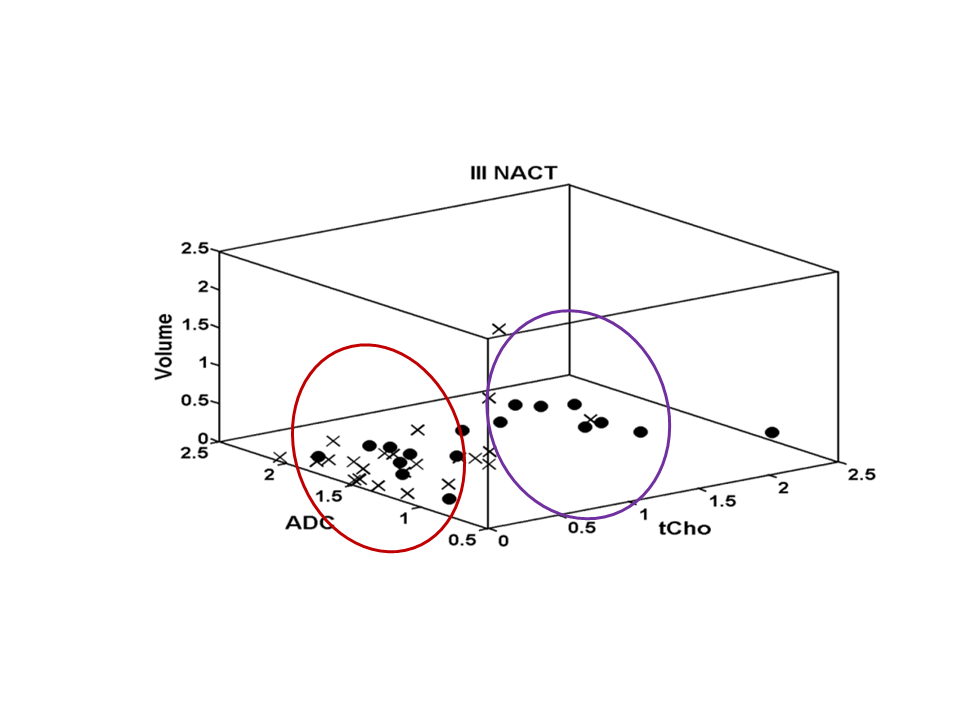
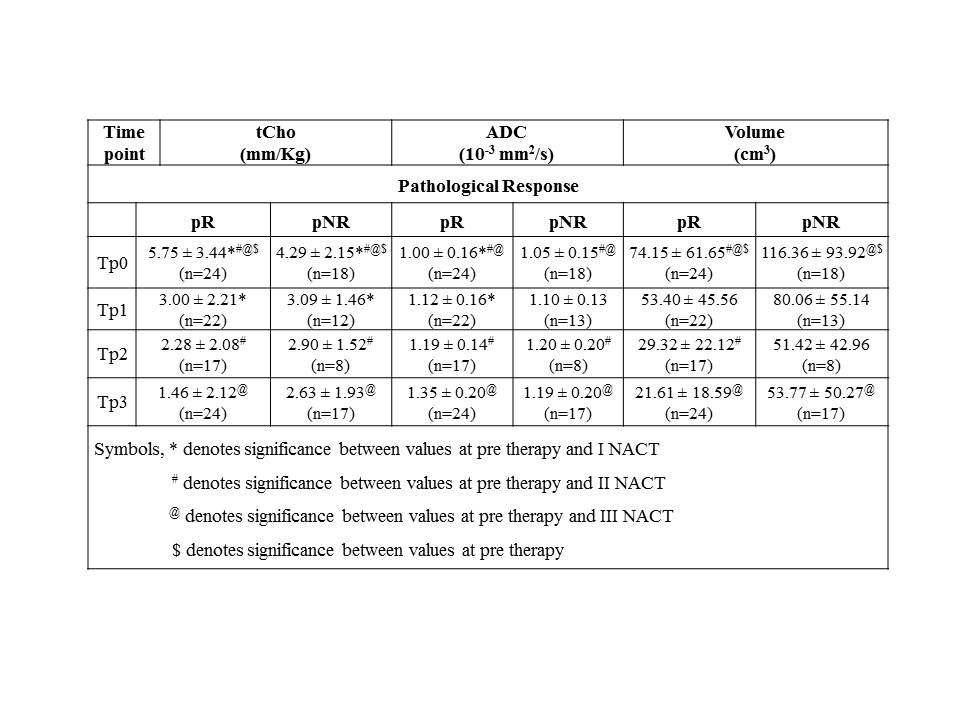
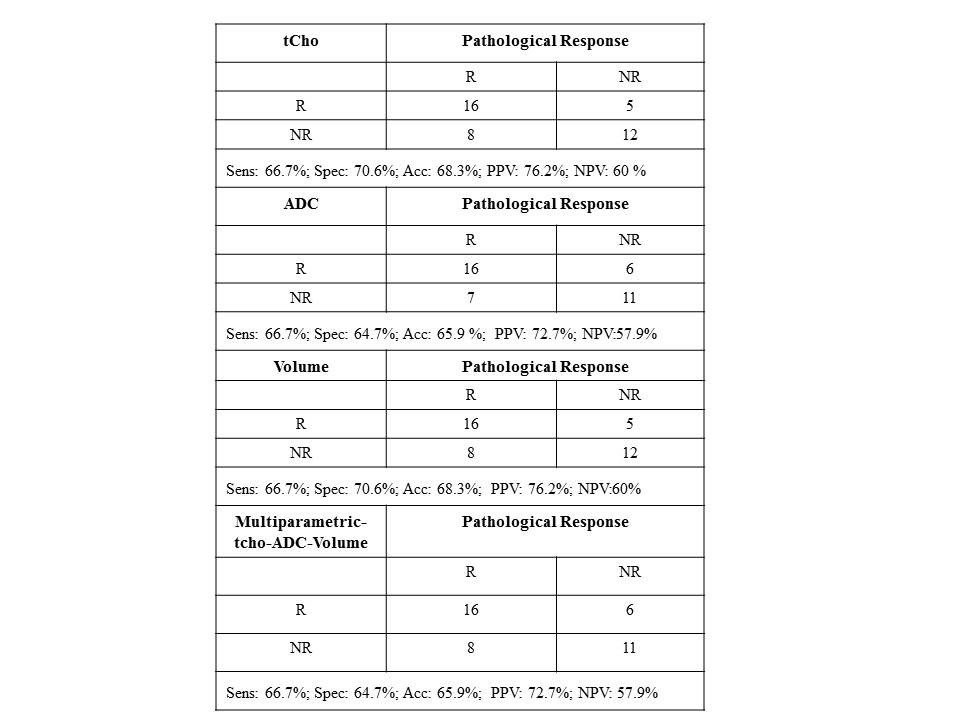
24 were pathologically responders [complete and partial] while 18 were non-responders. 6/24 was complete responders and 5/6 showed tCho higher than cut-off (2.54mm/kg)1 and all had ADC lower than cut-off (1.23 x ×10−3 mm2/s)2, indicating cancer. All 6 patients showed no tCho, increased ADC and tumor volume reduced by 81.7% after Tp3, indicating response. Out of 18 partial responders, 16 showed tCho above cut-off and ADC below cut-off, indicating cancer. After therapy, MRS showed response in 12/16 and tumor volume reduced in 14/16 patients. Combining complete and partial responders gave 24 as responders. 21/24 had MRS and 22/24 had ADC positive for cancer at pre-therapy. After Tp3, 18/24 showed response on MRS while 14/24 showed reduced volume. Further, tCho at Tp0 in responders was higher (Table 1) and percentage reduction following Tp3 was significantly higher (-73.2 ± 36.0) compared to non-responders (-30.3 ± 59.5). At Tp0 no significant difference in ADC was seen between responders and non-responders. At Tp3, a significantly higher percentage increase in ADC of responders (37.6 ± 30.0) was seen compared to non-responders (18.6 ± 30.5). At Tp0, the tumor volume was lower in responders (74.2 ± 61.65 cm3) compared to non-responders (116.36 ± 93.92 cm3). At Tp3, the reduction in volume of responders (-61.9 ± 44.8) was higher compared to non-responders (-47.0 ± 32.8), although not statistically significant. Figure-1 shows 3D matrix graph of normalized values of tCho, ADC and volume showing a clear differentiation of responders and non-responders at Tp3. Response to NACT is variable in individuals and identification of non-responders would facilitate treatment management like change of therapy or surgery. Higher pre-therapy tCho seen in responders at Tp0 suggests that tumors with high metabolic activity respond better to chemotherapy. Increased ADC after Tp3 indicates the outcome of chemotherapy-induced cell apoptosis leading to decreased cellularity. Tumor volume showed an increased percentage reduction in responders after Tp3. Sensitivity and specificity to detect responders was similar for tCho and volume (sensitivity 66.7% and specificity 70.6%; Table 2). Combining tCho, ADC and volume gave a sensitivity of 66.7%, specificity of 64.7% and accuracy of 65.9% to predict response.
Conclusion:
Our study indicated that mpMRI is useful to non-invasively monitor tumor response to therapy and the results can be correlated with pathological response.
Acknowledgements
Science and Engineering Research Board (SERB), Government of India is acknowledged for financial support (SP/SO/HS-80/2006 and SR/SO/HS/213/2012) and J.C. Bose Fellowship to NRJ. KA acknowledges the Indian Council of Medical Research, New Delhi for Senior Research Fellowship [3/2/2/241/2014/NCD-III(OPA-31710)].References
(1). Sah RG, Sharma U, Parshad R, Seenu V, Mathur SR, Jagannathan NR. Association of estrogen receptor, progesterone receptor, and human epidermal growth factor receptor 2 status with total choline concentration and tumor volume in breast cancer patients: An MRI and in vivo proton MRS study. Magn. Reson. Med. 2012;68:1039-1047. (2). Sharma U, Sah RG, Agarwal K, et al. Potential of diffusion weighted imaging (DWI) in the characterization of malignant, benign and normal breast tissues and molecular sub-types of breast cancer. Front. Oncol. 2016;6:12.Figures