1534
The relationship of R1rho to aqueous pH and macromolecular density1University of Cambridge, Cambridge, United Kingdom
Synopsis
We investigated the sensitivity of R1rho MRI to pH and macromolecular density in in vitro phantoms and in brains of volunteers to assess its suitability as an imaging modality for detecting and assessing the response of brain tumours. We find the dependence of R1rho signal on pH in the presence of macromolecules, but a lack of pH dependence in their absence. We confirm R1rho sensitivity to macromolecular density at constant pH.
INTRODUCTION
An acidic extracellular pH is characteristic of the tumour microenvironment, attributed largely to lactate accumulation secondary to the Warburg effect.1 Despite the availability of traditional techniques for monitoring pH, such as 31P spectroscopy, there is a need for new technologies with superior spatial resolution and shorter acquisition times, which are also compatible with commonly available hardware. A non-invasive pH-sensitive imaging method, such as R1rho (1/T1rho), could improve the characterisation of the acidic environment of tumours in the brain, both for diagnosis and treatment response.2 Here we investigated the MRI sensitivity of R1rho to pH and macromolecular density, both in vitro and in human volunteers and find that the R1rho signal is likely to be more heavily influenced by macromolecular density than pH alone.METHODS AND MATERIALS
Phantoms of controlled pH were prepared in 2.0 mL microcentrifuge tubes. Phantom composition was varied using agarose, milk, bovine serum albumin (BSA) and GadovistⓇ. pH was adjusted using HPCE buffer solution (pH 6.5 and 8.5, 20 mM Na2PO4), NaOH/HCl, and monosodium phosphate and disodium phosphate solutions (100 mM Na+). Phantoms were imaged while submerged in water using a 3D Fast Spin Echo (3D-FSE) with R1rho preparation to measure R1rho relaxation using a head coil on a 3T MRI (MR750, GE Healthcare) with B1,TSL=500 Hz, TSL=1,15,25,40ms, TR=1587ms, resolution=0.3x0.3mm2, matrix=320x256, NEX=0.5, Asset=0.5. R1rho measurements were also acquired on 7 healthy male volunteer brains (median age=21). Regions-of-interest (ROI) in phantoms were drawn centrally and averaged across 3 acquisitions. ROI in brain scans were positioned in different regions of white and grey matter, and basal ganglia.RESULTS
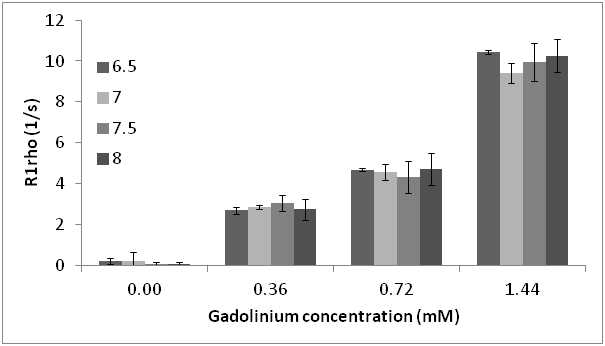
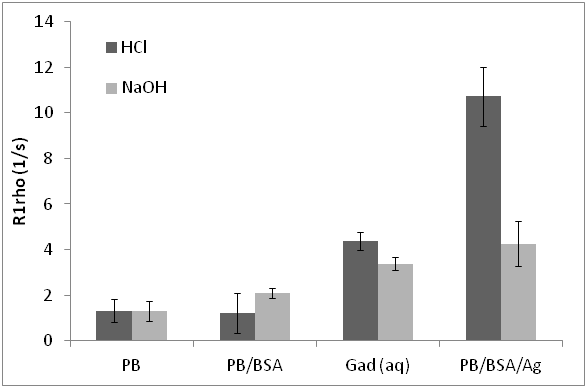
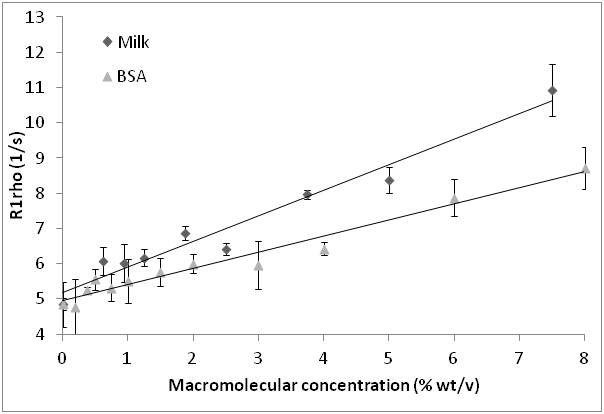
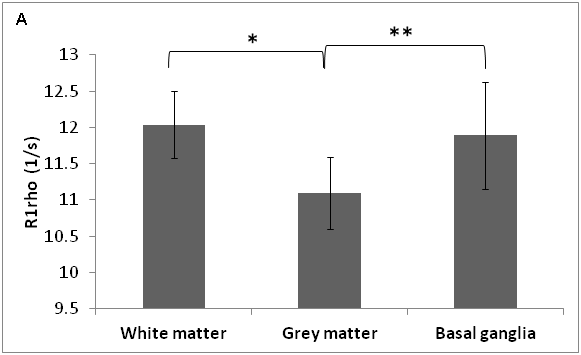
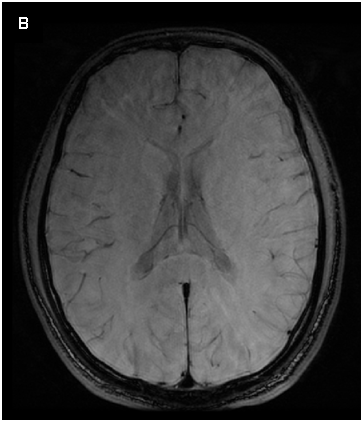
No significant difference in R1rho was observed between HPCE-buffered phantoms in the range pH=6.5-8.0 (Fig 1), and in phosphate-buffered or aqueous gadolinium-doped phantoms of pH 4.5 and 9, despite a 105-fold change in proton concentration (Fig 2a-2c). Significant R1rho pH-dependence occurred with agarose inclusion, accompanied by visible structural changes in the phantoms (Fig 2d). At constant pH, increasing the phantom macromolecular density with milk or BSA correlated with R1rho (Fig 3). R1rho brain imaging demonstrated good anatomical discrimination, with significant differences between white and grey matter (p<0.001), and grey matter and basal ganglia (p<0.05), which have established macromolecular differences (Fig 4).DISCUSSION
We demonstrate that T1rho relaxation rate (R1rho) is not sensitive to changes in pH, for ranges that extend beyond physiological pH. We observed no pH dependence in phantoms in the absence of macromolecules. These results suggest that R1rho is unlikely to be a useful reporter of extracellular pH in the tumour microenvironment. Our results suggest that attempts to estimate pH using R1rho must consider regional macromolecular density.
Previous work demonstrated R1rho sensitivity to physiologic pH in agarose phantoms2. We observed a similar R1rho change in agarose phantoms with varied pH. We also observed a visible structural change upon acidification of agarose, suggesting that the pH altered the density of the phantom, and influenced the R1rho signal. To explore this further, we produced phantoms with different concentrations of macromolecules, both milk as a mixture of lipids, proteins and carbohydrate and BSA as a homogeneous protein solution. In these experiments, R1rho was found to increase linearly with increasing macromolecular density, corroborating our previous findings.
We investigated whether the macromolecule density relationship held true in vivo, and found significant differences in R1rho signal between structurally distinct brain regions.
CONCLUSION
Local pH in the brain influences and is influenced by a wide range of variables which collectively represent a coordinated physiological response. pH changes are accompanied by local microenvironmental alterations, such as vasodilatation, modulation of transmembrane ion transport and changes in electrostatic potentials.3,4 These variables likely confound the R1rho signal. Here, we show that regional differences in macromolecular density could influence the degree of pH-dependence of R1rho. Future studies are required to elucidate the individual contribution of each parameter to R1rho before it can be used as a clinical marker of pH. In particular, it is important to disentangle the effect on macromolecular density of anatomical structural differences from regional density changes as a result of activity-dependent variations in blood flow.Acknowledgements
No acknowledgement found.References
1. Kato, Y. et al. Acidic extracellular microenvironment and cancer. Cancer Cell Int. 13, 89 (2013).
2. Magnotta, V. A. et al. Detecting activity-evoked pH changes in human brain. Proc. Natl. Acad. Sci. 109, 8270–8273 (2012).
3. Yoon, S., Zuccarello, M. & Rapoport, R. M. pCO(2) and pH regulation of cerebral blood flow. Front. Physiol. 3, 365 (2012).
4. Minireview: pH and synaptic transmission. FEBS Lett. 587, 1923–1928 (2013).
Figures