1532
Co-registration of MRI and histological habitats in pre-clinical tumor modelsBruna Victorasso Jardim-Perassi1, Suning Huang1, William Dominguez-Viqueira1, Epifanio Ruiz1, Mikalai Budzevich1, Jan Poleszczuk2, Marilyn Bui3, Robert Gillies1, and Gary Martinez1
1Cancer Imaging and Metabolism, Moffitt Cancer Center, Tampa, FL, United States, 2Nalecz Institute of Biocybernetics and Biomedical Engineering, Warsaw, Poland, 3Pathology Anatomic, Moffitt Cancer Center, Tampa, FL, United States
Synopsis
Tumor heterogeneity, may give insight into natural selection through detection of tumor sub-regions, referred as imaging habitats. We used statistical clustering of multiple pixels based on multiple MRI parameter maps to identify tumor habitats in pre-clinical models of sarcoma and breast cancer using T2, T2*, ADC and three model free parameter maps determined from dynamic contrast enhanced images. MRI-derived habitat maps were determined by clustering multidimensional voxels using a Gaussian mixture model. 3D-printed tumor molds were used to successfully co-register MR imaging slices with their histological habitat-counterparts. Four distinct tumor habitats were detected by MRI and biologically corroborated by histology.
Introduction
Soft tissue sarcomas are originated from mesenchymal tissues, showing subtypes with various cytogenetic profiles conferring treatment resistances1. Breast cancer is the most common among women and it shows distinct subtypes with prognostic significance2. Solid tumors are recognized by a microenvironment3 that provides selection pressures, which drive natural selection, creating tumor sub-regions, referred as “habitats”4,5. Thus, identifying tumor habitats in vivo may be a promising clinical prognostic tool to assess therapeutic response; however, discerning the subtle physiological and biophysical differences between regions is currently a challenge. We used statistical clustering of multiple pixels based on multiple MRI parameter maps to identify tumor habitats. A 3D-printed tumor mold was used to co-register MR imaging slices with their histological counterparts.Methods
Patient-derived osteosarcoma was implanted in nude mice. For breast cancer, a murine triple negative breast cancer cell line (4T1) was implanted in MFP of Balb/c mice. Mice were imaged on a Biospec AV3HD 7-T horizontal magnet (Bruker Biospin, Inc.) with nested 205/120/HDS gradient insert and 310 mm bore, by using a 35 mm birdcage coil (Doty Scientific). Axial T2-weighted images, T2* and T2 maps were obtained with TurboRARE sequence (TR/TE=2000/70 ms, 11 slices, slice thickness of 1 mm, FOV=30 x 30 mm). Diffusion-weighted images were acquired using b values 100, 500 and 750 s/mm2 and TR/TE=700/15.7 ms. T1 weighted dynamic contrast enhanced (DCE) images were acquired upon injection of 0.2 mmol/kg Gd-DTPA. MRI-derived habitat maps were created by clustering multidimensional voxels, composed of six dimensional MRI parameter maps, using Gaussian mixture model (GMM) and fit with an expectation maximization algorithm in MATLAB. Tumors were segmented using T2-images and exported as a 3D-surface to create a 3D-printed mold, which was oriented to obtain 2-mm tissue slices aligned with the MRIs. Tumor slices were fixed and stained with hematoxylin & eosin (H&E) and with CD-31 (vasculature), CA-IX and pimonizadole (hypoxia) by immunohistochemistry (IHC). An optimized 3D alignment of MRI and histological slices was obtained using a custom MATLAB code by the following process. Histological and IHC image segmentation were digitized and analyzed using VisioPharm® software and then downsampled into complex superpixels to match the resolution of MRI-derived maps. Histological habitats were determined using information from H&E and IHC sections together. In MATLAB, a rule set was applied to the multiple downsampled pixels that correspond to each MRI pixel as follows: 1) pixels that were classified according to the H&E sections as either viable or nonviable. 2) IHC sections stained for pimonidazole or CA-IX were used to determine whether there were enough stained subpixels (above a threshold of 15%) within each superpixel to label it as hypoxic. Finally, an analogous rule was applied to CD31-stained sections, and the superpixels that tested positive were deemed viable. The final pixel classifications resulted in four different habitats: viable, viable/hypoxic, hypoxic/nonviable, and nonviable.Results & Discussion
We showed a novel analysis of multiparametric MRI-data and co-registration with histology to assess intratumoral heterogeneity by detecting tumor habitats in sarcoma and breast cancer models. By using a 3D-printed tumor mold, we were able to successfully align MRI and histological slices (Fig. 1). Four distinct tumor habitats were detected by clustering the MRI parameter maps values simultaneous with the algorithm based on GMM (Fig. 2). Histological image segmentation classified cells as viable or nonviable, based on cell morphology observed in H&E and CD-31 staining. Hypoxic areas were identified on the viable or nonviable sub-regions (Fig. 3). Thus, the corresponding histological slices were also segmented into four habitats, showing a similar spatial distribution to MRI-derived habitat maps, although it was more evident in breast cancer (Fig. 4) than sarcoma (Fig 5). Sarcomas were less heterogeneous in MRI, showing few to no nonviable areas in histology, while in breast tumor the habitats were more delimited. Tumors were mostly composed of nonviable cells in the core and viable cells in the edge, which corresponded to areas with low and high enhancement in DCE, respectively (Fig 4). Hypoxia was observed mainly in peri-necrotic areas, extending to the viable cell areas and these regions showed moderate enhancement in DCE. Interestingly, the habitat in magenta could represent a population of viable cells adapted to local hypoxic conditions (Fig 4).Conclusion
This methodology can potentially detect distinctly different tumor habitats that are confirmed by histology. We present a novel and efficient method for co-registration of MRI and histology, and showed that multiple imaging sequences permit the quantification of the spatial heterogeneity of physiologically distinct tumor habitats. This approach could potentially be used as a non-invasive imaging method for monitor intratumoral heterogeneity during the cancer therapy.Acknowledgements
This work has been supported by a NIH grant awarded through the NCI (grant number 5R01CA187532).References
- Fletcher, C. D. M. The evolving classification of soft tissue tumours - an update based on the new 2013 WHO classification. Histopathology. 2014;64: 2–11. 2.
- Allott EH, Geradts J, Sun X, et al. Intratumoral heterogeneity as a source of discordance in breast cancer biomarker classification. Breast Cancer Res.2016;18(1):68. 3.
- Ungefroren H, Sebens S, Seidl D, et al. Interaction of tumor cells with the microenvironment. Cell Commun Signal. 2011;9:18. 4.
- Gillies, R.J., Gatenby, R.A. Metabolism and Its Sequelae in Cancer Evolution and Therapy. Cancer J. 2015;21(2):88-96. 5.
- Chang YC, Ackerstaff E, Tschudi Y, et al. Delineation of Tumor Habitats based on Dynamic Contrast Enhanced MRI. Sci Rep. 2017;7(1):9746.
Figures
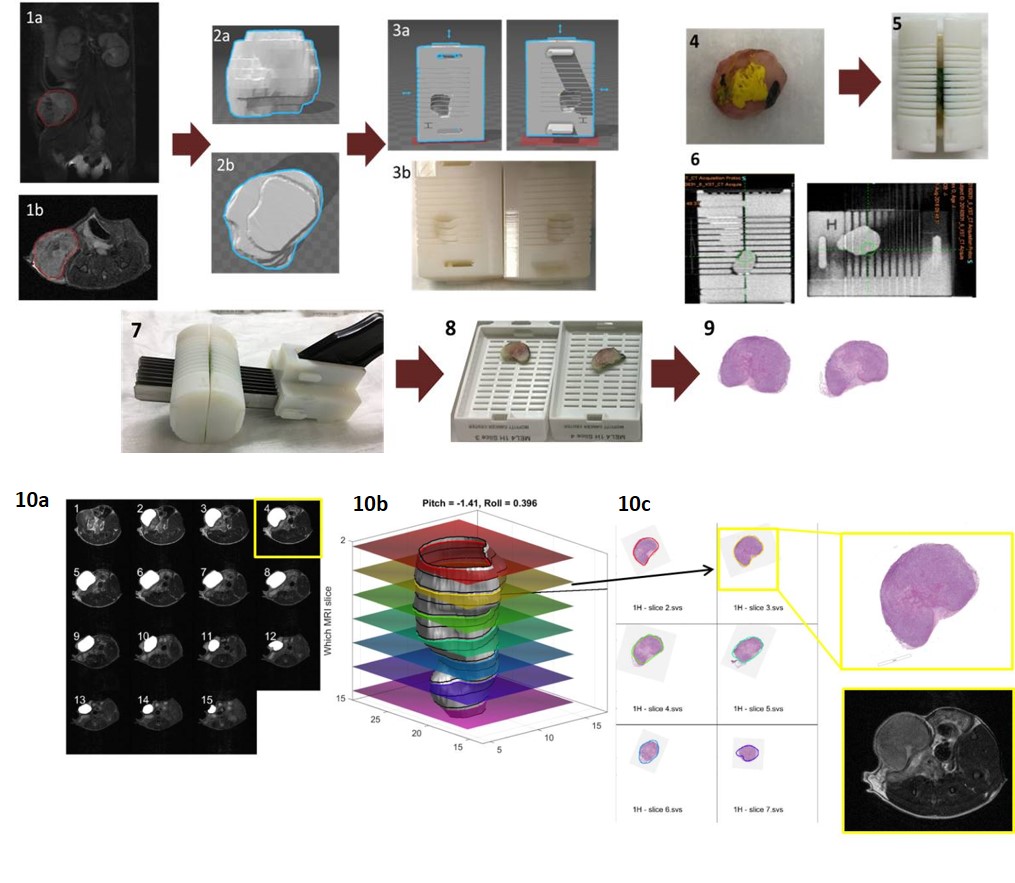
Figure 1. Alignment of MRI
and histological slices in
breast cancer model. (1a.b) Tumor ROI
(red) in MRI T2; (2a,b)
3D tumor reconstruction; (3a) Mold designed in SOLIDWORKS and (3b)
3D-printed; (4) Tumor
was painted to help the orientation and (5) put into 3D-printed mold;
(6) CT image; (7) Tumor was cut in 2-mm slices, (8)
placed into individual cassettes and (9) stained with H&E; (10a,b)
3D tumor representation obtained by MRI (grey) and overlay of co-registered
histological slices (10c) Histology
images co-registered to the contours of the tumor on the surface on ‘b’ by a custom MATLAB algorithm.
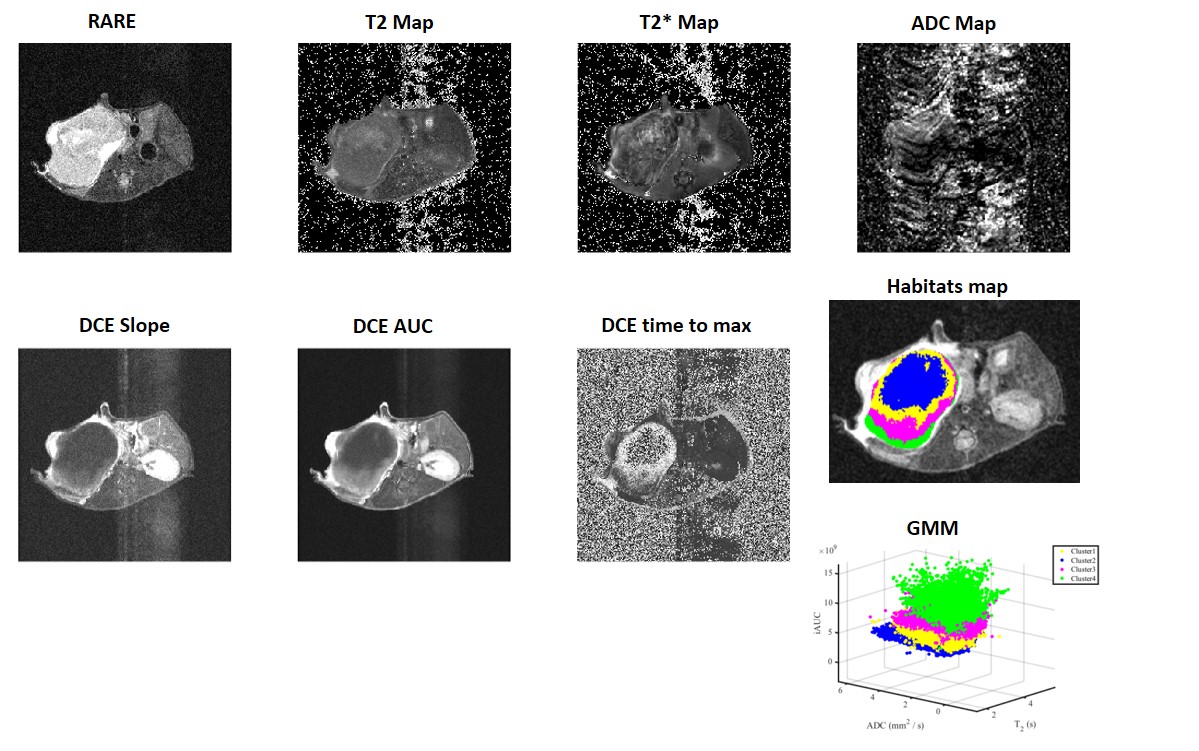
Figure 2. MRI sequences
obtained from a 4T1 breast tumor model and clustered into four habitats using
Gaussian mixture model (GMM). The respective sequences are: Anatomical T2
reference image obtained with a TurboRARE sequence; T2cpmg Map; T2* Map;
ADC Map calculated from Diffusion-weighted MRI; Slope, area under the curve
(iAUC) and time to max Map generated from T1 weighted dynamic contrast enhanced
(DCE) and the spatial mapping outcomes generated by a GMM clustering.
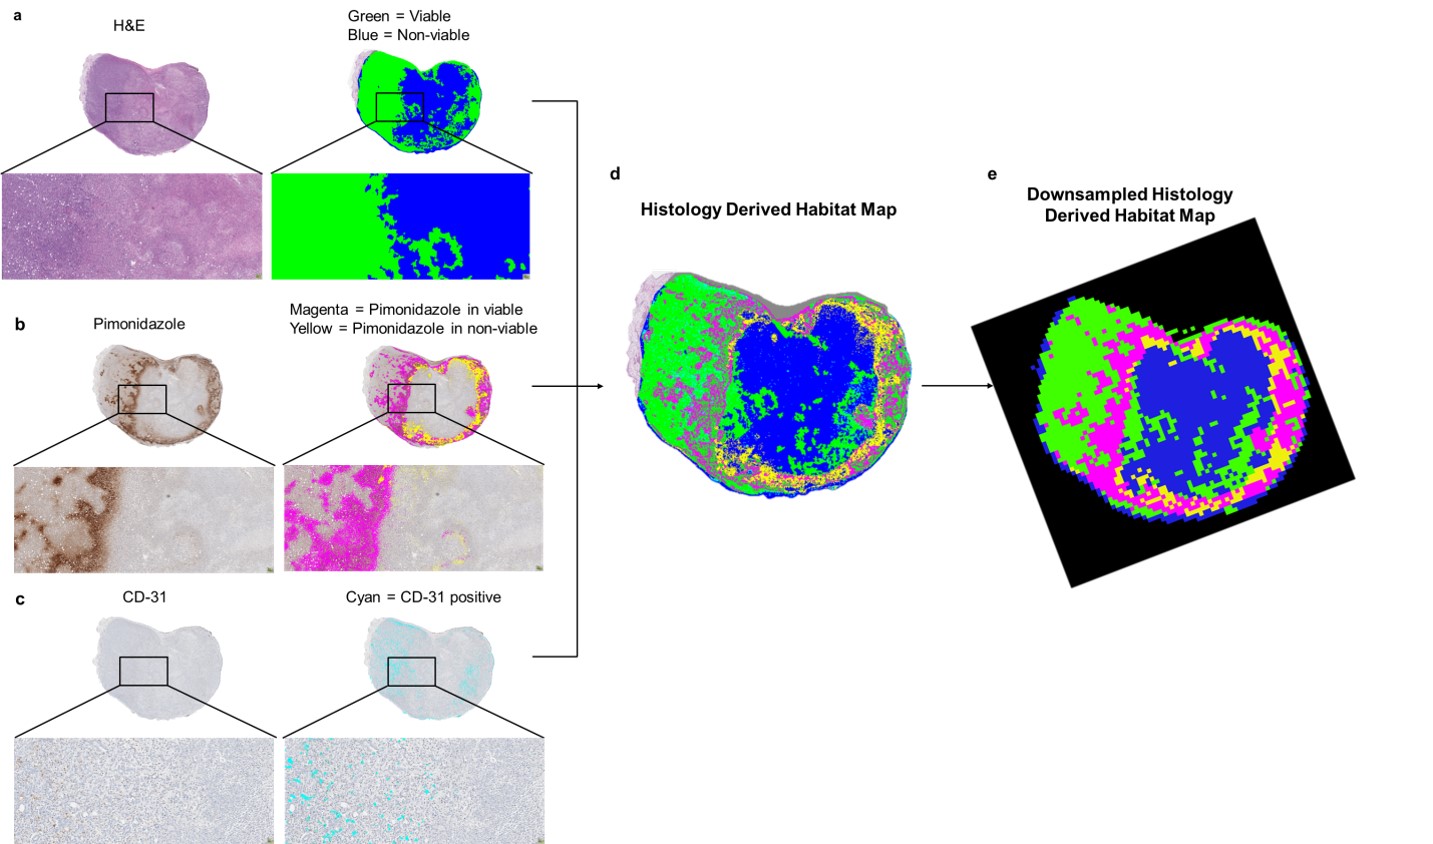
Figure 3. Segmentation of
histological tumor sections. (a) Tumor section stained with H&E
and masked representation of viable (green) and nonviable (blue) cells; (b) Tumor section stained with
pimonidazole and masked representation of positive pixels for pimonidazole in
viable (magenta) and nonviable (yellow) regions; (c) Tumor section stained
with CD-31 and masked representation of CD-31 positive pixels (cyan). (d) Superimposed image
classifying 4 habitats, represented as viable cells in green and nonviable
cells in blue, hypoxic areas in viable cells regions in magenta and hypoxia
areas in nonviable cells regions in yellow. (e) Downsampled image at the same MRI resolution.
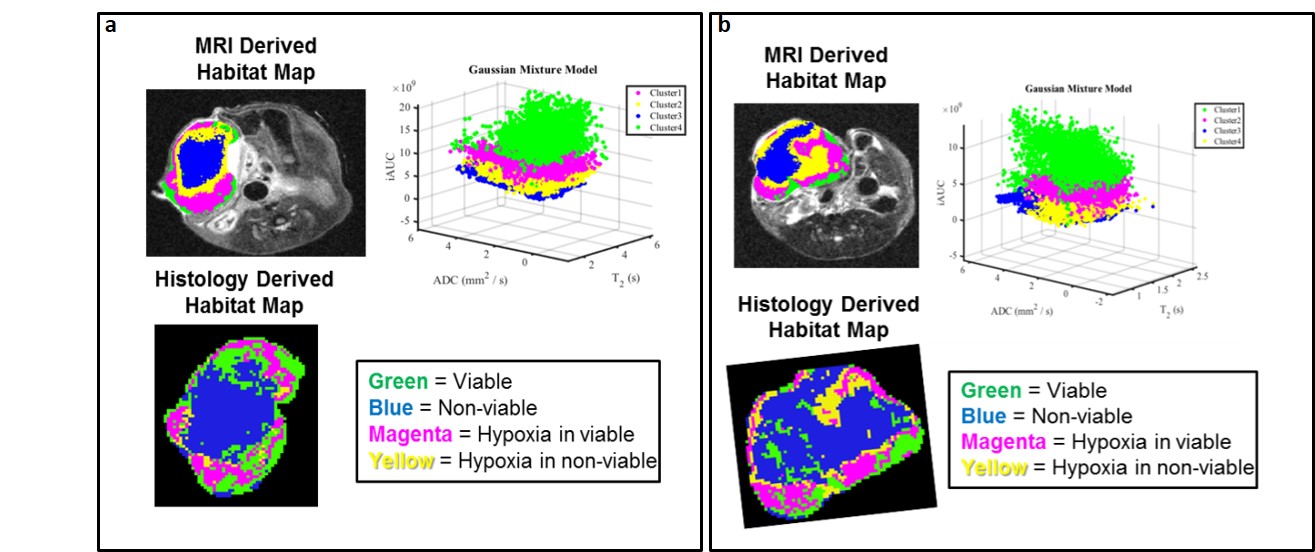
Figure 4. Correspondent slices of habitats maps from MRI
and histology showing similar spatial distribution in two examples of 4T1
breast cancer model. In MRI derived habitat Map: Cluster green
shows high enhancement in DCE and cluster blue shows low enhancement in DCE.
Cluster 2 and 3 show moderate enhancement in DCE. Histological images were
downsampled to the same resolution as MR images. Histology Derived Habitat Map
are composed of viable cell region in green especially on the edge, non-viable
cells regions (blue) in the tumor core, and hypoxic areas in viable or
non-viable regions in magenta and yellow, respectively.
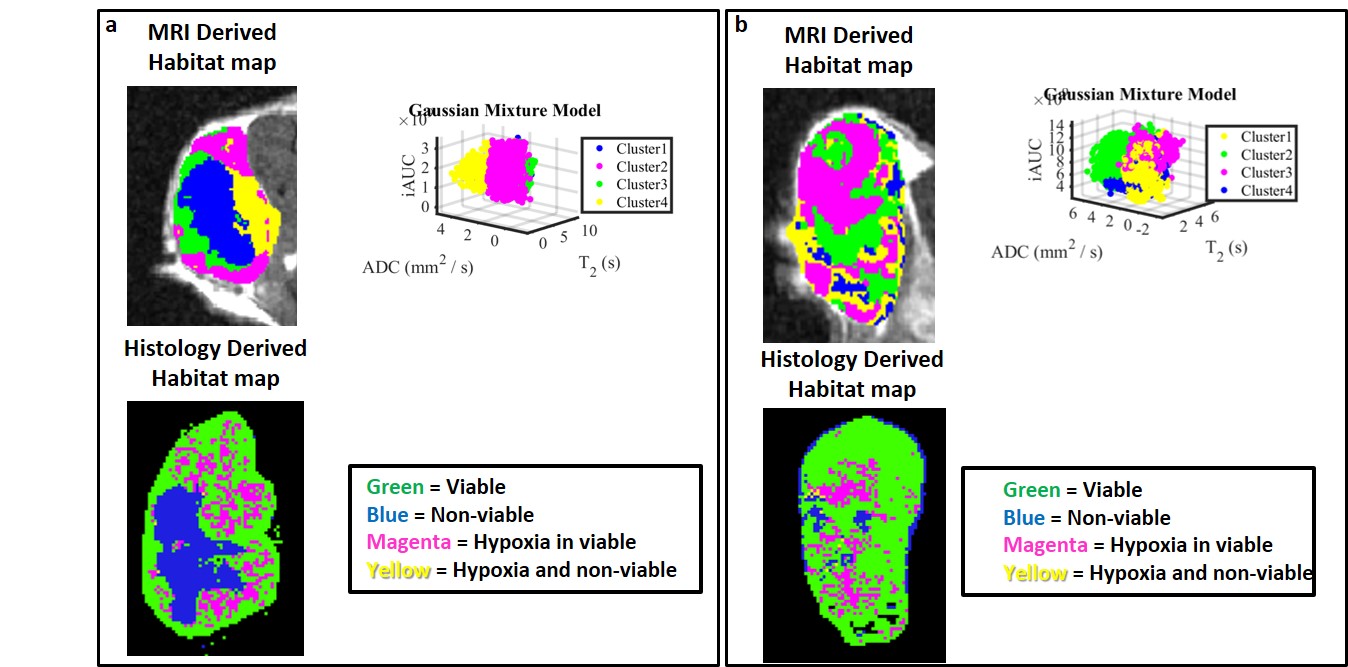
Figure 5. Correspondent slices of habitats maps from MRI
and histology in two example of sarcoma model. (a,b) Tumors habitats
defined in MRI map do not agree completely with histological defined habitats. (a) Blue habitat classified as
non-viable cells region are in agreement with MRI and histology derived
habitats map; (b) Tumor show high
spatial heterogeneity in MRI and is mostly composed by viable cells as detected
in histology.