1531
Development of a 3D radial MP2RAGE sequence for free-breathing T1 mapping of the mouse abdomen1CRMSB UMR5536, CNRS-Univ.Bordeaux, Bordeaux, France
Synopsis
T1 mapping could be useful to quantify the evolution of metastases over time and evaluate therapy efficiencies. The MP2RAGE sequence enables to obtain 3D T1 maps in reasonable scan time. Nevertheless, the standard sequence is too sensitive to respiratory motion, preventing its use at the abdominal level. Consequently, a 3D radial MP2RAGE sequence has been developed. The accuracy of the T1 measurements was evaluated in vitro and on the mouse brain. Then, abdominal 3D T1 maps were obtained without motion artifact while free breathing. Finally, the radial MP2RAGE sequence was used for the early detection and characterization of hepatic metastases.
Introduction
T1 mapping of organs affected by respiration remains challenging. However, obtaining 3D T1 maps can be useful for the early detection and characterization of pathologies. In addition, in pre-clinical research, T1 mapping may help in the development of new therapies. The MP2RAGE sequence offers a very good compromise between acquisition time and accuracy of T1 measurement. Nevertheless, it has never been used on moving areas and only once for mouse imaging. The aim of this study was to develop a MP2RAGE sequence with a radial encoding to limit the sensitivity to motion. This sequence required a adaptation of the look-up table for the reconstruction of the T1 map. The accuracy and reproducibility of the measurements were validated on phantoms and on mouse abdomens. Finally, the method was used for the detection and T1 measurement of hepatic metastases in mice.Material and methods
To obtain a 3D radial encoding scheme, a spiral distribution of projections was used, and the whole set of projection was reindexed using the golden ratio1. The lookup table that matches the MP2RAGE signal with a T1 value previously described by Marques et al.2 was modified to include the signal of all projections of a gradient echo block. The experiments were performed on a 7T Bruker BioSpec system (Germany) equipped with a whole body excitation coil and a volumetric 4-channels receiver coil (Rapid Biomed, Germany). A phantom made of five tubes containing physiological serum and Gadoteridol (ProHance®) at 50 to 220 µM was scanned seven times with a 2D inversion recovery (IR) and both cartesian and radial MP2RAGE sequences with the following parameters : TI1-TI2-MP2RAGETR = 800-2200-6250 ms (called « Short TR (STR) » parameters) or 1000-3300-8250 ms (called « Long TR (LTR) » parameters), flip angles = 7°, FOV = (25 mm)3, Matrix = (128)3, Resolution = (195 µm)3. Three C57/Bl6 mice (8 weeks old, Charles River, France) were scanned three times on the brain and abdomen with both the cartesian and radial MP2RAGE sequences with the same parameters as for the in vitro experiments. Four hepatic metastasis-bearing mice (through a mesenteric injection of 2x10⁵ murine melanoma (B16F10) cells) were regularly scanned to follow the metastasis development. Experimental procedures were approved by the Animal Care and Use Institutional ethics committee of Bordeaux, France (approval n°5012032-A).
Results
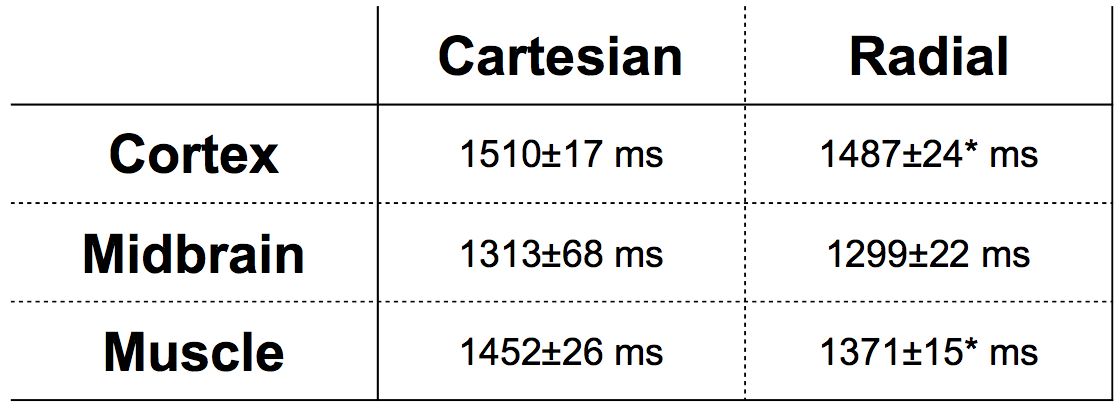
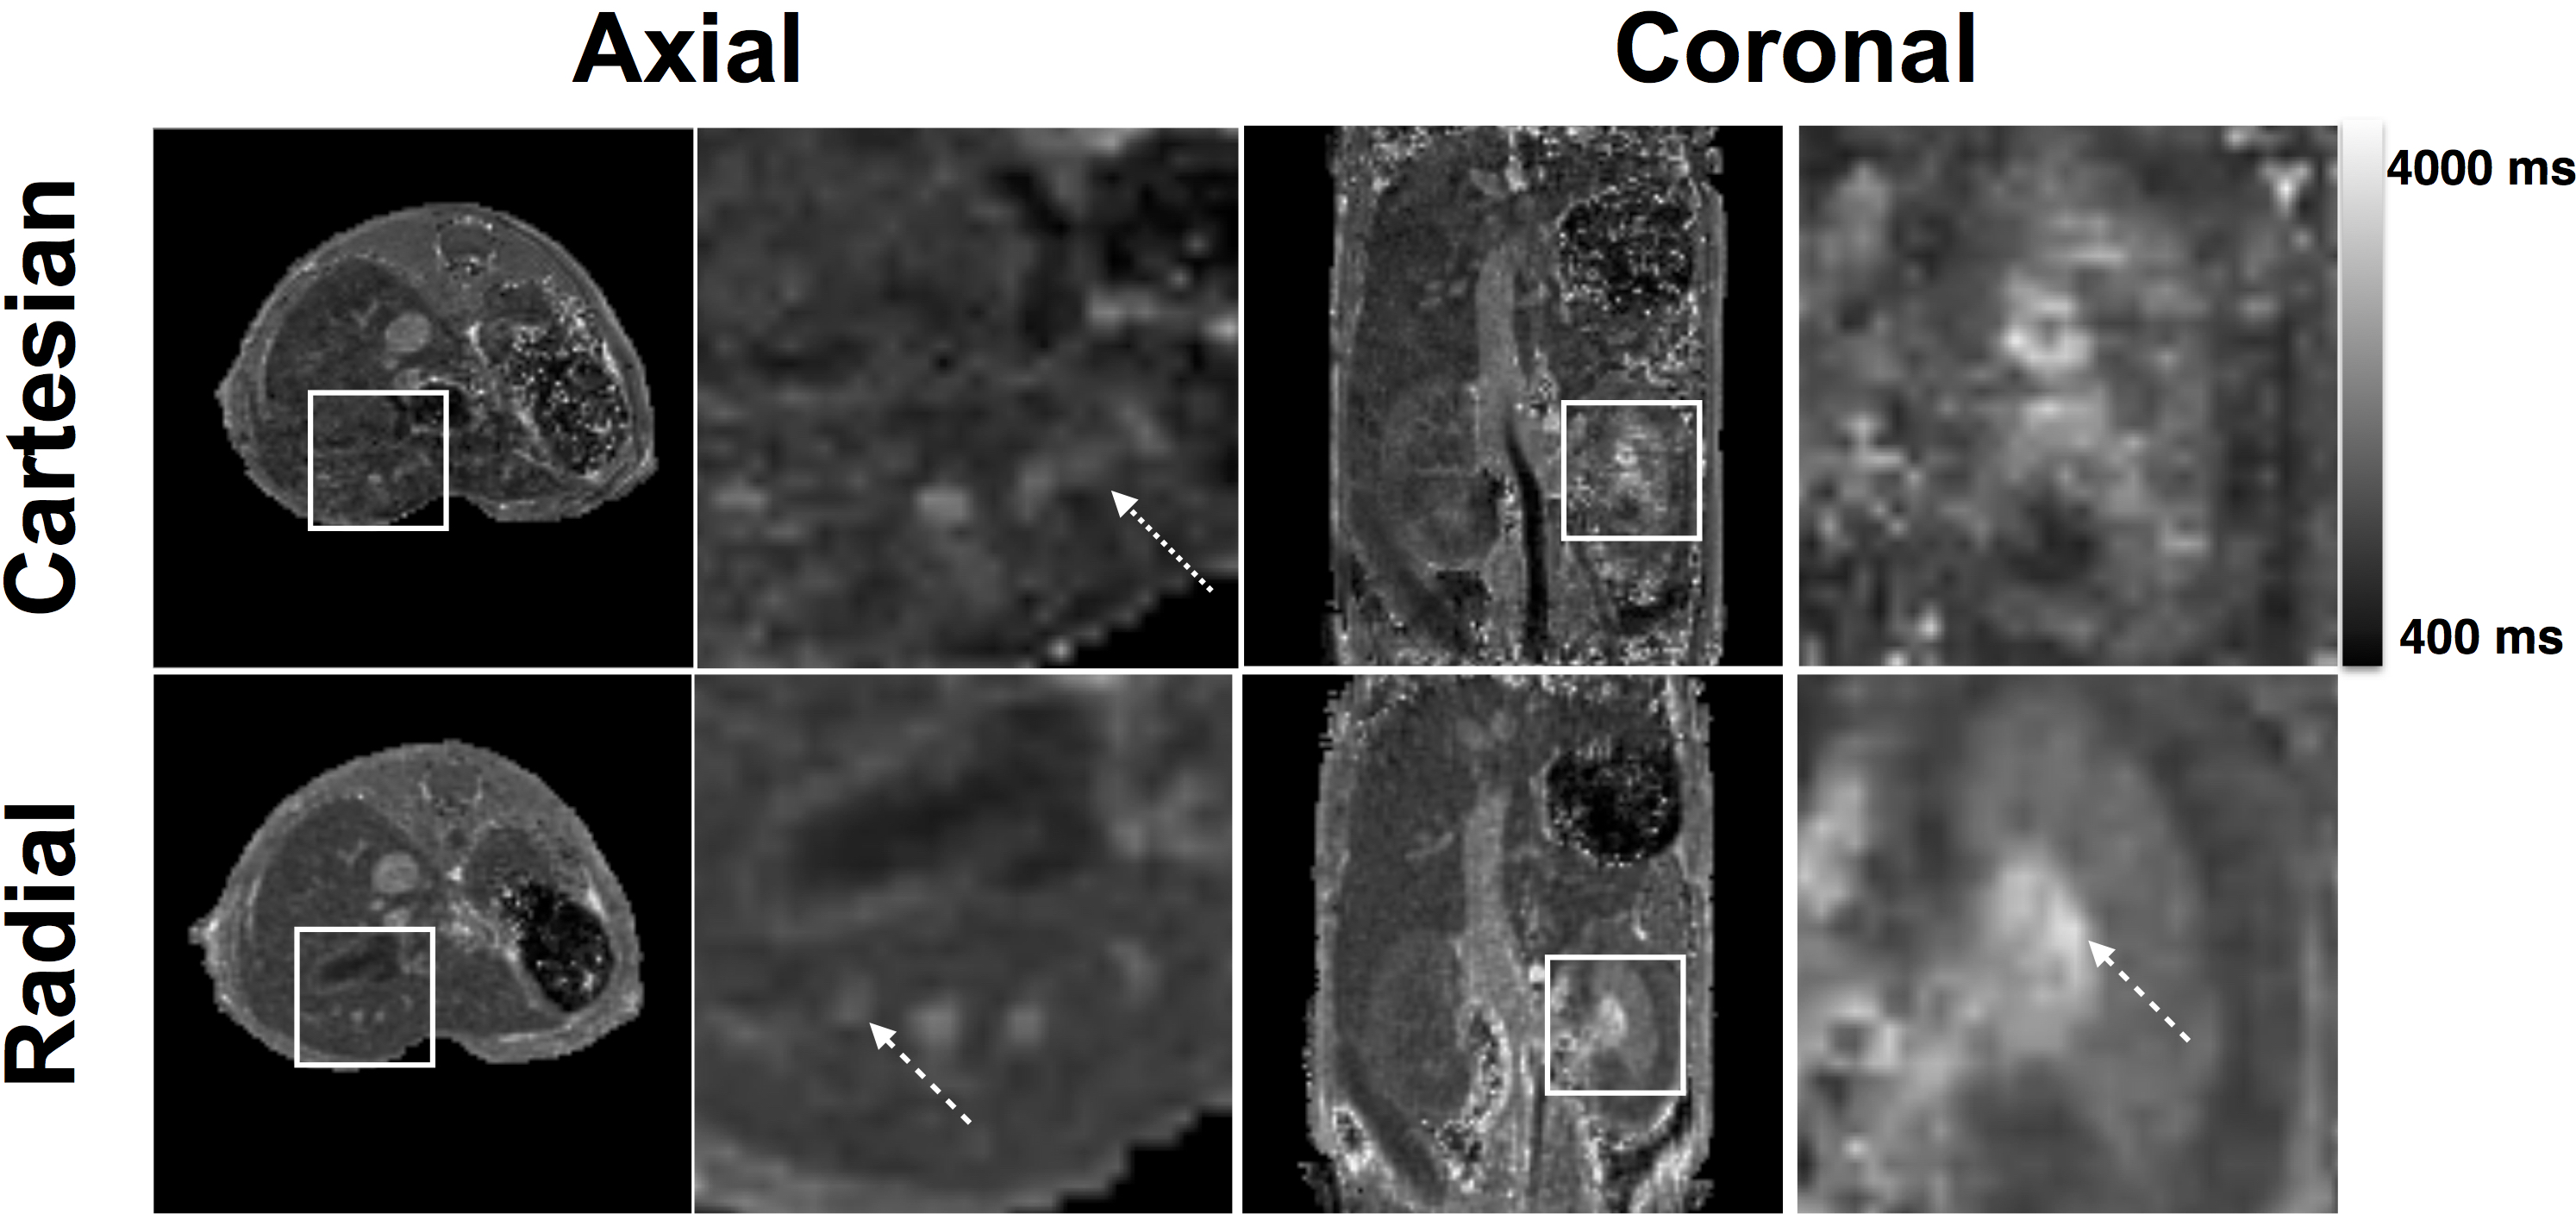
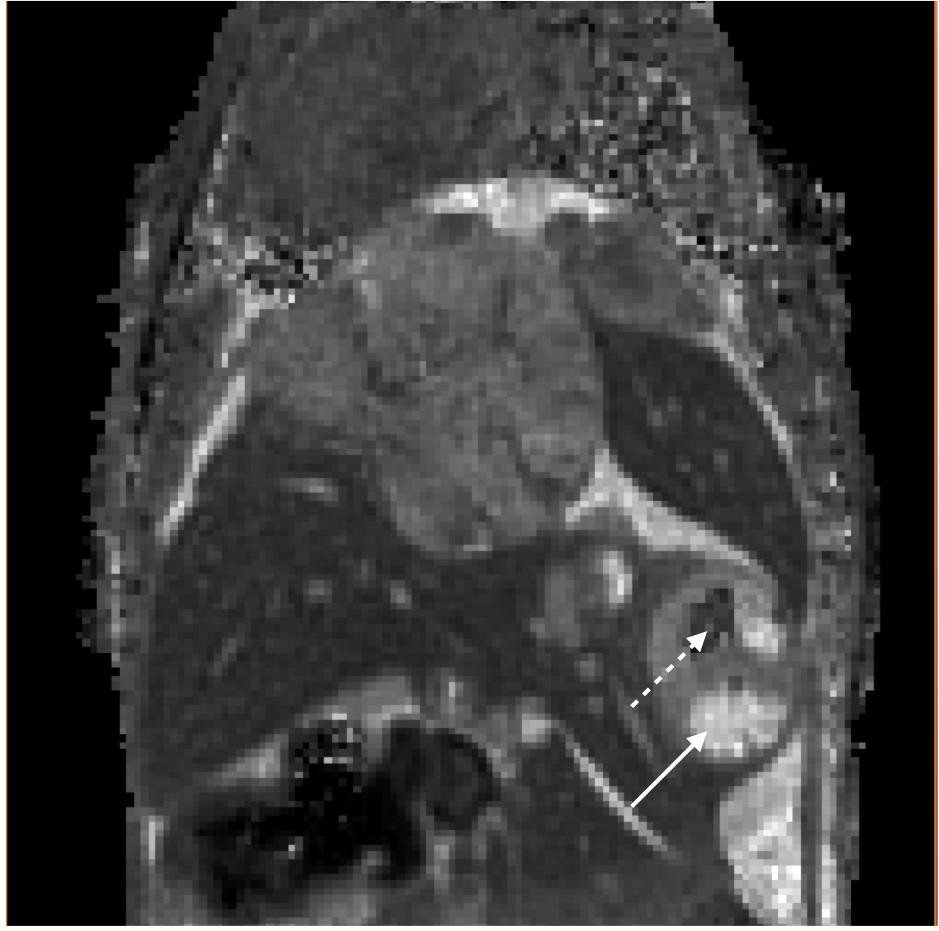
The best accuracy was obtained with the radial LTR, with a mean deviation from the IR measurements of -4±10 ms for the whole range of T1 values measured on the phantom. Using these parameters, structures of the mouse brain were clearly delineated and appeared with similar contrasts on both the radial LTR and the cartesian MP2RAGE images. T1 values of muscles, brain cortex, midbrain were measured with small standard deviations (Table). Similarly as the in vitro T1 measurements, the T1 measured in vivo from the cartesian sequence were 6% longer than those from the radial LTR sequence. T1 mapping on the mouse abdomen while free breathing showed similar contrasts on both the cartesian and the radial LTR MP2RAGE images. Nevertheless, the radial T1 maps were of greater quality compared to the cartesian one, due to a large reduction of respiratory motion artifacts. This enabled to detect small hepatic blood vessels without synchronizing the acquisition with the respiration (Figure 1). T1 values for the liver and kidney {cortex, outer medulla and inner medulla} were measured with the radial LTR sequence: 1133±34ms, {1309±57 ms, 1740±62 ms and 2677±162 ms}, respectively. Due to the 3D highly-resolved T1 maps, hepatic metastases as small as 0.1 mm3 were detected. Their T1 (ranging mainly between 1600 and 2000 ms) was significantly different from the healthy liver. Within a metastasis, areas with T1 lower than 1100 ms or longer than 3000ms were also found, demonstrating a heterogeneous composition (Figure 2).Discussion
The radial encoding scheme of the MP2RAGE sequence did not alter the T1 measurements compared to the cartesian sequence. In addition, it largely decreased the sensitivity to respiratory motion artifacts, enabling to obtain free-breathing mouse abdominal T1 maps. Due to the 3D high spatial resolution, hepatic metastases were detected at an early stage and longitudinally characterized. Intra-metastasis heterogeneities could be estimated due to their differences in T1.Conclusion
The 3D radial MP2RAGE sequence developed here is of great interest for fast T1 mapping of areas affected by respiration motion. Future work will focus on accelerating the acquisition using Compressed Sensing or Parallel Imaging.Acknowledgements
This work was supported by a public grant, Translational Research and Advanced Imaging Laboratory, which is part of the French National Research Agency's Investments for the Future Program (“WhoboMP2RAGE”; ANR- 10-LABX-57).References
1. Koktzoglou, I. (2013). 4D dark blood arterial wall magnetic resonance imaging: Methodology and demonstration in the carotid arteries. Magnetic Resonance in Medicine, 69(4), 956–965. https://doi.org/10.1002/mrm.24647
2. Marques, J. P., Kober, T., Krueger, G., & Zwaag, W. Van Der. (2010). NeuroImage MP2RAGE , a self bias- fi eld corrected sequence for improved segmentation and T 1 -mapping at high fi eld. NeuroImage, 49(2), 1271–1281. https://doi.org/10.1016/j.neuroimage.2009.10.002
Figures