1530
Lentiviral shRNA-mediated targeting of GDPD5 and GDPD6 in Orthotopic Human Breast Cancer Xenograft Models: A Metabolomics Study1The Russell H. Morgan Department of Radiology and Radiological Science, Johns Hopkins University School of Medicine, Baltimore, MD, United States, 2San Juan Bautista School of Medicine, Caguas, PR, United States, 3The Sidney Kimmel Comprehensive Cancer Center, The Johns Hopkins University School of Medicine, Baltimore, MD, United States
Synopsis
Activated choline phospholipid metabolism is a hallmark of cancer. Aggressive breast cancers are characterized by high tumoral phosphocholine and glycerophosphocholine. In our ongoing efforts of evaluating the glycerophosphodiesterases GDPD5 and GDPD6 as cancer treatment targets, we have systemically injected mice growing orthotopic triple-negative MDA-MB-231 breast tumors with lentiviral vectors that silence the GDPD5 or GDPD6 genes as compared to mice injected with control viruses. We have analyzed extracted tumor tissue by means of high-resolution 1H MRS-based metabolomics. Differences in tumor growth and metabolic profiles were observed following silencing of GDPD5 and GDPD6 genes when compared to control mice.
Introduction:
Breast cancer is the second most common cancer and cause of death in women in the United States[1]. Previous studies have shown that glycerophosphocholine(GPC), although elevated as compared to normal tissue, is lower than phosphocholine(PC) in aggressive breast cancer[2]. Two enzymes that are responsible for cancer-related alteration in GPC have been identified:the glycerophosphocholine-phosphodiesterases GDPD5[3-5]and GDPD6[6-8]. They cleave GPC to glycerol-3-phosphate and free-choline, and are overexpressed in breast cancer. Transient GDPD5 and GDPD6 silencing with siRNA treatment[9] resulted in reduced migration,invasion,and proliferation of breast cancer cells[8]. In-vitro GDPD5 and GDPD6 silencing studies on different breast cancer cell-lines showed significant increase in GPC level. Based on these results,we have continued our studies in-vivo to evaluate if shRNA-expressing-lentiviral vector based silencing of GDPD5 and GDPD6 will reduce tumor growth in orthotopic MDA-MB-231 breast-cancer xenograft model. We have studied the effects of silencing these genes at metabolic level in our continuing efforts of identifying potential biomarkers as well as therapeutic targets for anti-cancer therapy.Methods:
Lentiviral-vectors based on pRRL-green fluorescent protein(GFP) containing shRNA against GDPD5(GDPD5-shRNA) or shRNA against GDPD6(GDPD6-shRNA) were constructed to constitutively knockdown these two genes[9]. A vector with shRNA against luciferase(luc-shRNA) was also constructed and used as control vector. The triple-negative, aggressive human breast cancer cell-line MDA-MB-231 cell(ATCC, Rockville, MD USA) were harvested at 80%confluence and ~2X10⁶ cells were inoculated in right mammary pad of 6-8 weeks old female athymic nude mice. Tumor volume was measured biweekly and once tumor sizes reached 150mm3, 200μL of concentrated viral suspension (titer 6.2 X 10¹¹/mL) were injected through tail-vein biweekly up-to 30 days. Once the mice were sacrificed, tumors were harvested, freeze-clamped and stored at -80ºC until 1H MR analysis. Dual phase solvent extraction was performed on tumor tissues. Both water and lipid phases were separated,water phase was freeze-dried, reconstituted in D2O and transferred to 5-mm NMR tube for spectral acquisition. All 1H MR spectra were acquired on Avance-III 750MHz Bruker spectrometer equipped with 5-mm TXI probe. Spectral processing and quantification were performed using TOPSPIN ans AMIXResults and Discussion:
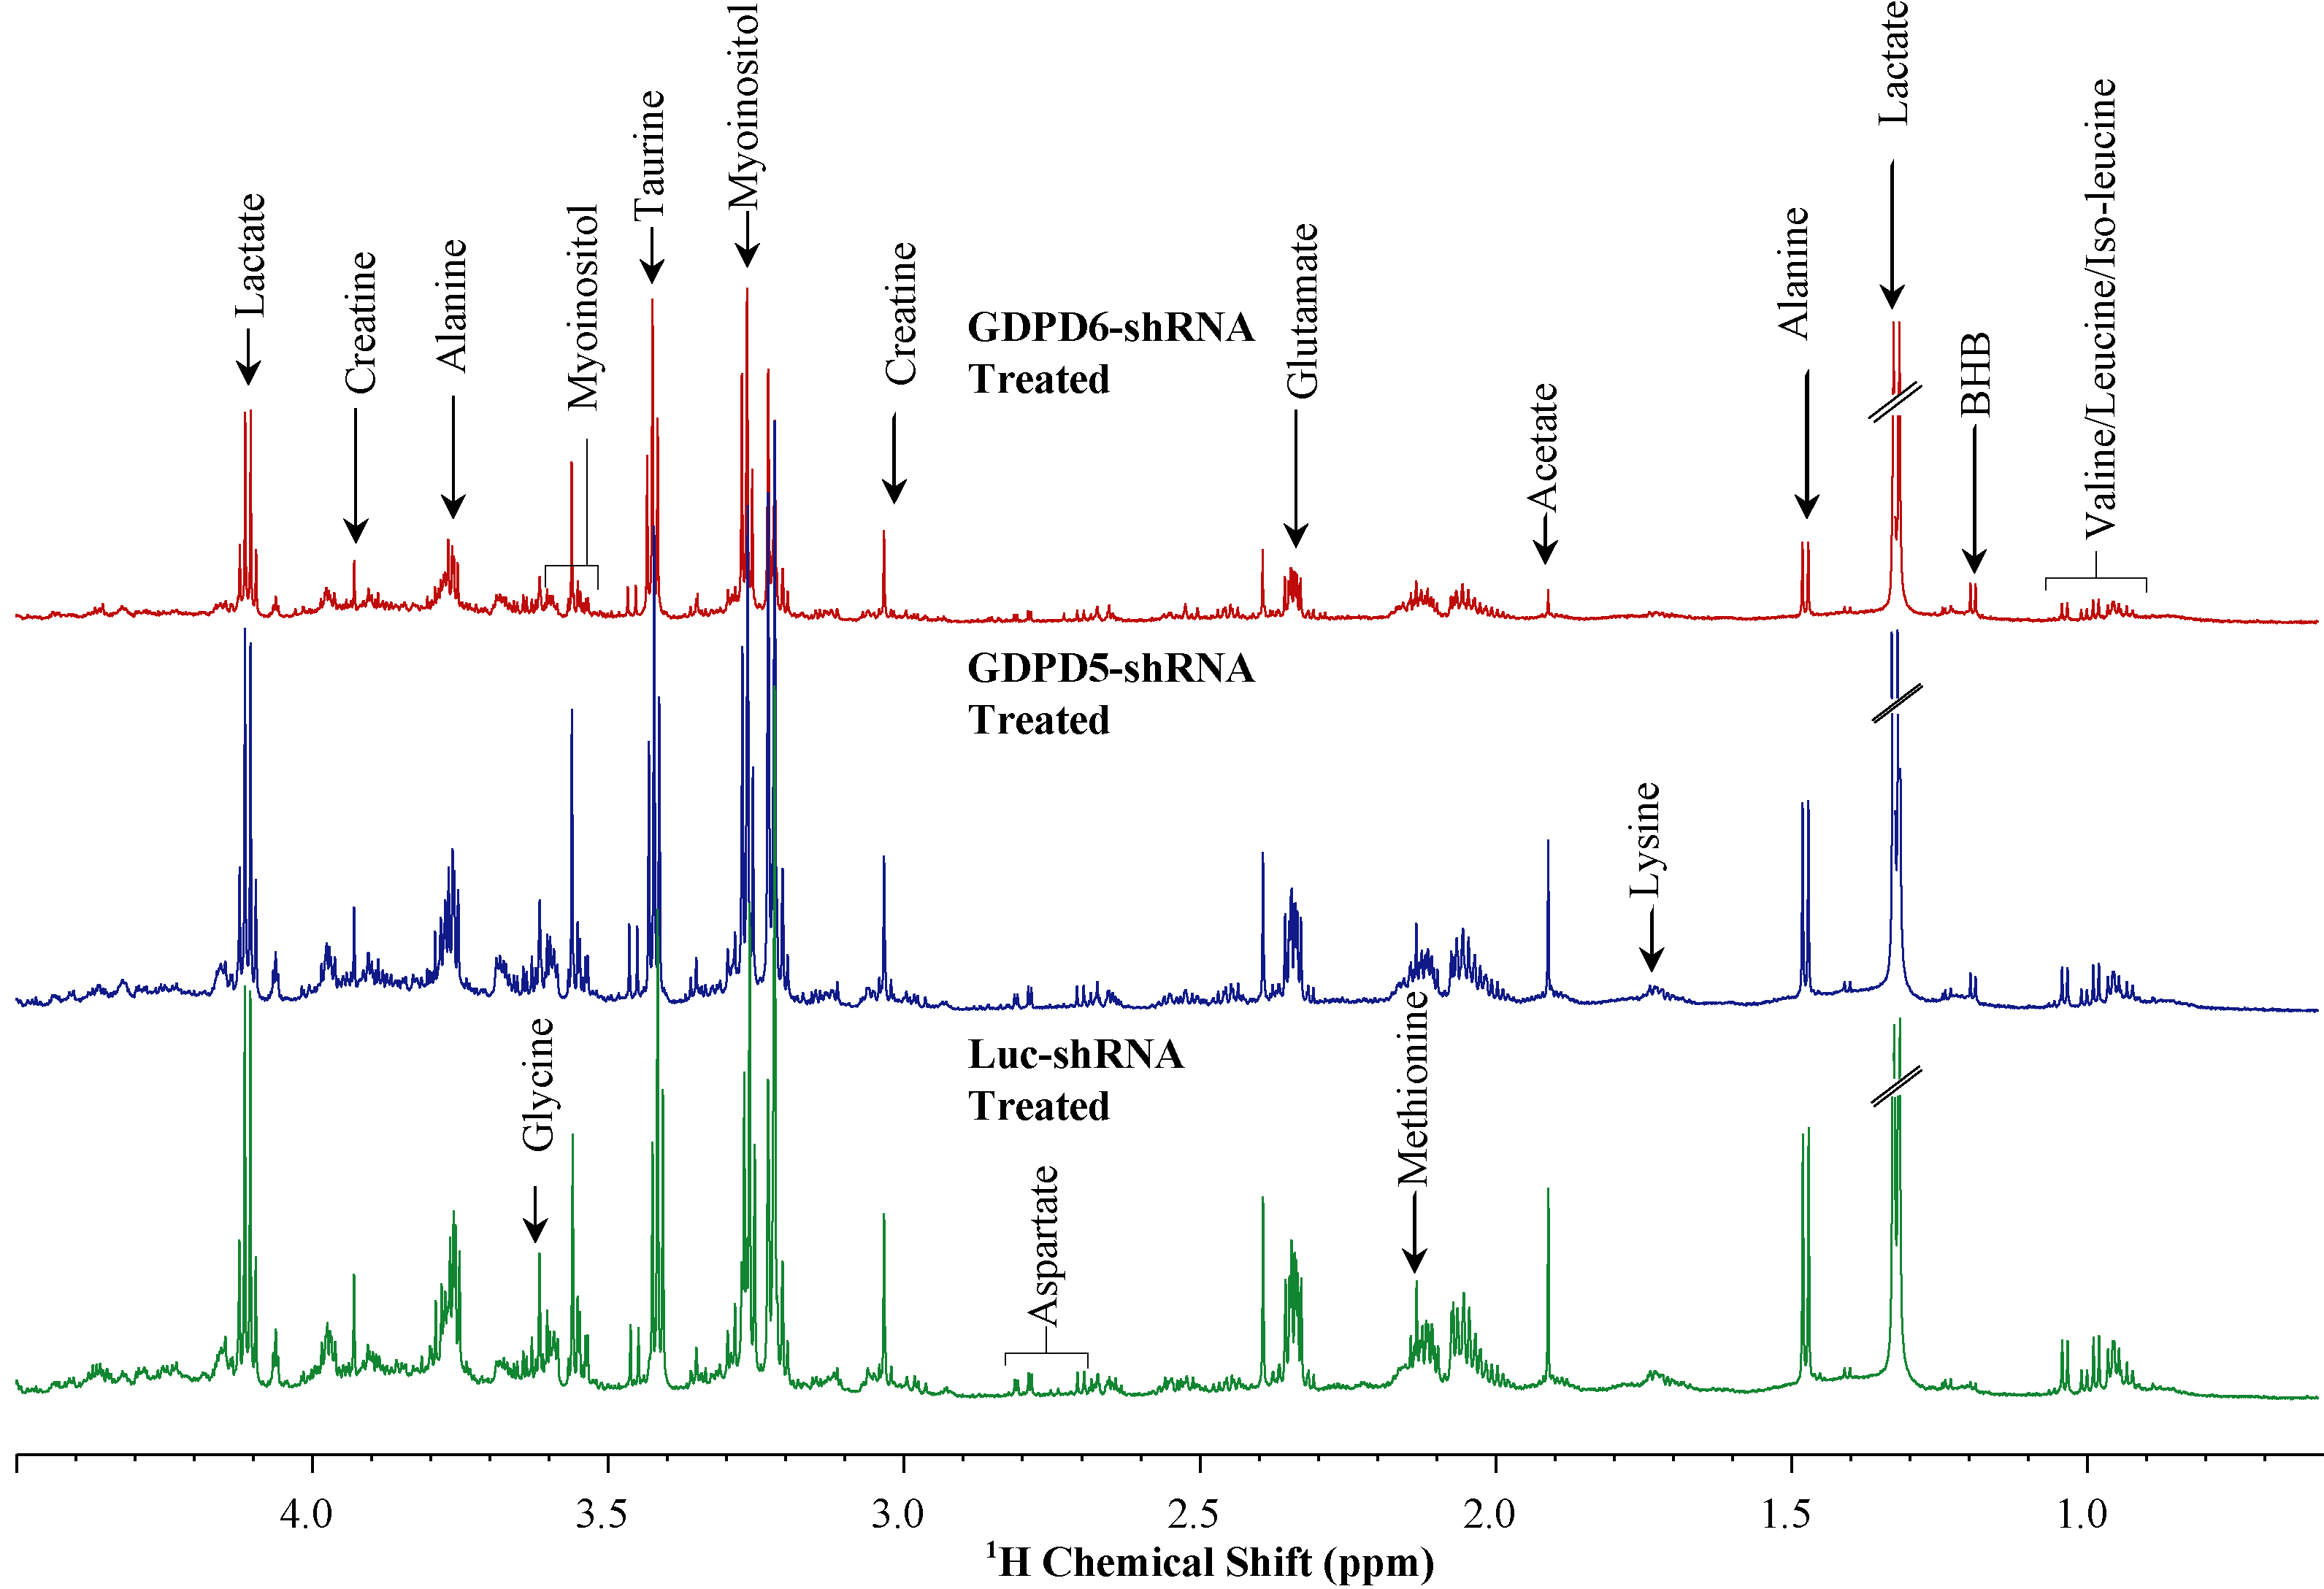
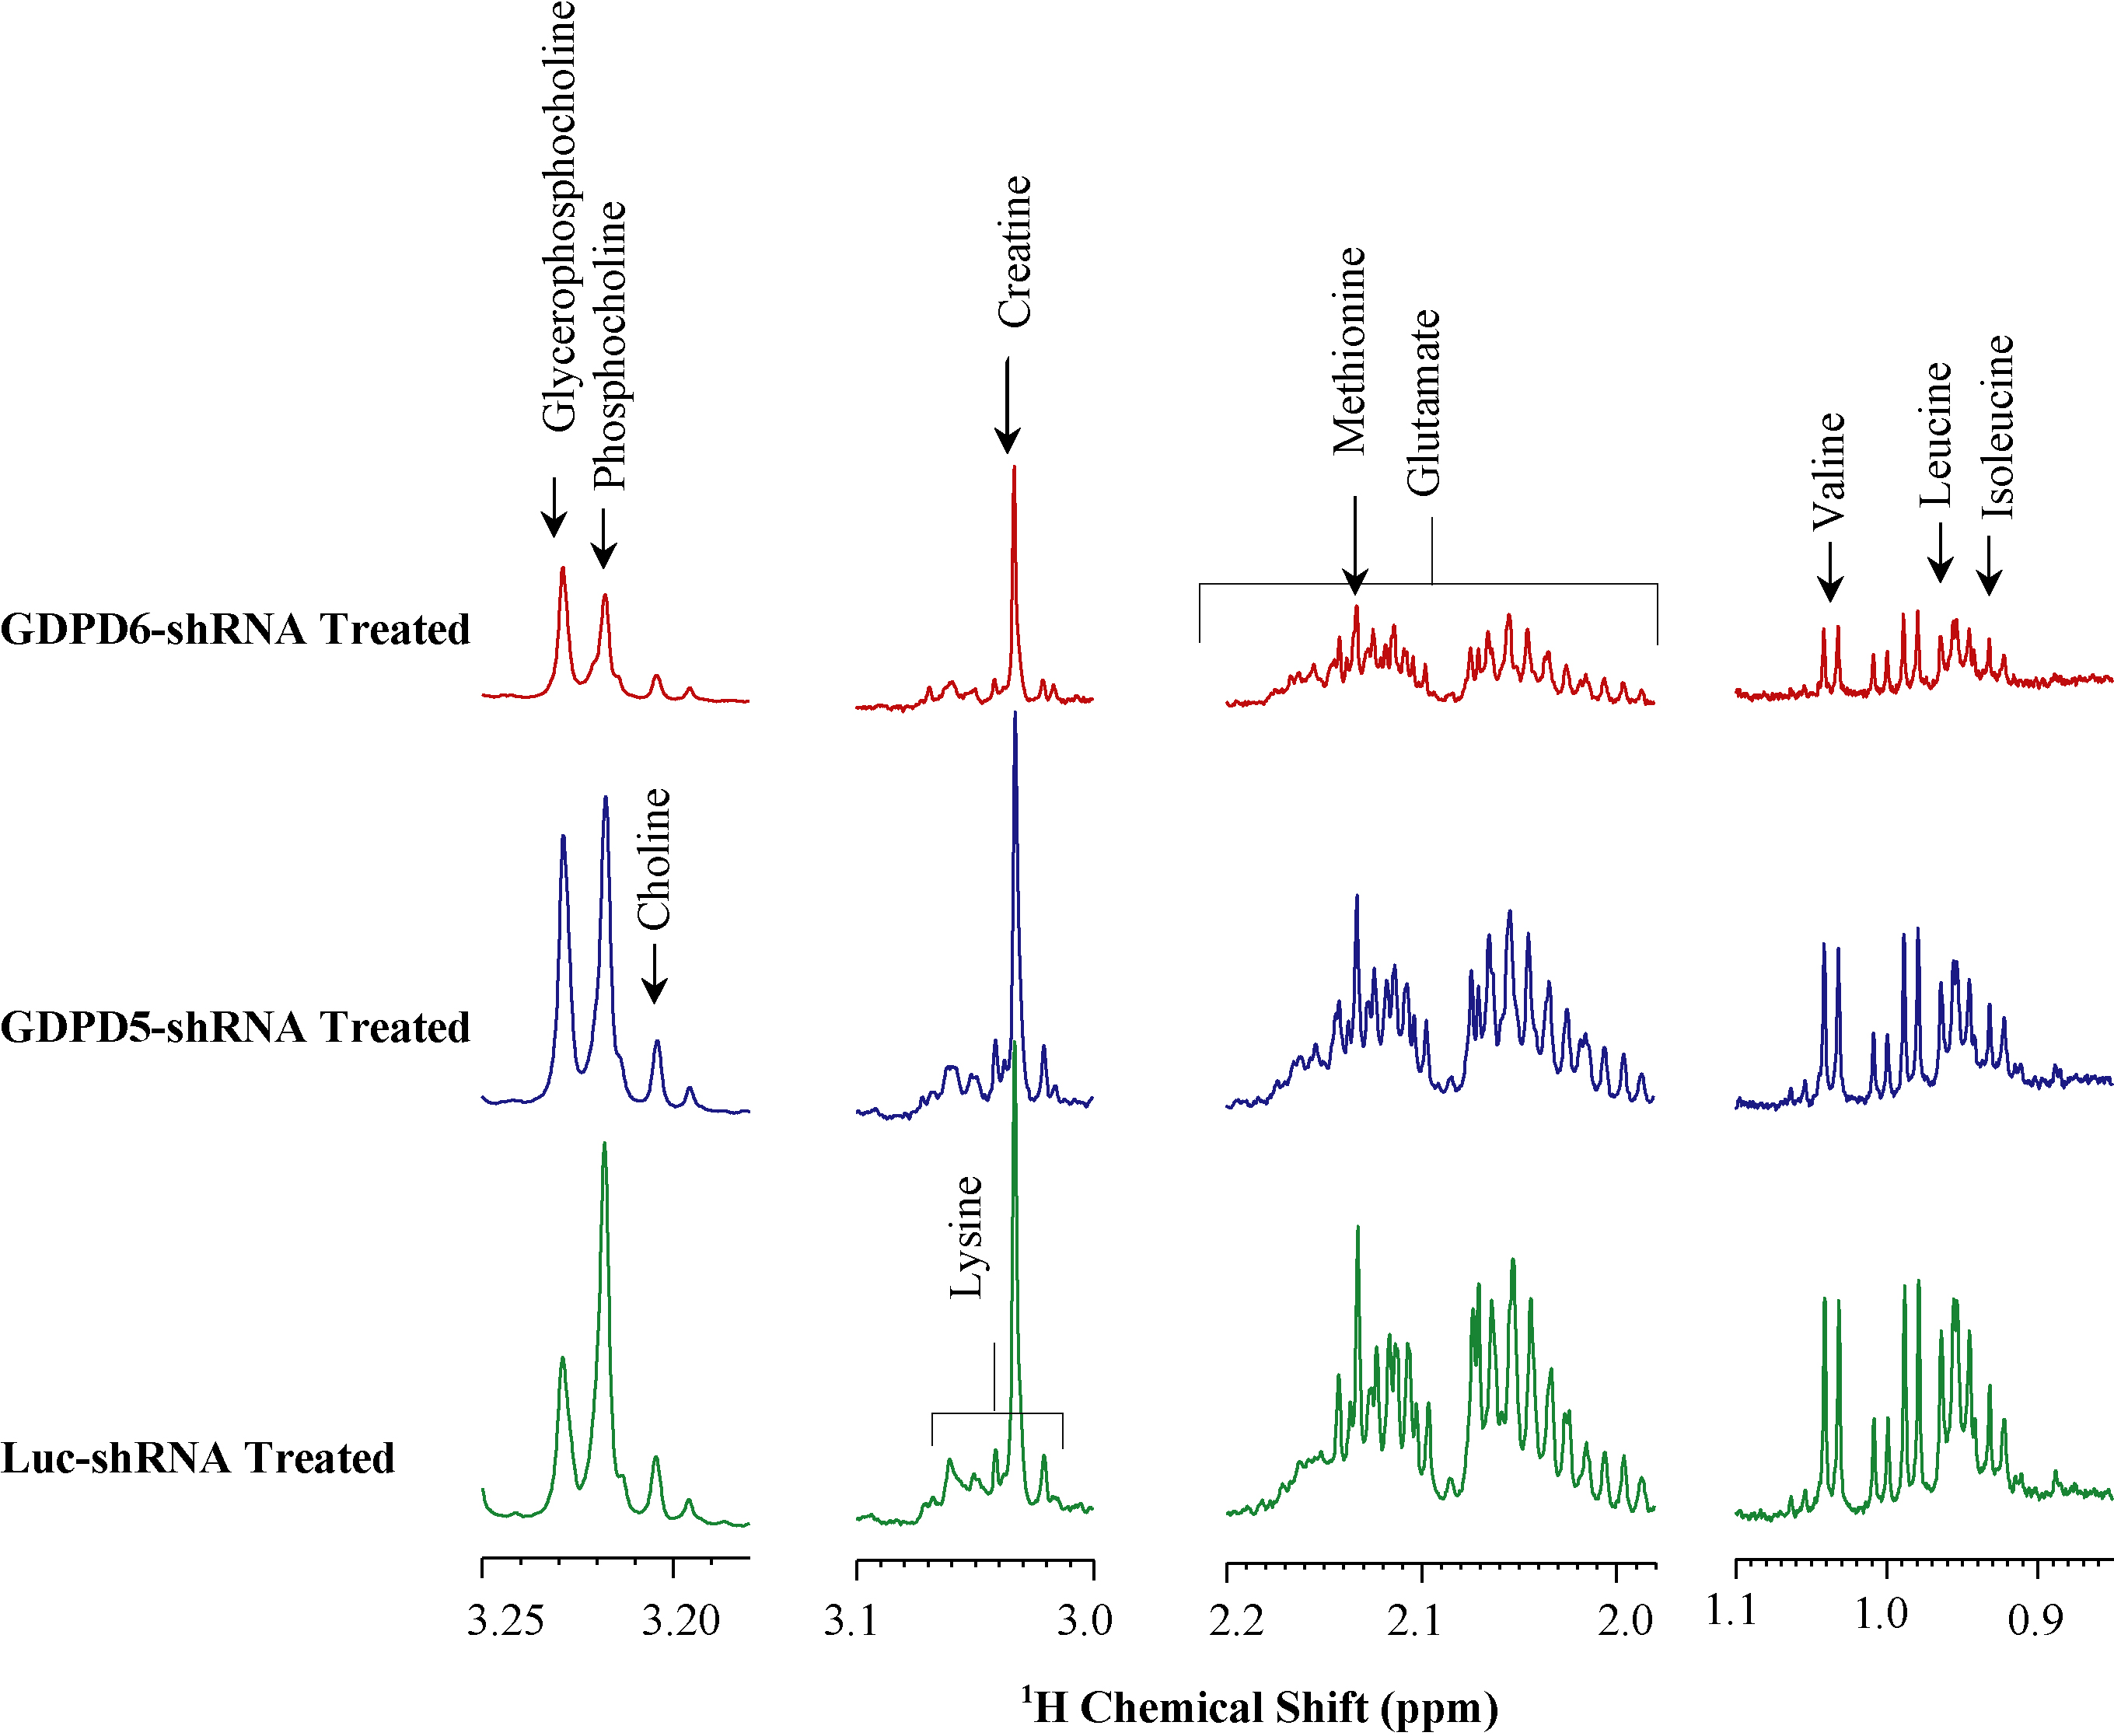
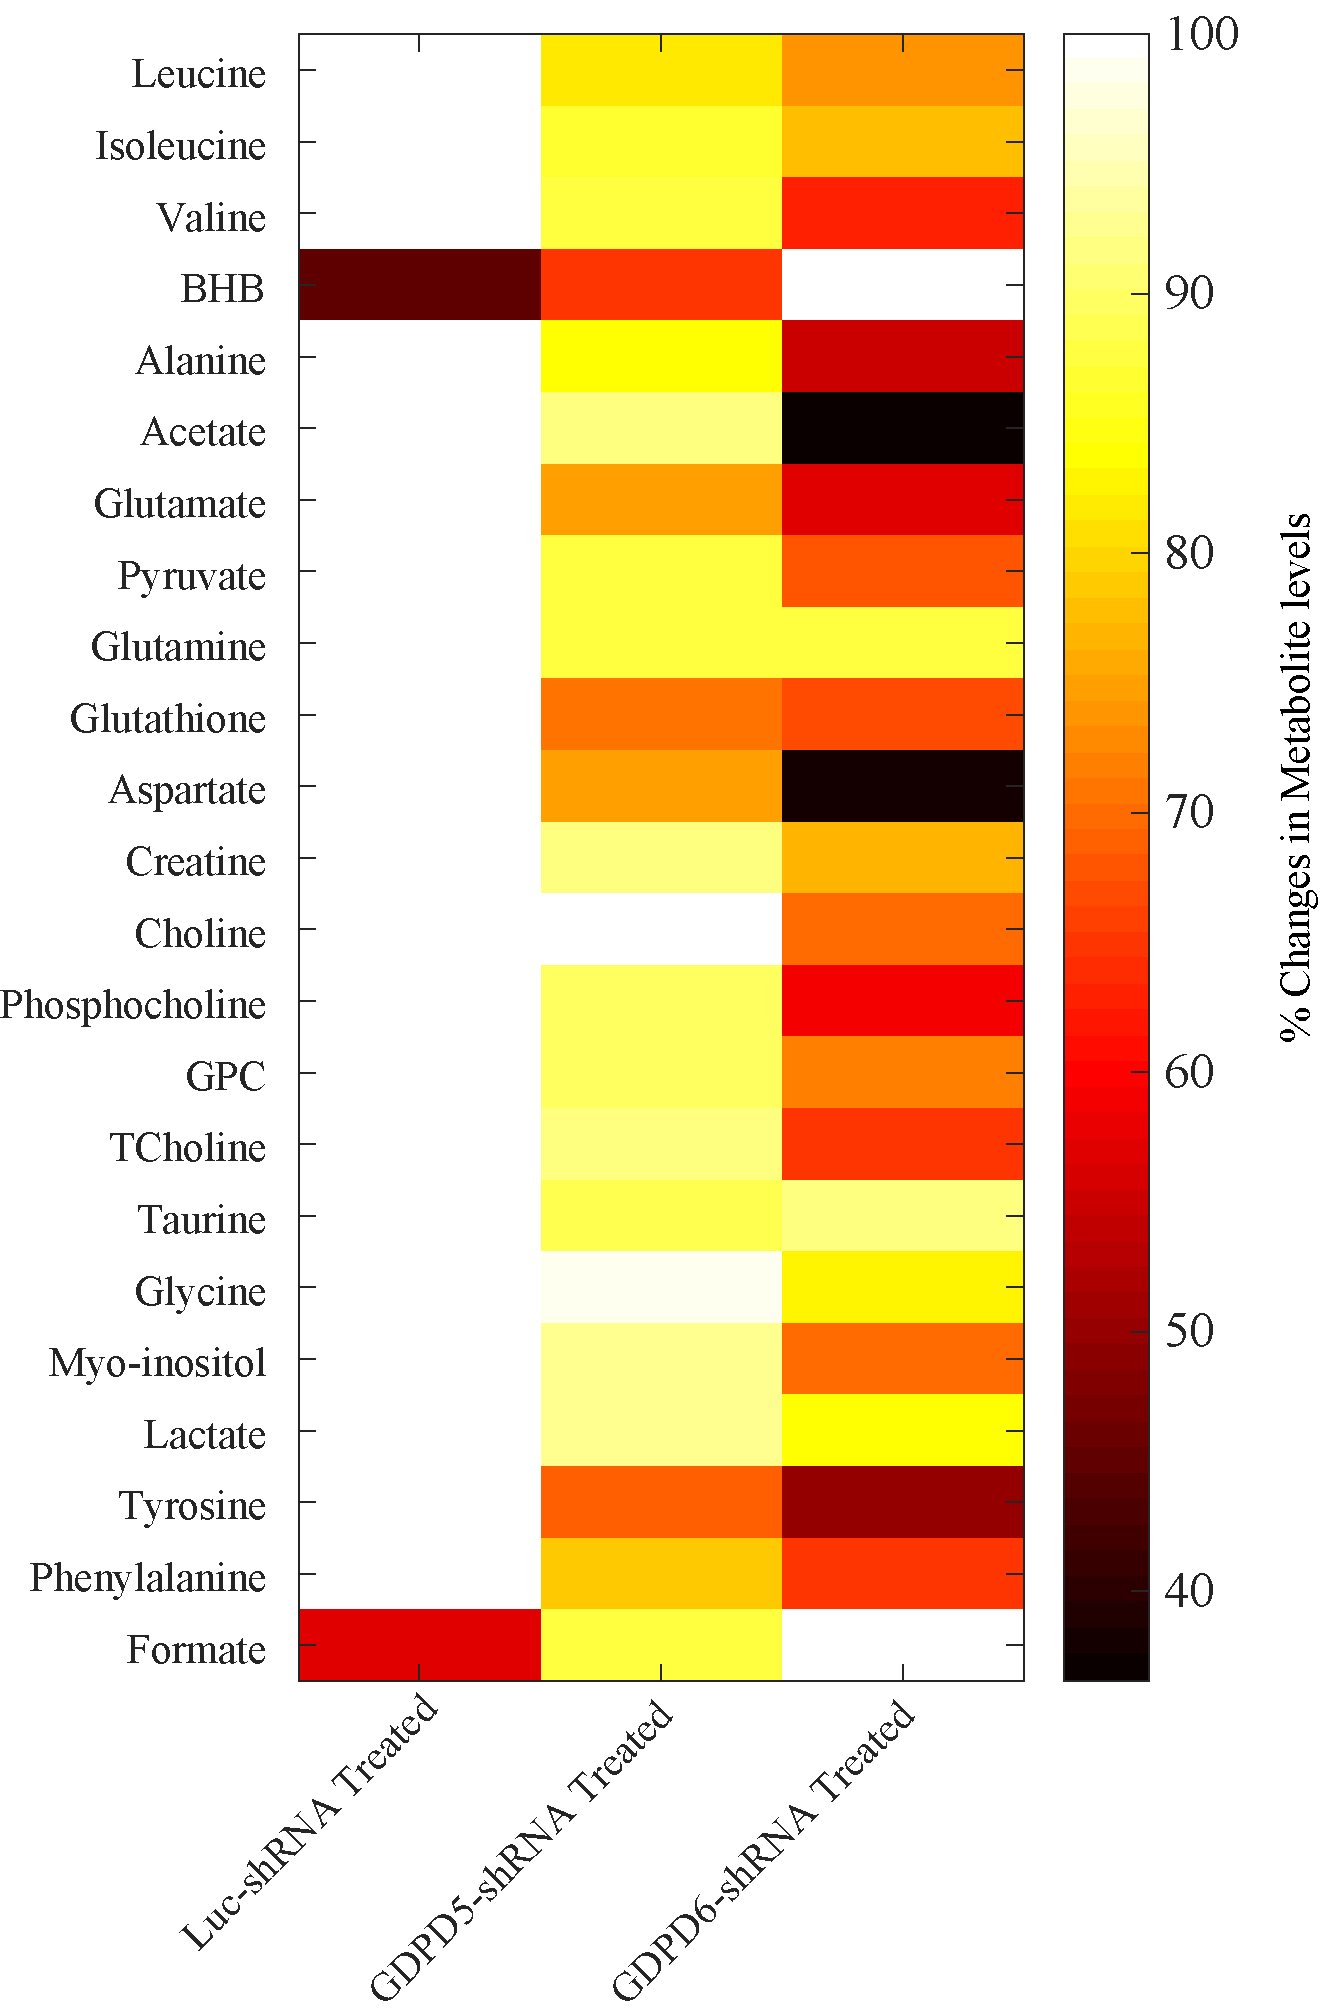
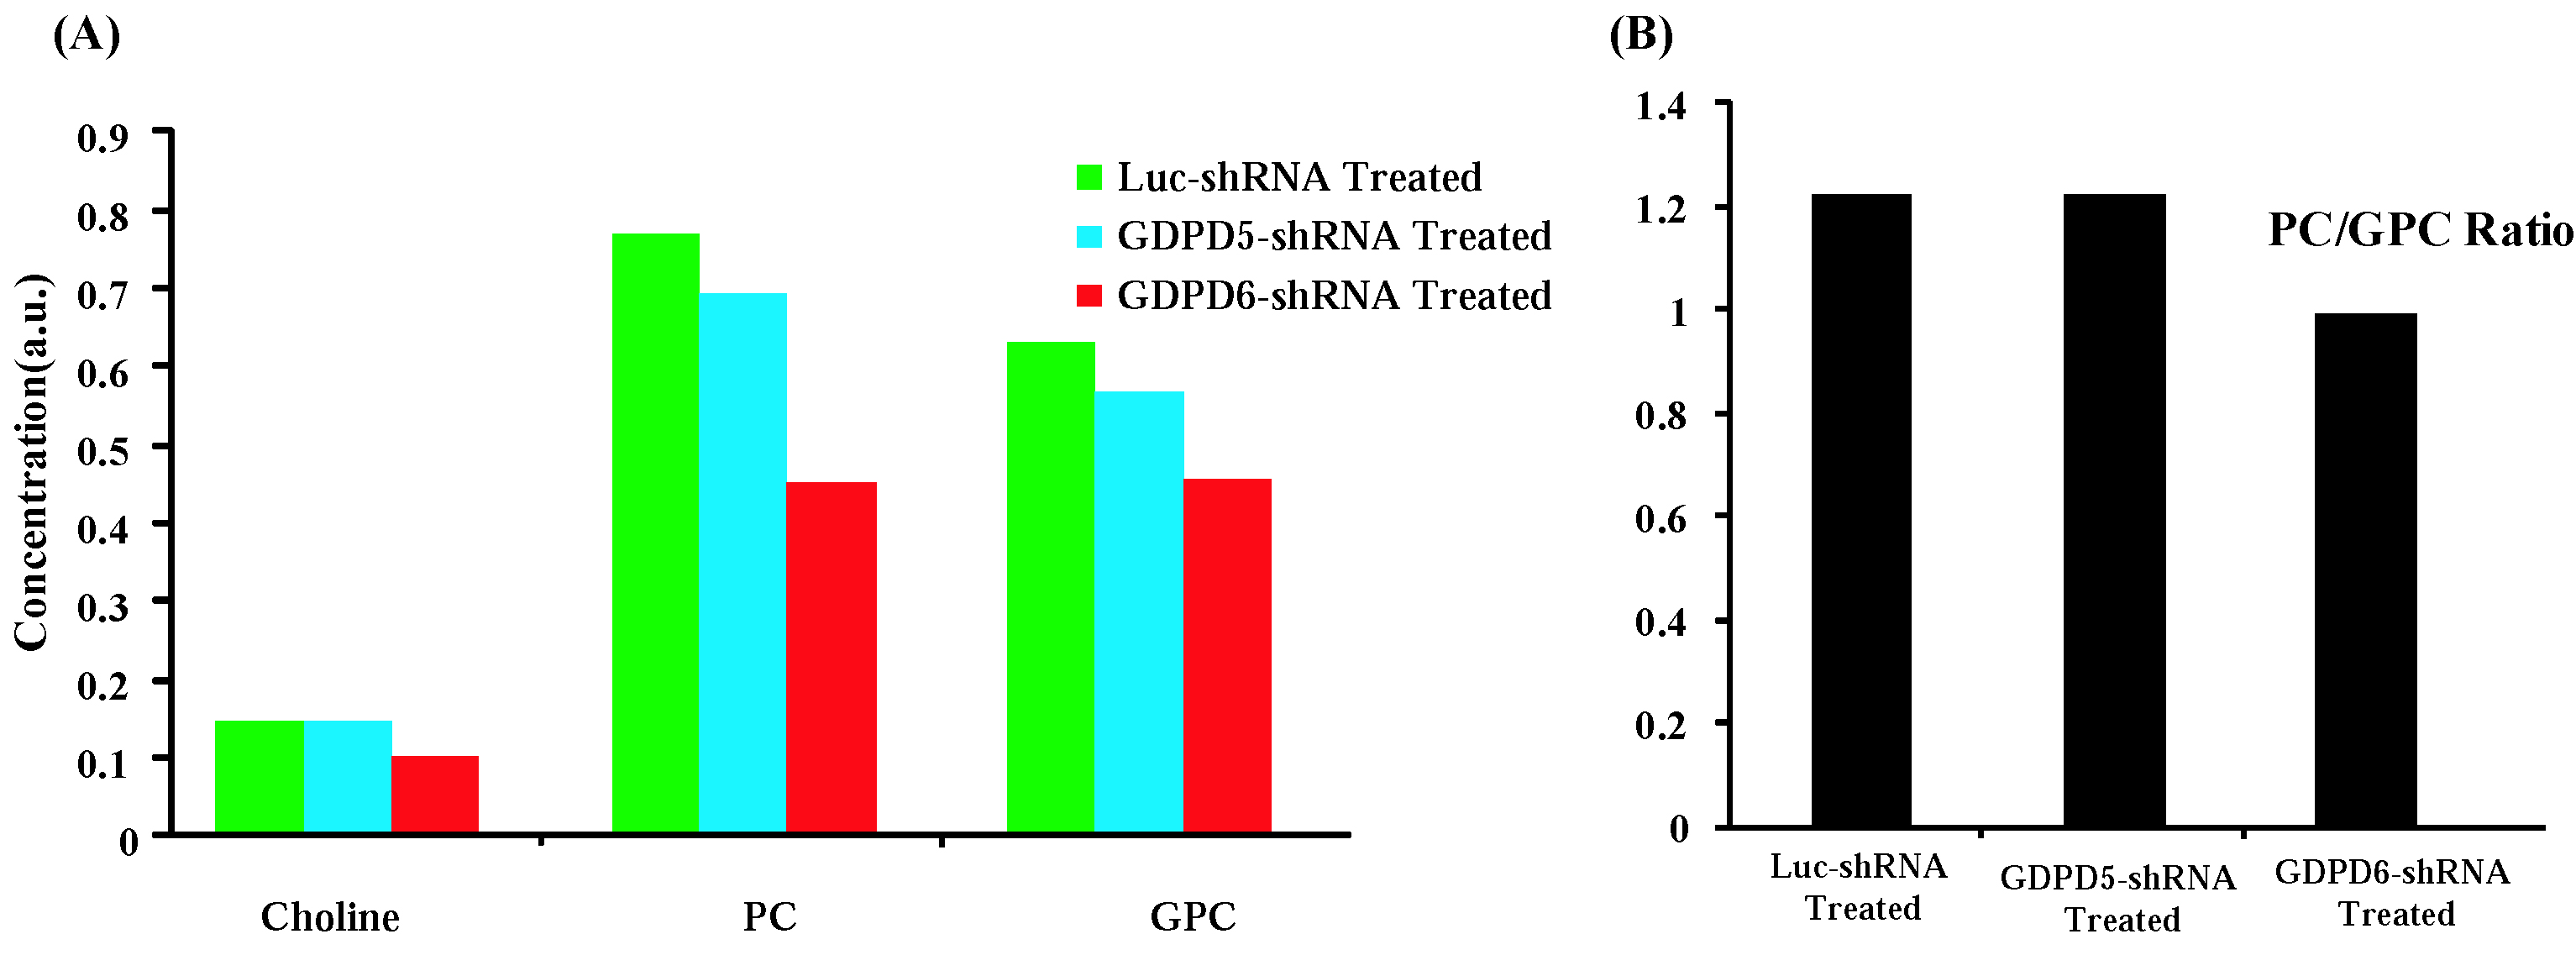
Prior to lentiviral shRNA treatment, tumor volumes were measured biweekly,they displayed gradual increase in size(140mm3–300mm3). Data characterizing tumor growth for three groups,prior and during treatment are shown(Figure-1A). Tumor growth in GDPD6-shRNA group was significantly reduced compared with luc-shRNA and GDPD5-shRNA tumors. In GDPD5-shRNA group, an initial decrease in tumor size was observed(Day4-Day15 post-treatment), followed by significant increase in tumor size, which is indicative of initial response to therapy with subsequently developed treatment-resistance. There was no evidence of weight-loss or physical-distress resulting from the treatment protocol, showing that lentiviral suspension treatment is probably non-toxic. Representative bright-field and fluorescence photomicrographs showing GFP distribution in 2-mm-thick sections of luc-shRNA, GDPD5-shRNA and shGDPD6-shRNA transduced tumor tissue are shown in Figure-1B. 1H MR spectra of water phase of tumor extracts for three treated groups demonstrated differences in various metabolites(Figures-2,3). A heatmap of relevant metabolites was generated based on percent(%)changes among the three groups (Figure-4). Lactate levels were decreased in GDPD5-shRNA and GDPD6-shRNA treated groups as compared to the luc-shRNA treated control group, in which glucose was absent altogher. An increased lactate level indicates an activated glycolysis, which is typically observed in tumors due to the Warburg effect. An increased pyruvate level in the luc-shRNA treated group may be caused by mitochondrial dysfunction, which is a common feature of carcinogenic cells. Levels of branched chain amino acids (valine, leucine, isoleucine), lysine and alanine were also decreased in the GDPD5-shRNA and GDPD6-shRNA treated groups compared to the luc-shRNA treated control group, which may be related to altered protein synthetic pathways and decreased gluconeogenesis. These findings are consistent with previous reports on amino acid metabolism in various cancers[10-12]. Lower levels of the above-mentioned metabolites in the GDPD5-shRNA and GDPD6-shRNA treated groups indicate an overall positive effect of silencing these genes(Figure 4). Levels of choline, GPC, and PC also varied among the groups, resulting from alterations in choline phospholipid metabolism. Choline was increased in luc-shRNA and GDPD5-shRNA groups. Although PC and GPC showed a decreasing trend from luc-shRNA to GDPD5-shRNA to GDPD6-shRNA treated groups(Figure-5A), level of GPC was slightly higher in the GDPD6-shRNA treated group. The PC/GPC ratio was elevated in the groups treated with luc-shRNA and GDPD5-shRNA, whereas it was lower in the GDPD6-shRNA treated group(Figure-5B). This result was consistent with our previous findings[5] and showed the expected outcome of GPC increase following GDPD6 silencing.Conclusion:
These data suggest that GDPD5 and GDPD6 silencing in breast cancer tumor xenografts could be an effective molecular treatment strategy. Additional studies are continuing in our lab to corroborate these initial findings. Most of the detected metabolites showed varying degrees of occurrence and response to the GDPD5-shRNA and GDPD6-shRNA treatment.Acknowledgements
This work was supported by NIH R01 CA213428. We thank all members of the Division of Cancer Imaging Research in The Russell H. Morgan Department of Radiology and Radiological Science for their help and support.References
1. ACS. Cancer Facts and Figures 2016. American Cancer Society 2016.
2. Glunde K., et al, Nat Rev Cancer 2011;11:835-48.
3. Cao M.D., et al, NMR Biomed 2012;25:1033-42.
4. Stewart J.D., et al, Proc Natl Acad Sci USA, 2012. 109(21): 8155-60.
5. Wijnen J.P., et al, NMR Biomed 2014;27:692-9.
6. Cao M.D., et al, NMR Biomed 2016; 29:1098-1172
7. Stewart J.D., et al, Proc Natl Acad Sci U S A 2012;109:8155-60.
8. Marchan R., et al, Cell Cycle 2012;11:4499-506.
9. Krishnamachary, B., et al, Cancer Research 2009; 69(8), 3464-34.
10. Vander Heiden, M. G., et al, Science 2009; 324(5930), 1029–1033
11. Erol A., Medical Hypotheses 2005; 65(3), 525–529
12. Bathen T.F.,et al, Cancer Research 2010;70(17), 6692–6696.
Figures