1527
Assessment of micronecrotic tumor tissue using dynamic contrast-enhanced magnetic resonance imagingOlga Schimpf1, Stefan Hindel1, and Lutz Lüdemann1
1Strahlenklinik, Med. Physik, Universitätsklinikum Essen, Essen, Germany
Synopsis
Compartmental models for evaluation of dynamic contrast-enhanced magnetic resonance imaging (DCE-MRI) datasets assume a homogeneous interstitital volume distribution and homogeneous contrast agent (CA) distribution within each compartment, neglecting effects of CA diffusion within the compartments. When necrotic or micronecrotic tumor tissue is present, these assumptions may no longer be valid. Therefore, the present study investigates the validity of three compartmental models in assessing tumors with necrotic components.
Introduction
Dynamic contrast-enhanced magnetic resonance imaging (DCE-MRI) typically uses low-molecular-weight contrast agents (LMWCAs). These LMWCAs extravasate instantaniously into the interstitial space, also known as the extravascular extracellular space. To assess enhancement after contrast agent administration, several pharmacokinetic compartmental models are used [1,2]. The most popular pharmacokinetic compartmental model is the so-called Tofts model [3], which uses a transfer constant to assess contrast enhancement. All of these models assume a homogeneous tracer concentration within each compartment and do not take diffusion effects into account. Compartmental models for evaluation of dynamic contrast-enhanced magnetic resonance imaging (DCE-MRI) datasets assume a homogeneous interstitital volume distribution and homogeneous contrast agent (CA) distribution within each compartment, neglecting effects of CA diffusion within the compartments. When necrotic or micronecrotic tumor tissue is present, these assumptions may no longer be valid. Therefore, the present study investigates the validity of three compartmental models in assessing tumors with necrotic components.Material and Methods
The general diffusion equation for inhomogeneous tissue was used to simulate the extravasation of a low-molecular-weight contrast agent from a feeding vessel into the interstitial space. The simulation was performed in 2D assuming cylindrical symmetry (see Fig.1). Two tissue slices with lengths of L=100μm and L=150μm were investigated. Local fractional interstitial volumes of 5%, 10%, 15%, 20%, and 25% were simulated for viable tissue and volumes of 50% and 100% for necrotic tissue. The radius of the necrotic area was varied between 10μm and 70μm for L=100μm and between 10μm and 100μm for L=150μm in steps of 10μm. The simulated concentration-time curves were evaluated using the extended Tofts model, a parallel 3-compartment model, and a sequential 3-compartment model.Results
The permeability and Ktrans calculated by using the Tofts model in a homogen tissue underestimates the actual input by more than a decade (see Fig. 2). For the simulations in inhomogen tissue with L=100μm, the extended Tofts-model and the parallel 3-compartment model failed to provide an interstitial volume fraction of less than 100% in 11% of cases, while the sequential 3-compartment model provided interstitial volume fractions of less than 100% for all concentration-time curves. The extended Tofts model overestimated the interstitial volume fraction by a median of 6.9%, the parallel 3-compartment model by 8.6%, and the sequential 3-compartment model by 0.2%. For the simulations with L=150μm, the extended Tofts model failed in 26% of cases to provide an interstitial volume fraction of less than 100%, the parallel 3-compartment model in 25%, and the sequential 3-compartment model in 7%. The extended Tofts model overestimated the interstitial volume fraction by a median of 10.0% and the parallel 3-compartment model by 15.5%, while the sequential 3-compartment model underestimated it by 18.8%. Overall, the sequential 3-compartment model provided more reliable results both for the total fractional interstitial volume and for the interstitial subcompartments.Conclusions
Our results show that the sequential 3-compartmental model is more suitable than the other two models for assessing contrast medium dynamics in inhomogeneous tissues such as tumors, having the lowest relative and absolute error rates in determining interstitial volume. The F-test has shown that the sequential model significantly better fits the concentration–time curve in heterogeneous tissue than the other two models. The sequential 3-compartment model yields smaller absolute deviations in determining the rapidly and slowly equilibrating interstitial components compared with the parallel 3-compartment model. Thus, the sequential model has the greatest potential to separate the fast and slow interstitial volumes in dynamic magnetic resonance imaging. On the other hand the current study shows that the sequential 3-compartment model is only a rough approximation and has to be improved.Acknowledgements
No acknowledgement found.References
- Sourbron S.P., Buckley D.L. Classic models for dynamic contrast-enhanced MRI. NMR Biomed. 2013;26(8):1004–1027
- Bergamino M., Bonzano L., Levrero F., Mancardi G.L., Roccatagliata L. A review of technical aspects of T1-weighted dynamic contrast-enhanced magnetic resonance imaging (DCE-MRI) in human brain tumors. Phys Med. 2014;30(6):635–643
- Tofts P.S., Brix G., Buckley D.L., Evelhoch J.L., Henderson E., Knopp M.V. Estimating kinetic parameters from dynamic contrast-enhanced T1-weighted MRI of a diffusable tracer: standardized quantities and symbols. J Magn Reson Imaging. 1999;10:223–232
Figures
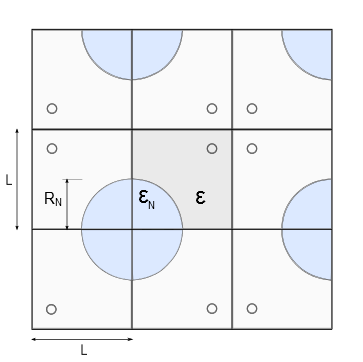
Fig. 1: Using reflecting boundary conditions, an unbounded tumor tissue with
circular blood capillaries drawn here in red is imitated. The simulated
tissue is composed of squares with side length L. Porosity is defined in a position-dependent manner with εN representing porosity within the necrotic core with radius RN and ε porosity in the remaining tissue outside the capillary.
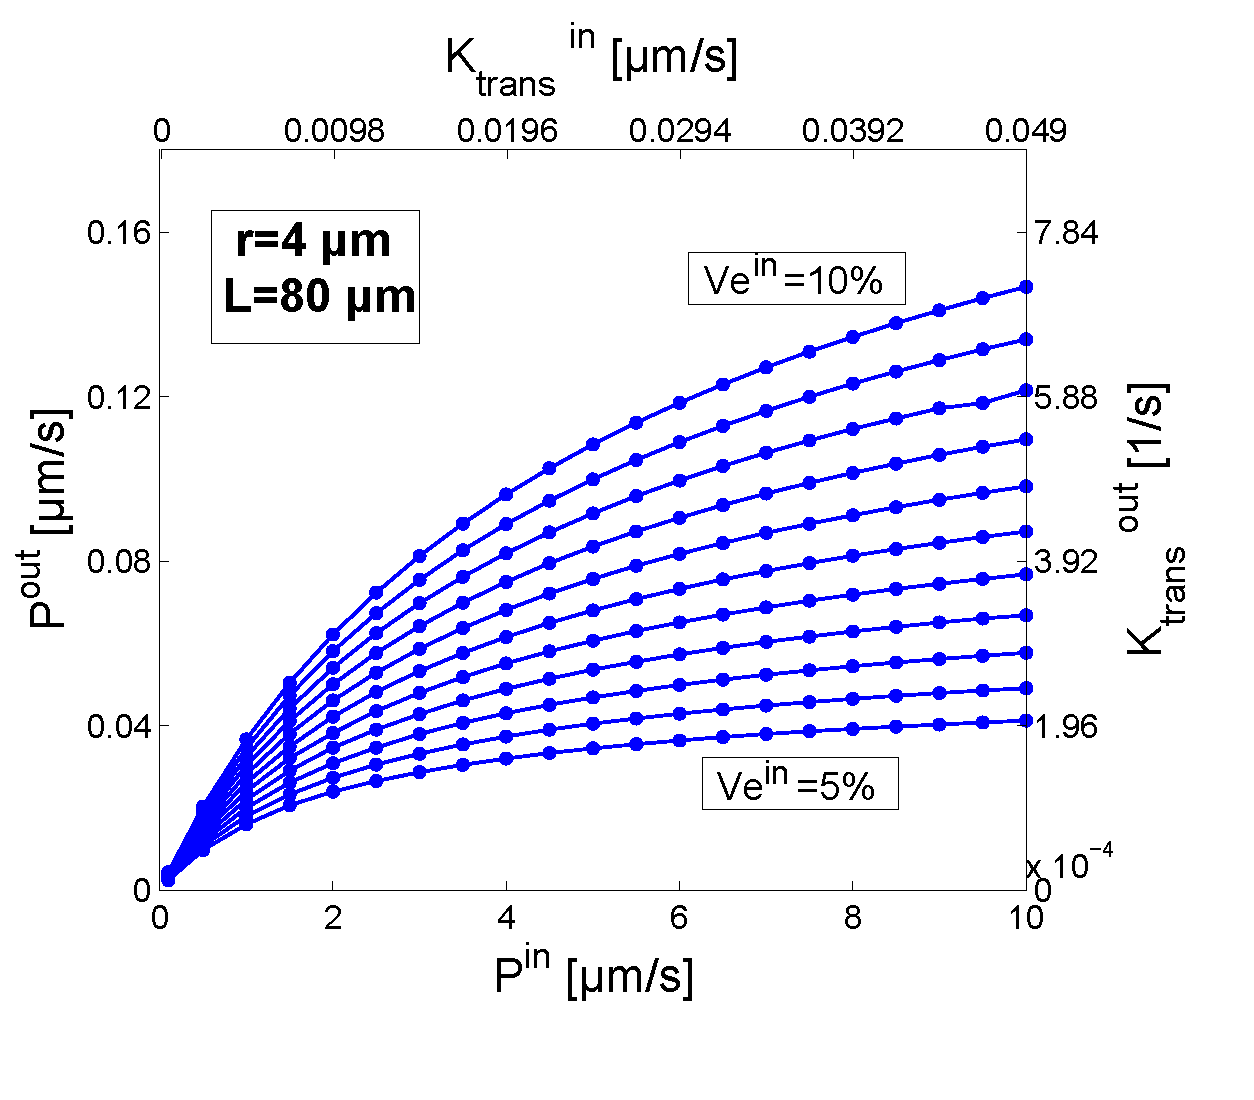
Fig. 2: Comparison of the input parameters permeability Pin and Ktransin used in the simulation to generate concentrationt time curves with the parameters calculated by the permeability limited Tofts model Pout and Ktransout using a vessel radius r=4μm and a vesseldistance L=80μm.