1523
Grading of gliomas using Neurite orientation dispersion and density imaging (NODDI) on a clinical scanner1Dayananda Sagar Institutions, Bangalore, India, 2National Institute of Mental Health and Neuroscience, Bangalore, India
Synopsis
Diffusion tensor imaging is sensitive to movement of water molecules but not specific as a biomarker in evaluating the highly complex microstructural environment of gliomas. Neurite orientation dispersion and density imaging (NODDI) uses different strengths of diffusion gradients to provide more specific indices of tissue microstructure than DTI. Patients with grade IV gliomas exhibited significant increase in both neurite density and orientation dispersion index as compared to grade III and II glioma cases. This study demonstrates clinical feasibility of using NODDI as a biomarker to grade tumors.
Introduction
Neurite orientation dispersion and density imaging (NODDI) relies on a biophysical model that separates the diffusion of water in brain tissue into three types of microstructural environment: intra-neurite, extra-neurite, and cerebrospinal fluid (CSF) compartments.1 In this study, we sought to determine the effectiveness of NODDI as an in-vivo imaging marker to differentiate grade II and III from grade IV tumors which has the worst prognosis in terms of survival despite treatment. This technique supports our hypothesis that the free water component provides information on vasogenic edema2 and changes in cell density would be reflected in hindered water compartment.Methods
A total of 25 patients (male: 17, female: 8) with histologically proven cases were retrospectively recruited from our institution records, where diffusion imaging as per the following parameters were available. The study included grade II(n=7), grade III(n=9) and grade IV(n=9).
DWI acquisition: The optimized protocol includes: TR/TE= 4000 ms/104 ms, slices =15, acquisition matrix= 128 X 128, image resolution = 1.7 X 1.7 X 4 mm3. Diffusion encoding was applied in 15 directions with b = 1000, 2500 s/mm2 data were used for the NODDI analysis Pre-processing and NODDI parameters estimation: DW-MRI data was preprocessed for correcting eddy-current induced distortions and motion using FSL tool3. NODDI microstructure parametric maps were estimated from the preprocessed data for all the slices using the NODDI toolbox1on MATLAB 7.1. Region of interest (ROI) were drawn manually on tumor regions of intra-cellular volume fraction (ICVF), neurite orientation dispersion index (ODI) and isotropic (CSF) volume fraction (FISO) with T2 weighted images as reference.
Mean ROI values for ICVF, ODI and FISO were subjected to Mann-Whitney U test for difference between the two groups (grade II,III vs IV), and statistically significant ROC curves were constructed to find cut-offs (using Youden index) for the said parameters for differentiation between the groups. Binary logistic regression was employed for computing probabilities of group membership prediction with ICVF and ODI combined, and the probabilities used to compute ROC curve for combined prediction of grade 4 gliomas using both the variables.4
Results
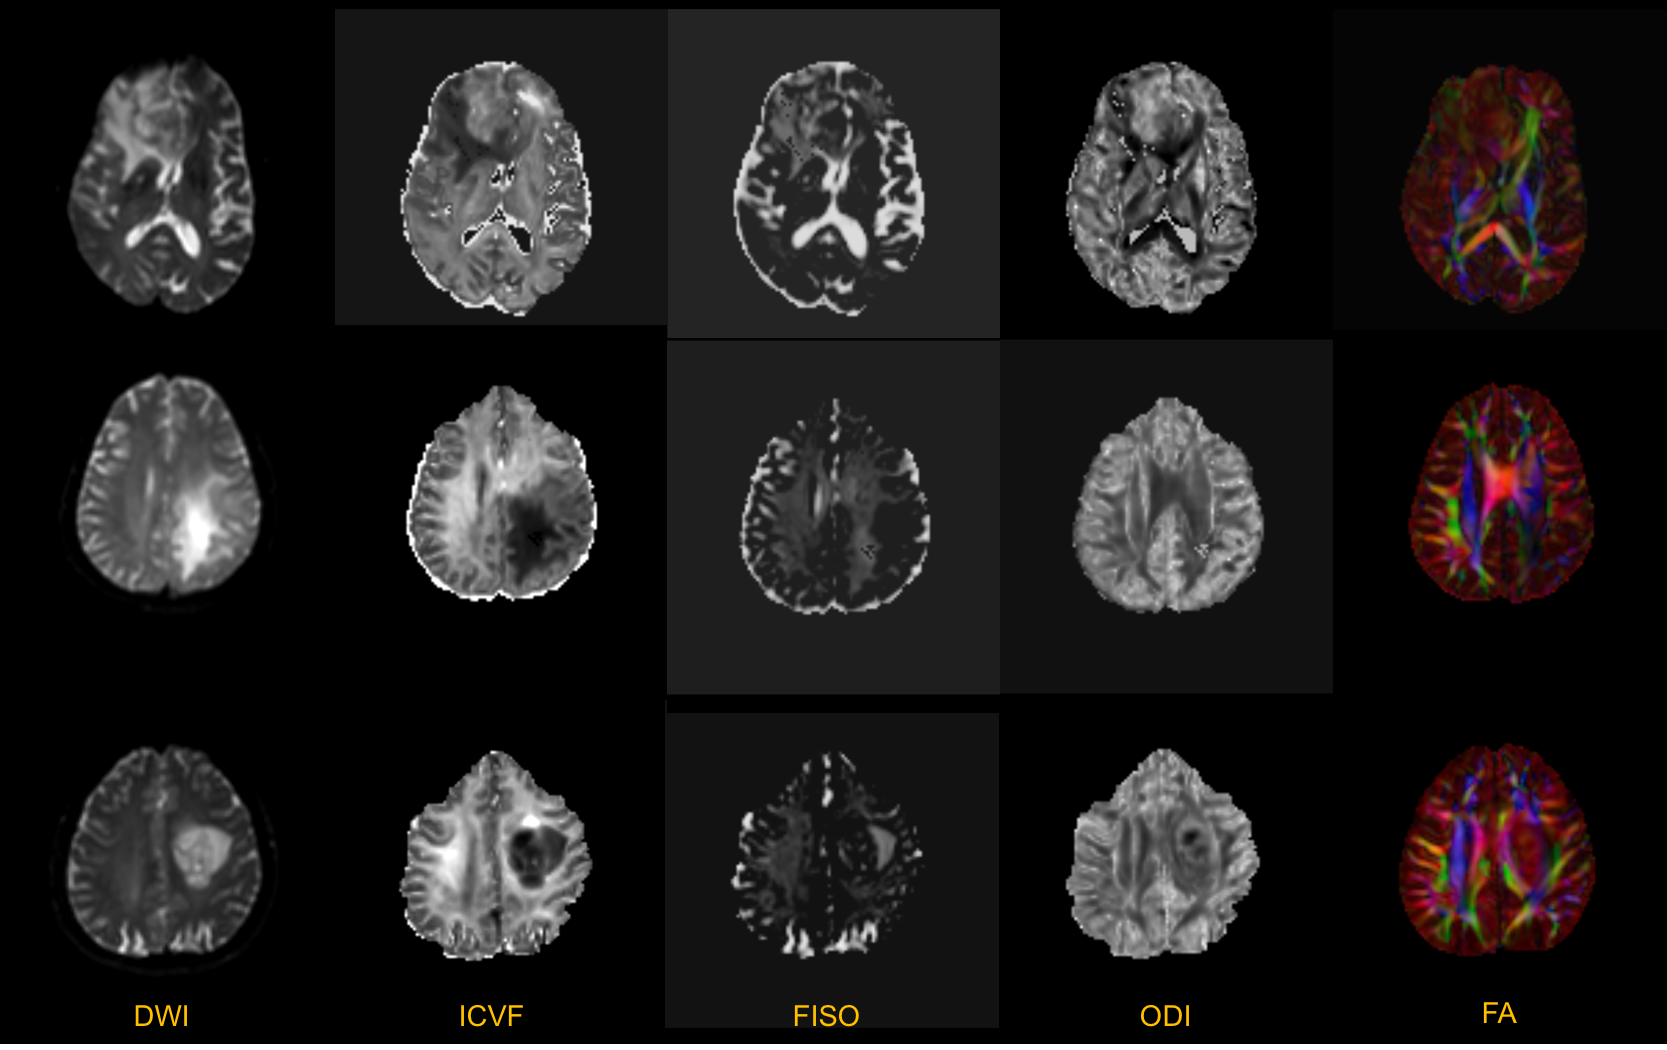
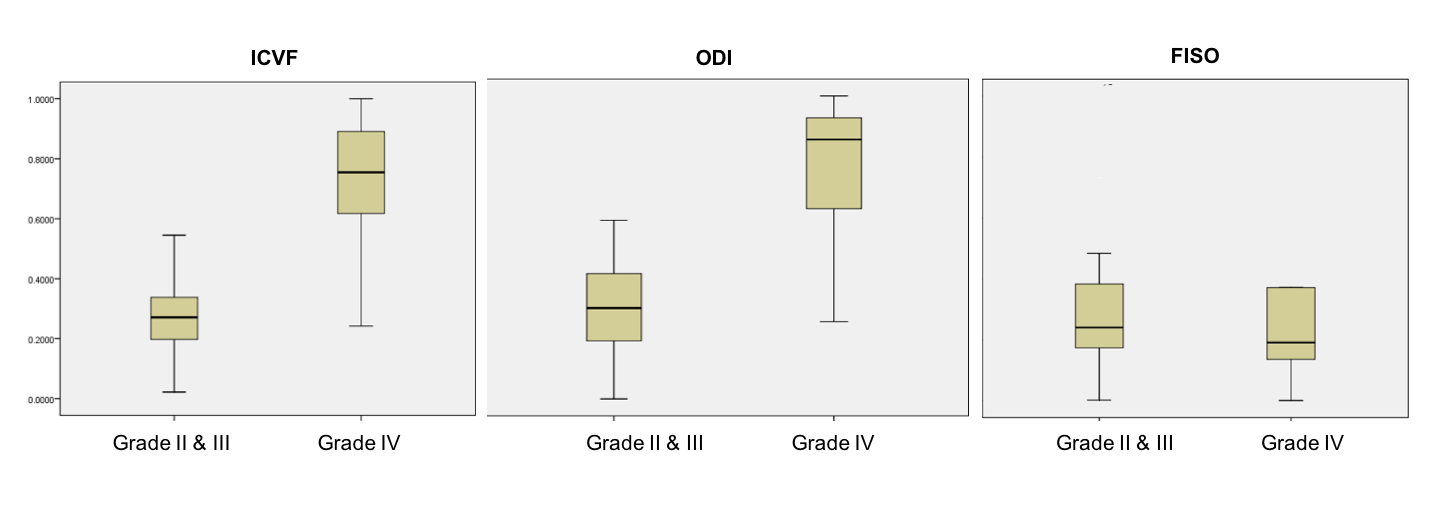
Figure 1 top row shows significant increase in ICVF and ODI representing grade IV glioma as compared to middle and bottom rows depicting grade III and II glioma respectively. It is apparent from our understanding that tumours with vasogenic edema show increase in FISO component as compared to the normal appearing white or grey matter. However, when the same was extended to differentiate the various grades of gliomas as in this study, FISO was not useful in differentiating the various grades (P=0.558). Box whiskers plot in figure 2 further explains differentiations of grade IV versus grade II,III for various NODDI parameters.
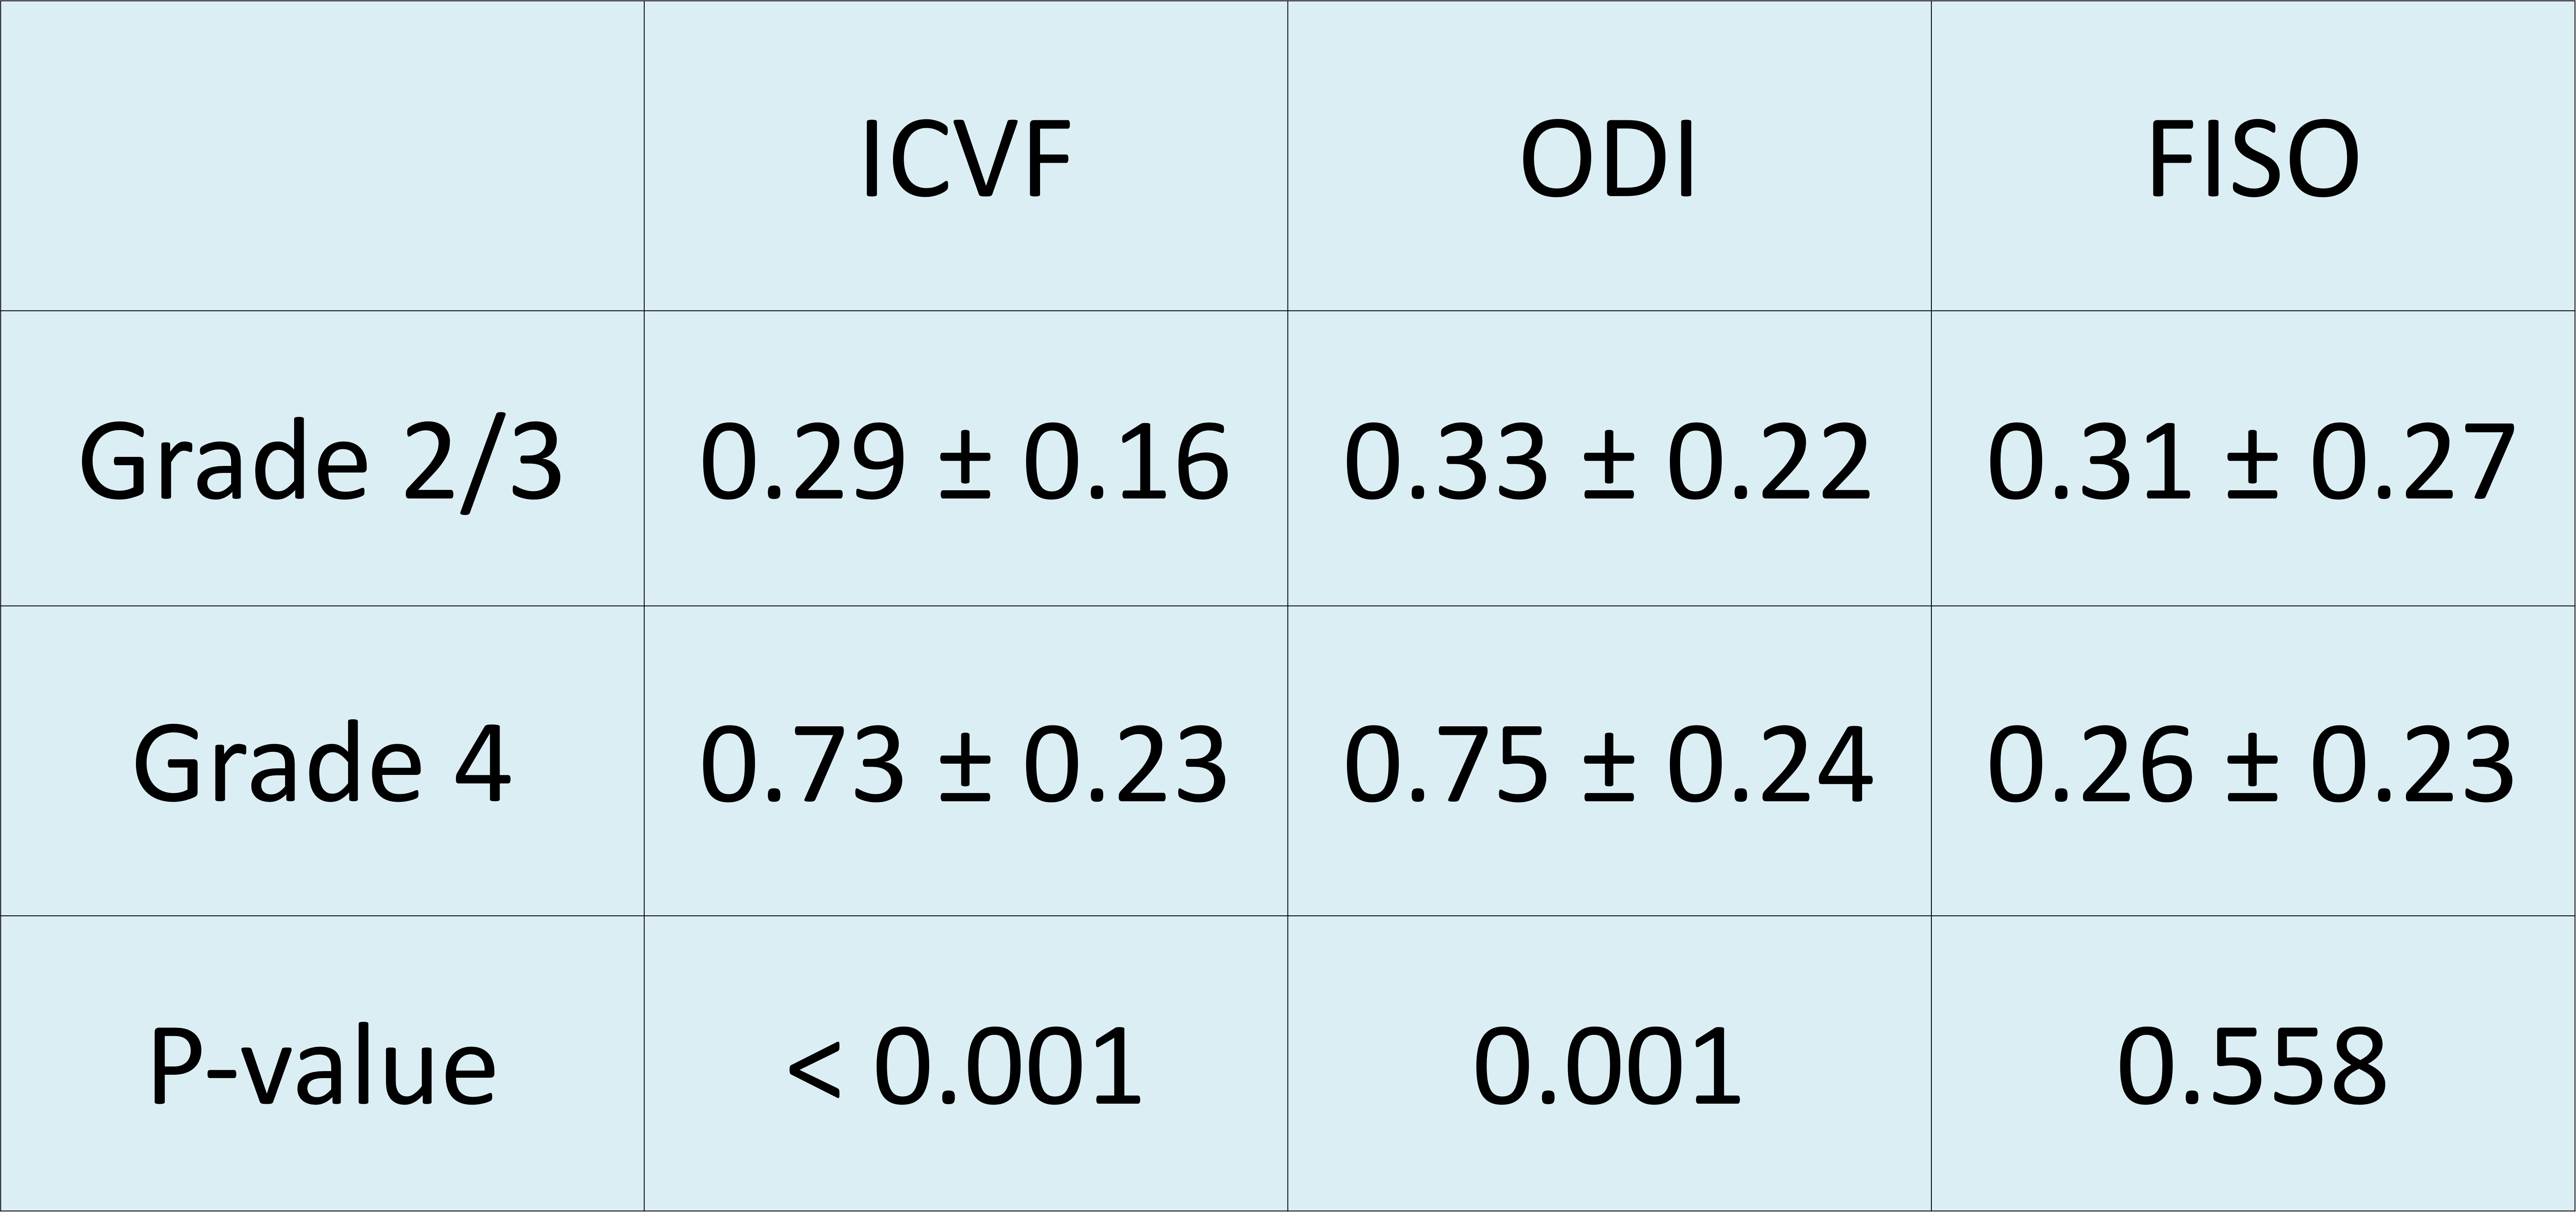
Figure 3 shows results of Mann-Whitney tests performed on ICVF, ODI and FISO for grade II,III compared to grade IV gliomas; ICVF and ODI were significantly higher in grade IV gliomas (ICVF:0.73±0.23 ,ODI:0.75 ±0.24) as compared to grade II and III gliomas (ICVF: 0.29±0.16, ODI:0.33±0.22) (P<0.001).
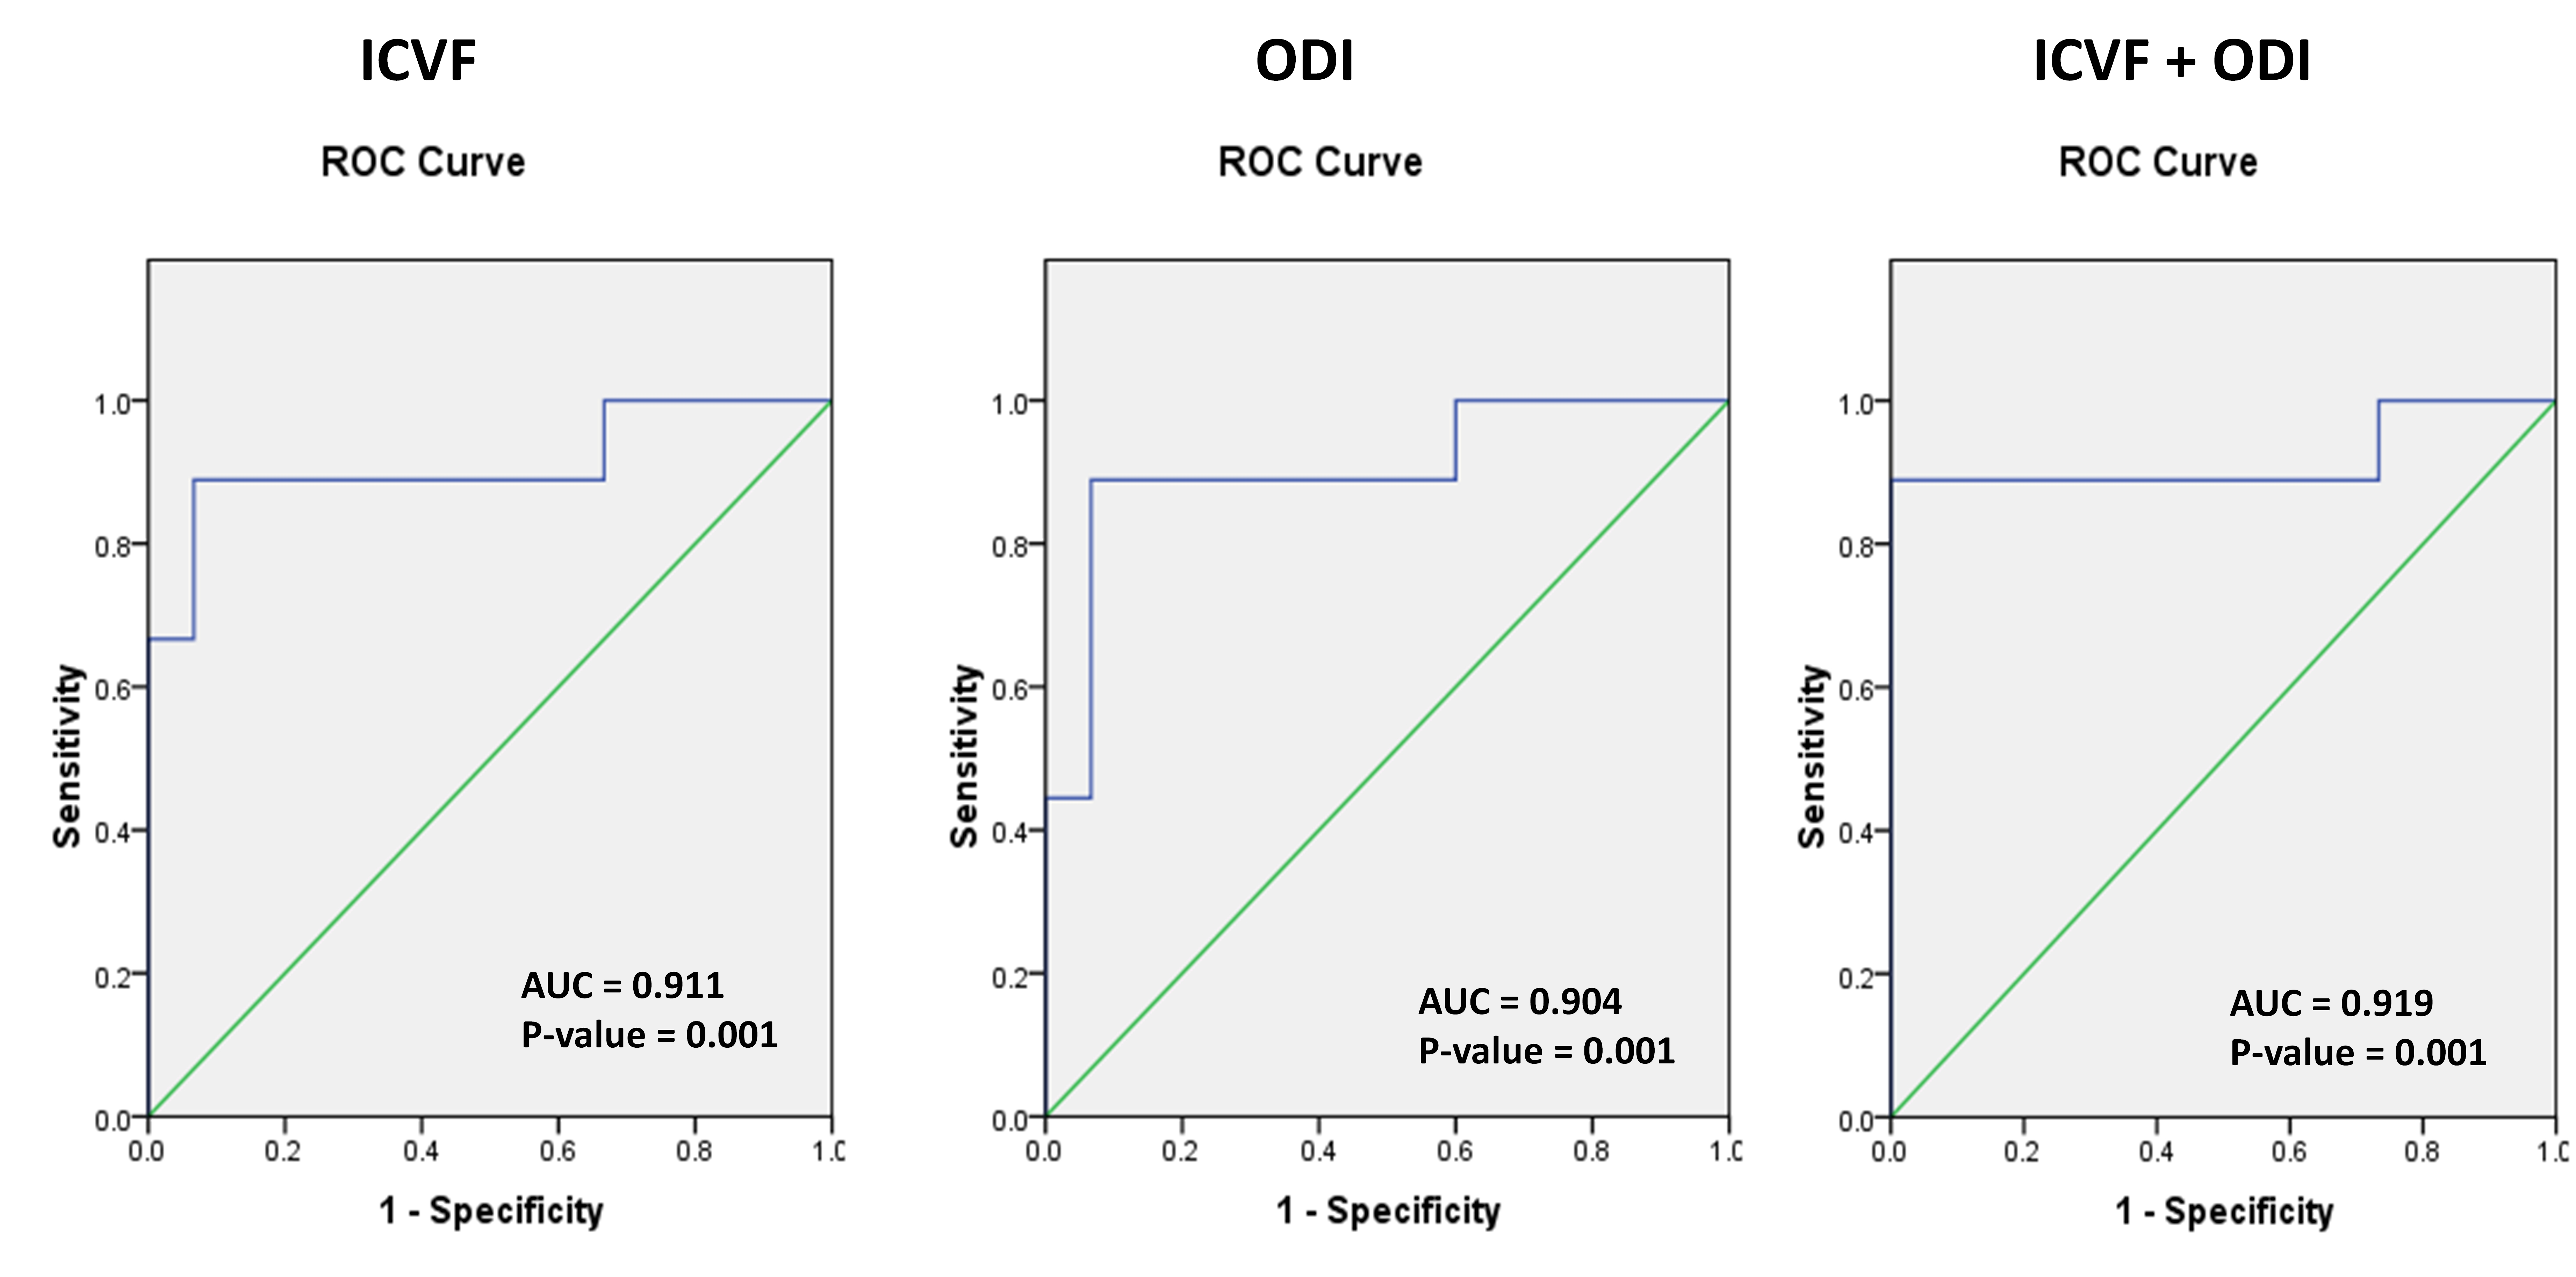
ROC curve in figure 4, shows that both ICVF and ODI have good diagnostic value with ICVF having an AUC=0.911 (P=0.001) and a cut-off value of 0.580, with sensitivity of 89.9% and specificity of 67%; and in the case of ODI, AUC=0.904 (P=0.001), cut-off value=0.589, with sensitivity of 89.9% and specificity of 67% in predicting grade IV versus grade II and III gliomas. Combining predictive probabilities of both ICVF and ODI by logistic regression showed that the AUC for predicting grade IV gliomas was slightly higher (AUC = 0.919, P=0.001).
Discussion
We observed extensive increase in ICVF and ODI in high grade gliomas as compared to low grade gliomas. A contradictory finding is that the increase in ICVF in gliomas, which by NODDI terms indicate neurite density; is due to disproportionate increase in the glial cells the fraction of neurites per se will be less in the solid regions of the tumour. However, it is paradoxically increased and has been consistently shown in the previous studies also.5 This is consistent with our finding that ICVF is increased in grade IV gliomas much more than grade 3 and 2 gliomas which can be explained by densely packed tumour cells. The difference was found to be statistically significant. NODDI technique better characterizes and depicts the highly heterogeneous microstructural environment of gliomas and also provide a different architecture due to varying tissue compositions when compared to conventional imaging and can help in targeting sites for biopsy and follow up of treatment effects.Acknowledgements
References
1. H. Zhang, et al. NODDI: practical in vivo neurite orientation dispersion and density imaging of the human brain NeuroImage, 61 (4) (2012), pp. 1000-1016
2. Stummer W. Mechanisms of tumor-related brain edema Neurosurg. Focus, 22 (5) (2007), p. E8, 10.3171/foc.2007.22.5.917613239
3. M.W. Woolrich, S. Jbabdi, B. Patenaude, M. Chappell, S. Makni, T. Behrens, C. Beckmann, M. Jenkinson, S.M. Smith. Bayesian analysis of neuroimaging data in FSL. NeuroImage, 45:S173-86, 2009
4. IBM Corp. Released 2012. IBM SPSS Statistics for Windows, Version 21.0. Armonk, NY: IBM Corp.
5. Wen Q, Kelley DAC, Banerjee S, et al. Clinically feasible NODDI characterization of glioma using multiband EPI at 7 T. NeuroImage : Clinical. 2015;9:291-299. doi:10.1016/j.nicl.2015.08.017.
Figures