1521
Repeatability of intravoxel incoherent motion diffusion-weighted MRI during chemoradiation therapy in head and neck cancersRamesh Paudyal1, Nadeem Riaz2, Vaios Hatzoglou3, Xie Peng2,4, Jonathan Leeman2, David Aramburu Nunez1, Yonggang Lu5, Joseph O. Deasy1, Nancy Lee2, and Amita Shukla-Dave1,3
1Medical Physcis, Memorial Sloan Kettering Cancer Center, New York, NY, United States, 2Radiation Oncology, Memorial Sloan Kettering Cancer Center, New York, NY, United States, 3Radiology, Memorial Sloan Kettering Cancer Center, New York, NY, United States, 4Radiation Oncology, Shandong Cancer Hospital & Institute, Jinan, China, 5Radiology, Medical College of Wisconsin, Milwaukee, WI, United States
Synopsis
The aim of this study is to determine the repeatability of pre- treatment (TX) and intra- TX week 1 imaging metrics derived from intravoxel incoherent motion diffusion weighted imaging (IVIM-DWI) in head and neck (HN) cancer patients during chemoradiation therapy. ADC, D, and D* imaging metrics showed better repeatability measurement than f in the metastatic node of HN cancer patients.
Purpose:
Intravoxel incoherent motion-diffusion weighted imaging (IVIM-DWI) is a non-invasive magnetic resonance (MR) technique that enables measuring the cellularity and vascularity of tumor tissue without contrast agents1. Quantitative imaging metrics derived from IVIM-DWI have shown promise in the assessment of treatment response in various cancers, including head and neck (HN) cancers2-4. However, a repeatability measure of IVIM-DWI-derived quantitative imaging metric values is needed to examine the therapy-related response from the measurement variations. IVIM-DWI has been shown to have a tendency towards better repeatability for the measurement of D whereas f and D* are still exploratory in nature5-7. This is the first study to determine the repeatability of IVIM-DWI-derived metrics from HN cancer patients undergoing chemoradiation therapy.Material and Methods: IVIM-DWI data acquisition:
Eight HN cancer patients with metastatic nodes (M/F: 6/2, median age: 61 years) were studied before initiation of the treatment (pre-TX) and 16 IVIM-DWI datasets were obtained. Additionally, 14 IVIM-DWI datasets were acquired at intra-TX week 1 (during chemoradiation therapy) from seven patients (M/F: 6/1, median age: 59 years). Our institutional review board approved this retrospective study.The MR imaging (MRI) scan consisted of multi-planar T1/T2-weighted imaging followed by IVIM-DWI with multi b-values on a 3.0T scanner (Ingenia, Philips Healthcare, Netherlands) using a 20-channel neurovascular phased-array coil. The IVIM- DWI images were acquired using a single-shot spin echo planar imaging sequence with TR = 4000 ms, TE = 80-100 ms, field of view = 20-24 cm, matrix = 128 × 128, slices = 8-10, slice thickness = 5 mm, NEX = 2 and b = 0, 20, 50, 80, 200, 300, 500, 800, 1500, and 2000 s/mm2. Two IVIM-DWI datasets were acquired at the same MR exam for each patient to test for the repeatability of the metrics, totalling 30 IVIM-DWI datasets.IVIM-DWI data analysis:
Regions of Interest (ROIs) were delineated on the neck nodal metastases by a team of radiation oncologists and neuro radiologist who were in consensus on the IVIM DW-MRI image (b = 0 s/mm2) using Image J8. The ROIs were then exported to an in-house MATLAB platform for data analysis which includes (a) mono-exponential model to calculate apparent diffusion coefficient (ADC), and (b) bi-exponential model to estimate the diffusion coefficient (D), perfusion fraction (f) and pseudo diffusion coefficient (D*)1, 8.Statistical analysis:
A Wilcoxon Rank-Sum test was used to compare the metrics between repeated measurements. The test/retest repeatability of metrics were analyzed using the within-subject coefficient of variation CV (wCV, %) and were visualized by Bland-Altman plots9-10.Results:
The metric values for ADC, D, f, and D* at the pre-TX is shown in Figure 1. ADC, D, f, and D* values were not significantly different between the repeated measurements (p > 0.05) at the pre-TX and intra-TX week 1. The differences in ADC and D values between the repeated measurements against the mean ADC and D at the pre-TX and intra-TX week 1 are displayed in Figures 2 and 3, respectively. No relationship between the difference and the mean of repeated measurements for any of the parameters measured was found. Table 1 shows the wCV for the quantitive imaging metrics. The wCV (%) for the ADC, D, D*, and f in eight subjects at the pre-TX were 4.0%, 3.9%, 3.8%, and 25%, respectively. At the intra-TX week 1, wCV (%) for the ADC, D, D*, and f in seven subjects were 2.4%, 6.0%, 4.4%, and 19.6%, respectively.Discussion:
Mean ADC, D, and D* values of tumors are repeatable within the coefficient of variation wCV (%) were ≤ to 6% for both pre- and intra-TX week 1 whereas f wCV (%) was ≤ to 25% for both pre- and intra-TX week 1. This is the first study assessing repeatability and exhibiting that ADC, D, and D* are robust imaging metrics for assessing treatment response in HN cancer patients. Quantitative imaging biomarker development requires repeatability data for the imaging metrics so that they can be used in clinical applications.Conclusion:
After appropriate validation in a larger HN cancer patient population, these findings may be useful for evaluating treatment response in clinical trials.Acknowledgements
This work was supported by the MSKCC internal IMRAS grant and in part through the NIH/NCI Cancer Center Support Grant: P30 CA008748.References
1. Le Bihan D. Intravoxel incoherent motion imaging using steady-state free precession. Magnetic resonance in medicine. 1988;7(3):346-51. Epub 1988/07/01. PubMed PMID: 3205150. 2. Reischauer C, Patzwahl R, Koh DM, Froehlich JM, Gutzeit A. Non-Mono-Exponential Analysis of Diffusion-Weighted Imaging for Treatment Monitoring in Prostate Cancer Bone Metastases. Sci Rep-Uk. 2017;7. doi: ARTN 5809 10.1038/s41598-017-06246-4. PubMed PMID: WOS:000405894200027. 3. Paudyal R, Oh JH, Riaz N, Venigalla P, Li J, Hatzoglou V, Leeman J, Nunez DA, Lu Y, Deasy JO, Lee N, Shukla-Dave A. Intravoxel incoherent motion diffusion-weighted MRI during chemoradiation therapy to characterize and monitor treatment response in human papillomavirus head and neck squamous cell carcinoma. Journal of magnetic resonance imaging : JMRI. 2017;45(4):1013-23. doi: 10.1002/jmri.25523. PubMed PMID: 27862553; PMCID: PMC5363344. 4. Ding Y, Hazle JD, Mohamed AS, Frank SJ, Hobbs BP, Colen RR, Gunn GB, Wang J, Kalpathy-Cramer J, Garden AS, Lai SY, Rosenthal DI, Fuller CD. Intravoxel incoherent motion imaging kinetics during chemoradiotherapy for human papillomavirus-associated squamous cell carcinoma of the oropharynx: preliminary results from a prospective pilot study. NMR in biomedicine. 2015. doi: 10.1002/nbm.3412. PubMed PMID: 26451969. 5. Dyvornea H, Jajamovicha G, Kakitea S, Kuehn B, Taoulia B. Intravoxel incoherent motion diffusion imaging of the liver:Optimal b-value subsampling and impact on parameterprecision and reproducibility. European Journal of Radiology 2014;83: 2109–13. 6. Andreou A, Koh DM, Collins DJ, Blackledge M, Wallace T, Leach MO, Orton MR. Measurement reproducibility of perfusion fraction and pseudodiffusion coefficient derived by intravoxel incoherent motion diffusion-weighted MR imaging in normal liver and metastases. European radiology. 2013;23(2):428-34. doi: 10.1007/s00330-012-2604-1. PubMed PMID: 23052642. 7. Patel J, Sigmund EE, Rusinek H, Oei M, Babb JS, Taouli B. Diagnosis of cirrhosis with intravoxel incoherent motion diffusion MRI and dynamic contrast-enhanced MRI alone and in combination: preliminary experience. Journal of magnetic resonance imaging : JMRI. 2010;31(3):589-600. doi: 10.1002/jmri.22081. PubMed PMID: 20187201. 8. Rasband WS. ImageJ. Bethesda, Maryland, USA: U. S. National Institutes of Health; 1997-2016. 9. Barnhart HX, Barboriak DP. Applications of the Repeatability of Quantitative Imaging Biomarkers: A Review of Statistical Analysis of Repeat Data Sets. Translational oncology. 2009;2(4):231-5. doi: 10.1593/tlo.09268. PubMed PMID: WOS:000272551800006. 10. Raunig DL, McShane LM, Pennello G, Gatsonis C, Carson PL, Voyvodic JT, Wahl RL, Kurland BF, Schwarz AJ, Gonen M, Zahlmann G, Kondratovich MV, O'Donnell K, Petrick N, Cole PE, Garra B, Sullivan DC, Grp QTPW. Quantitative imaging biomarkers: A review of statistical methods for technical performance assessment. Stat Methods Med Res. 2015;24(1):27-67. doi: 10.1177/0962280214537344. PubMed PMID: WOS:000351840700003.Figures
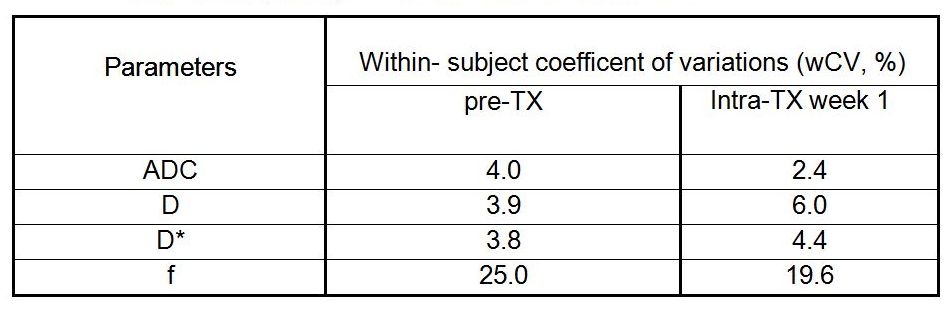
Table 1. Repeatability analysis of IVIM-DWI measurements
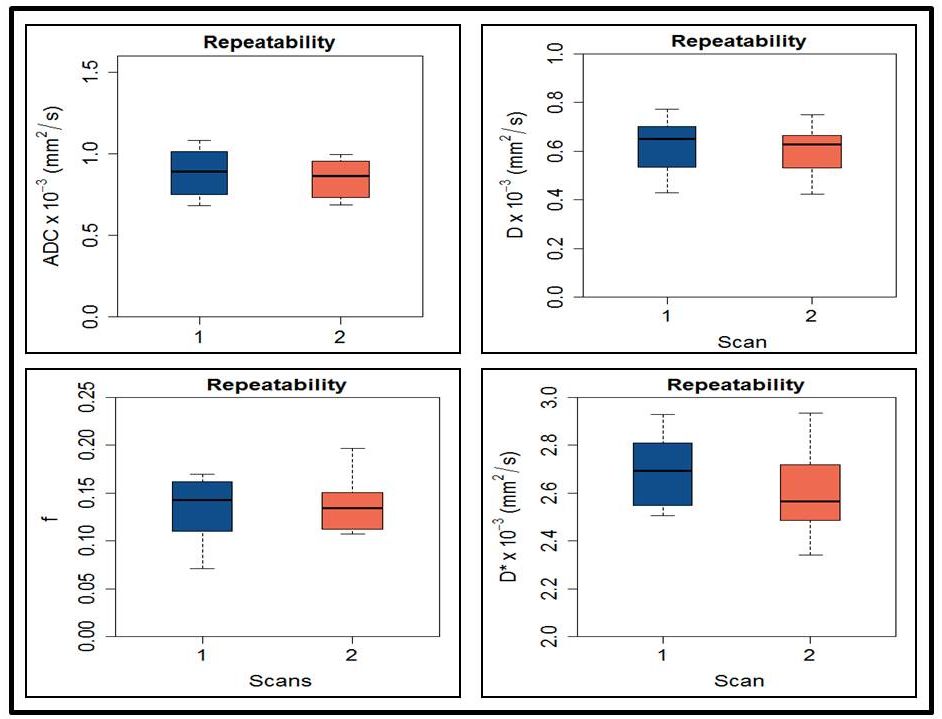
Figure 1. Box
plots comparing the pretreatment (pre-TX) values for (a) apparent
diffusion coefficient (ADC) x 10-3 (mm2/s) (b) diffusion
coefficient (D) x 10-3 (mm2/s), (c) perfusion fraction (f),
and (d) pseudo diffusion coefficient (D*) x 10-3 (mm2/s)
obtained from head and neck cancer patients.
Each
box plot shows minimum, first quartile, median (black line), third quartile, and
maximum values.
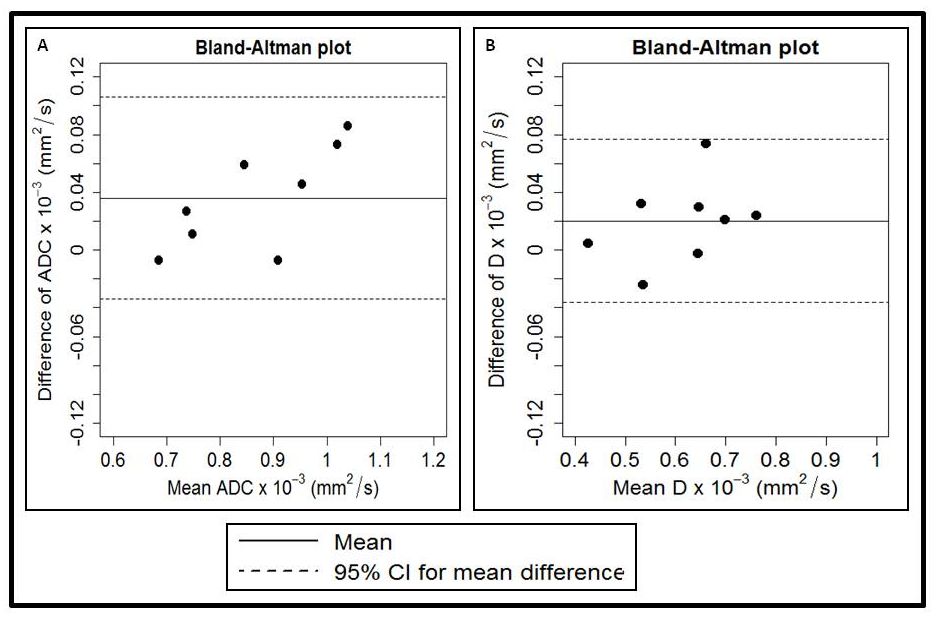
Figure 2. Bland–Altman plots of (a) apparent
diffusion coefficient (ADC) x 10-3 (mm2/s) and (b) diffusion coefficient (D) x 10-3 (mm2/s) obtained from the
metastatic node in head and neck cancer patients on pre-TX. The solid lines
correspond to the mean differences between two estimates and the dashed lines
show the 95% limits of agreement.
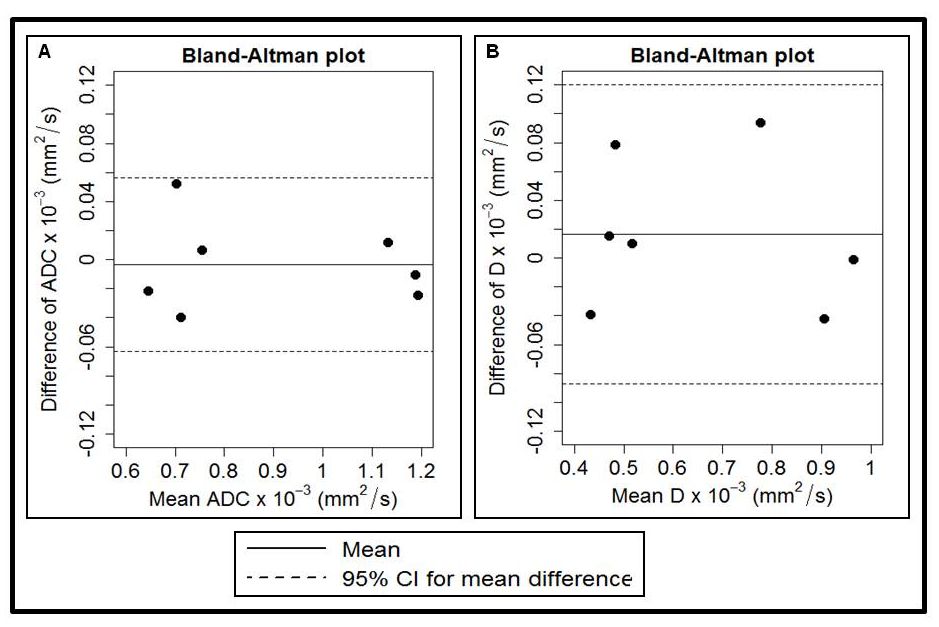
Figure 3. Bland–Altman plots of (a) apparent
diffusion coefficient (ADC) x 10-3 (mm2/s) and (b) diffusion coefficient (D) x 10-3 (mm2/s)obtained from the
metastatic node in head and neck cancer patients on an intra-TX week 1. The
solid lines correspond to the mean differences between two estimates and the
dashed lines show the 95% limits of agreement.