1510
MRI-based radiomic to assess lipomatous soft tissue tumors malignancy: a pilot study1Laboratoire CREATIS (CNRS UMR 5220, Inserm U1206, INSA-Lyon, UCBL Lyon 1), Université de Lyon, Lyon, France, 2Department of radiology, Centre de lutte contre le cancer Léon Berard, Lyon, France, 3Department of oncology, Centre de lutte contre le cancer Léon Berard, Lyon, France
Synopsis
Aim of this study was to develop a MRI-based radiomic method to assess lipomatous soft tissue tumors malignancy. 105 subjects with lipomatous soft tissue tumors whose histology was known and with fat-suppressed T1w contrast enhanced MR images available were retrospectively enrolled to constitute a database. Based on histology, three groups were constituted according to malignancy from lipomas to high grade liposarcomas. A decisional algorithm based on 2 multivariate radiomic models was built to distinguish between these groups. Results demonstrate that the evaluation of lipomatous tumor malignancy is feasible using a routinely used MRI acquisition in clinical practice.
Introduction
Lipomatous soft tissue tumors originate from mesenchymal tissue and can be either benign (such as lipomas) or malignant (liposarcomas). While benign lipomas can be treated with marginal excision or by simple follow-up, borderline lesions such as well-differentiated liposarcomas (WDL) and atypical lipomatous tumors (ALT) require a complete excision due to the risk of local recurrence and the potential for dedifferentiation (1,2). High grades liposarcomas may require a multimodal therapy according to the aggressiveness of the tumor with a large excision concomitant with chemotherapy and/or radiotherapy (1,2). Therefore, the noninvasive diagnosis between benign lipomas, borderline WDL/ALT and high grade subtype of liposarcomas is crucial since it directly drive the therapy strategy. In this study, we aim to develop and validate a MRI-based radiomic method to classify between these three forms of lipomatous soft tissue tumors.Subjects and methods
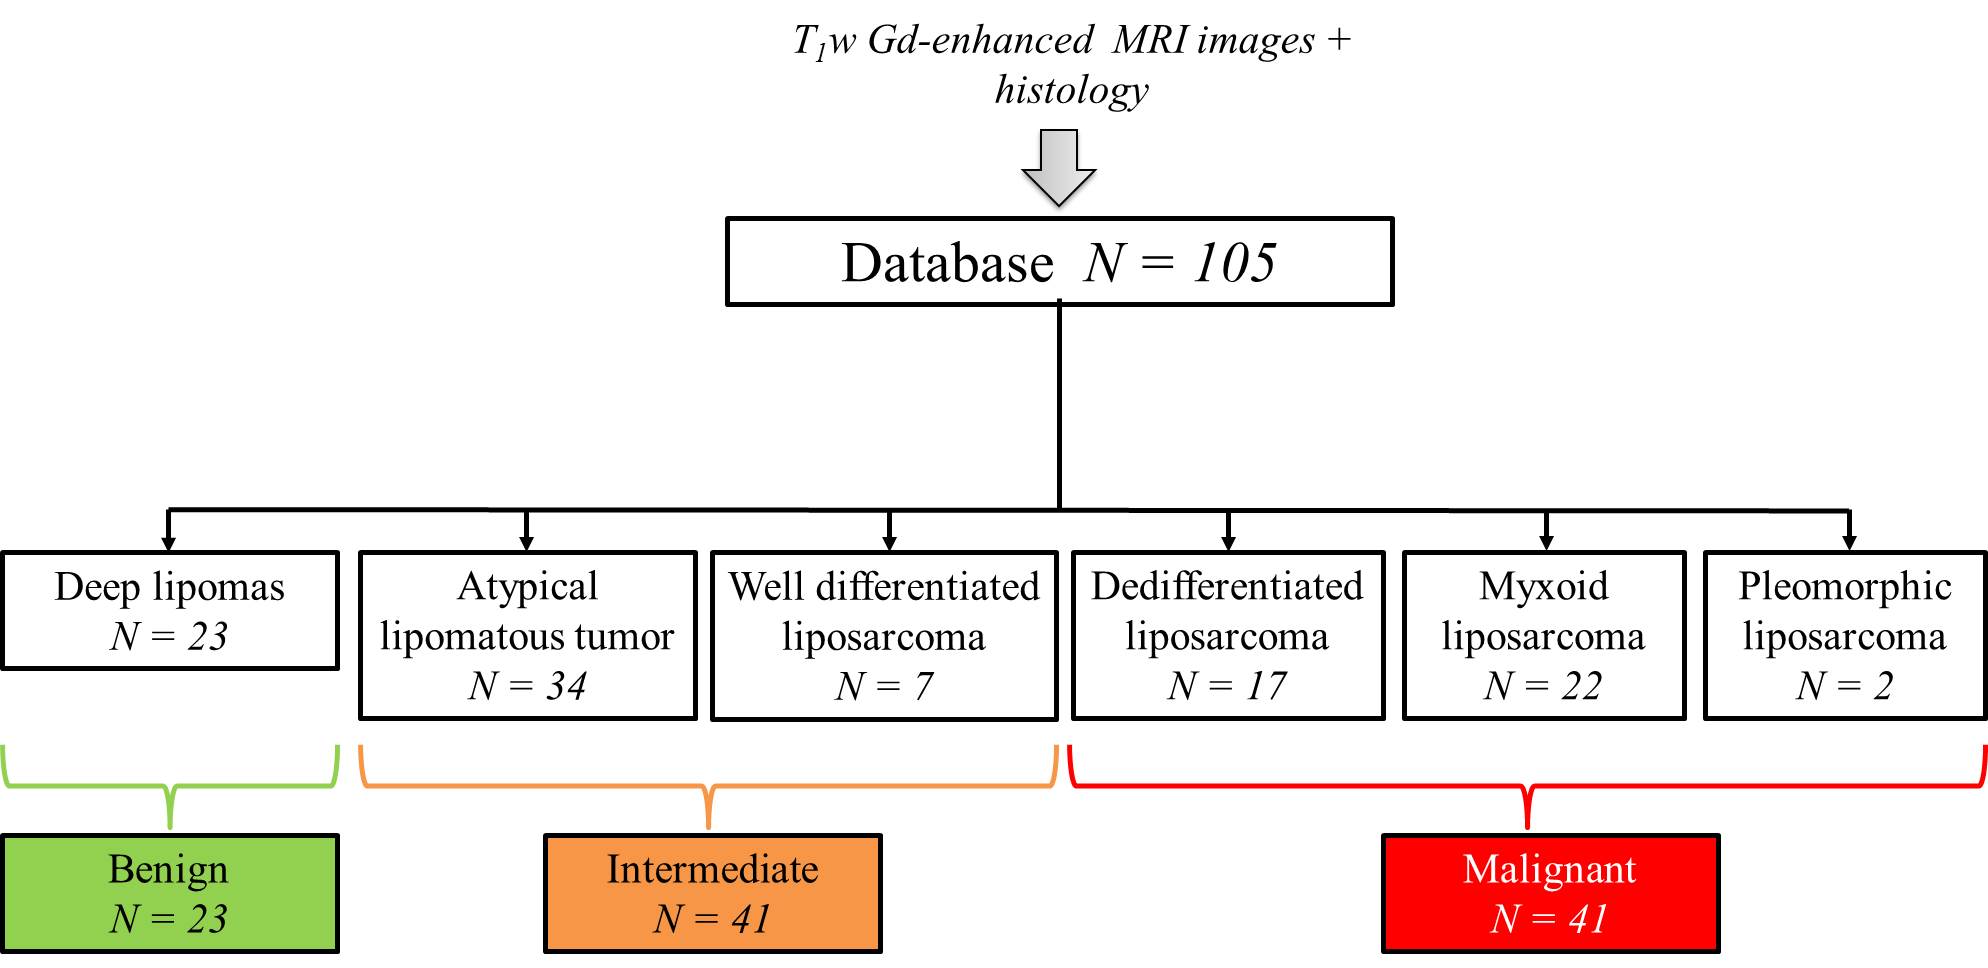
Database – 105 subjects with lipomatous soft tissue tumors with histology and fat-suppressed T1w contrast enhanced MR images available were retrospectively enrolled to constitute the database. The repartition of tumor histology is summarized in Fig.1. According to histology, three groups have been constituted: the benign group including deep lipomas (n = 23), the intermediate group including ALT and WDL (n = 41) and the malignant group including high grade liposarcomas (myxoid, dedifferentiated, and pleomorphic) (n = 41) (Fig.1). MR images were obtained from 56 different centers with non-uniform protocols. Acquisitions were performed at 3 different fields (1.0T, 1.5T, and 3.0T) with 18 different MR systems commercialized by 4 vendors. In 65% of cases, images were acquired with a 2D fast spin echo sequence (53.3% with a fat saturation and 11.7% with a fat-water decomposition); in 4.9% of cases with a 3D isotropic fast spin echo sequence and in 35% of cases with a 3D gradient echo sequence (16.5% with a fat saturation and 13.6% with a fat-water decomposition). Mean pixel size was 0.81² ± 0.29² mm² (range: 0.37² – 1.75² mm²). Radiomic features extraction – Images were automatically loaded on an in-house software developed on Matlab R2017a. First, the tumor was segmented manually by two observers blinded to histology in order to evaluate the inter-observer reproducibility. Tumor mask was next applied on fat-suppressed enhanced MR image and 87 radiomic features were extracted. They included size, shape, intensity distribution, image domain (based on GCLM, GLRLM, GLSZM and NGTDM matrices) and frequency domain (based on Gabor filtering) textures features. Data mining – A 2 step decisional algorithm was built. In a first step, a multivariate model was used to classify between benign and (intermediate + malignant) groups. If result of test is “benign” algorithm is stopped. If it is not the case, a second model was used to classify between intermediate and malignant groups. Initial feature data set was first reduced to obtain a new balanced set balanced between inter-observer reproducibility, discriminative power and redundancy. This operation was done with a double thresholding on Pearson’s correlation coefficient beforehand computed in the reproducibility study (t > 0.8) and on p-value computed with t-test (t < 5%). From the reduced data set, the incorporation of features into multivariable models was performed using a logit transform without feature normalization. Feature selection and regression coefficients computation was done order-by-order by maximizing the 0.632 + bootstrap AUROC with an imbalance-adjusted bootstrap resampling procedure as proposed in (3-6). Optimal order was chosen such as sensitivity, specificity and AUROC were maximal.Results
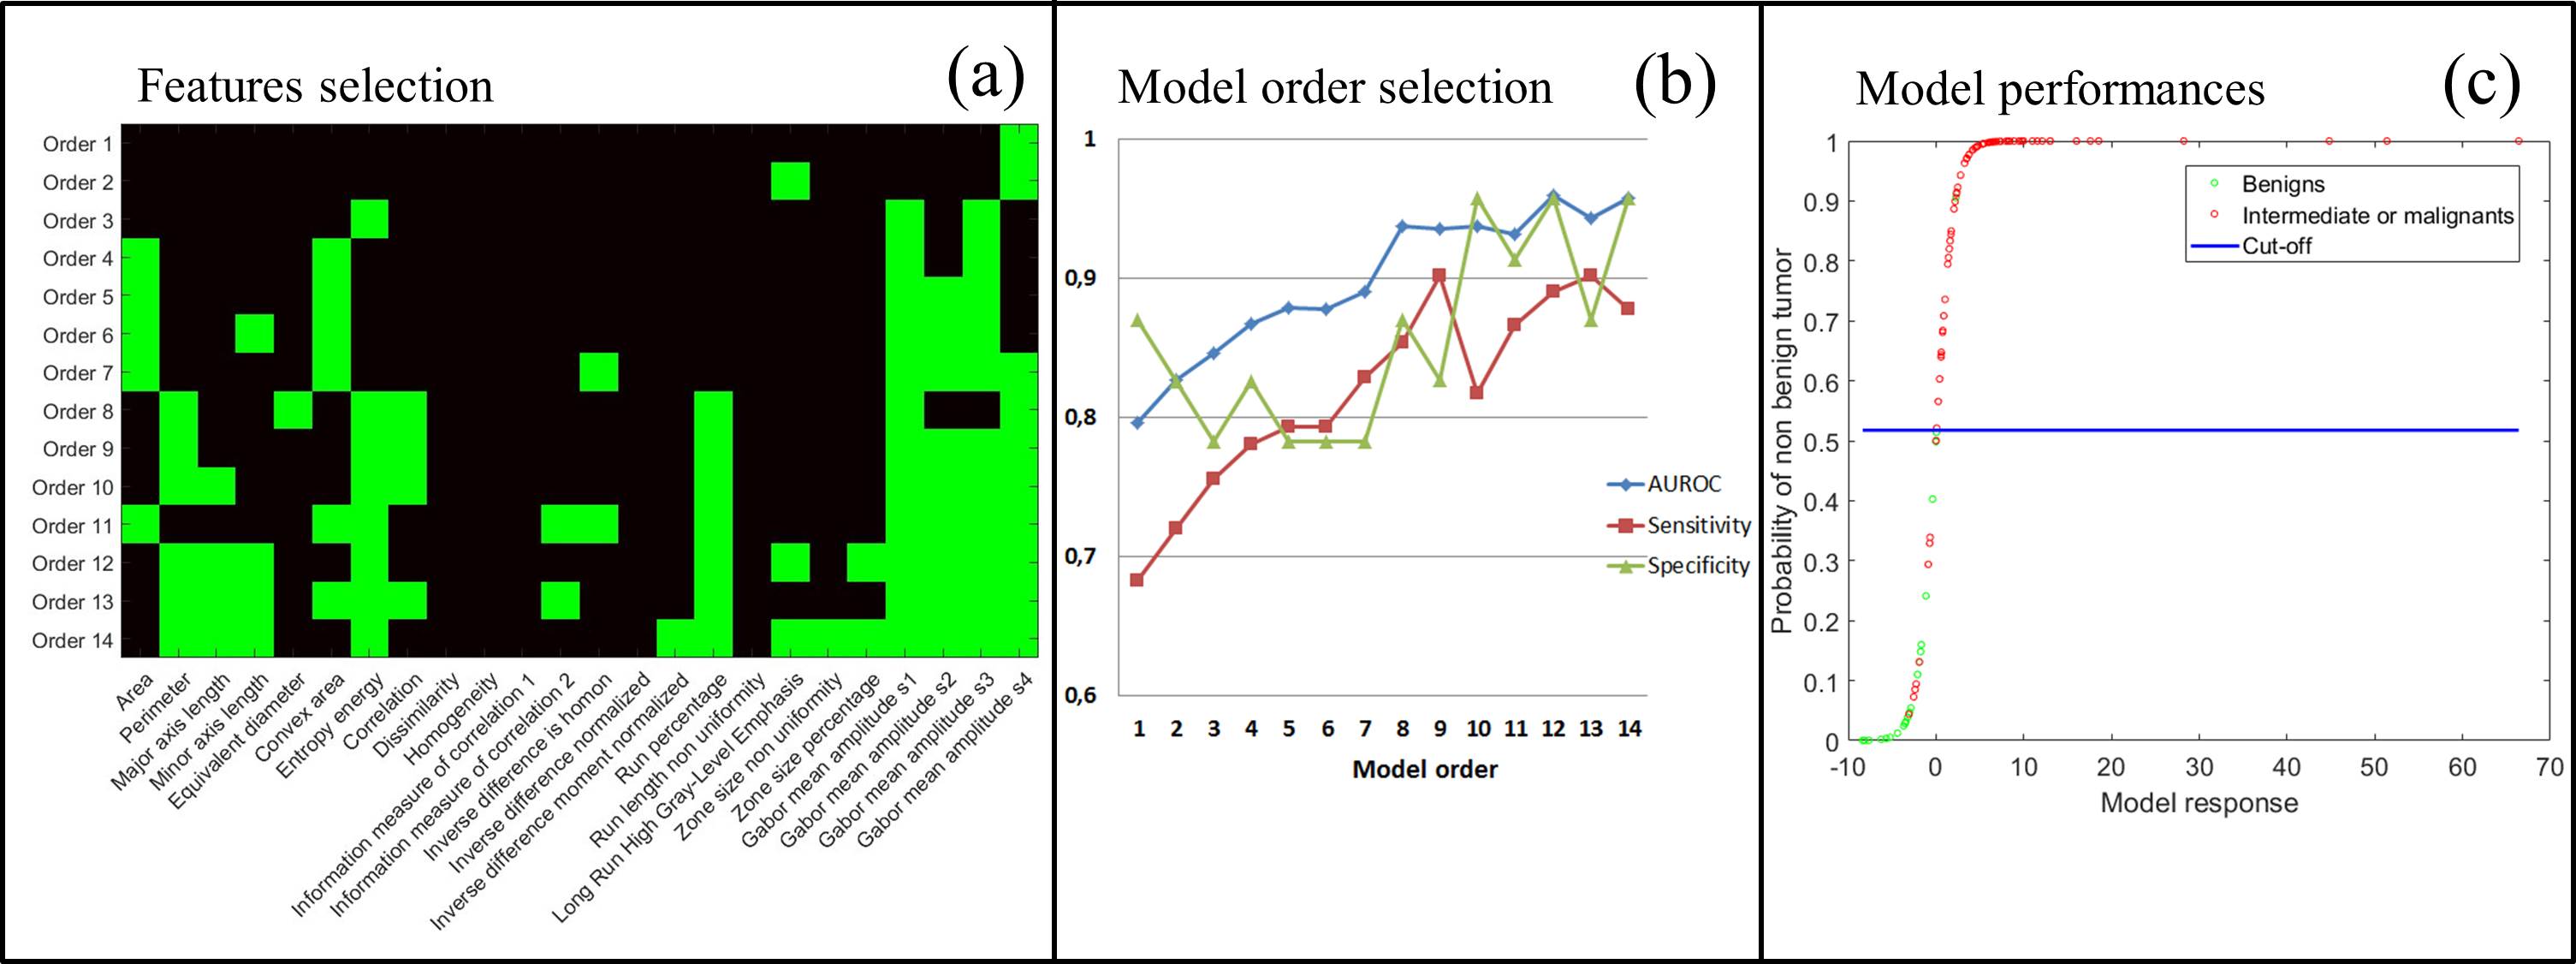
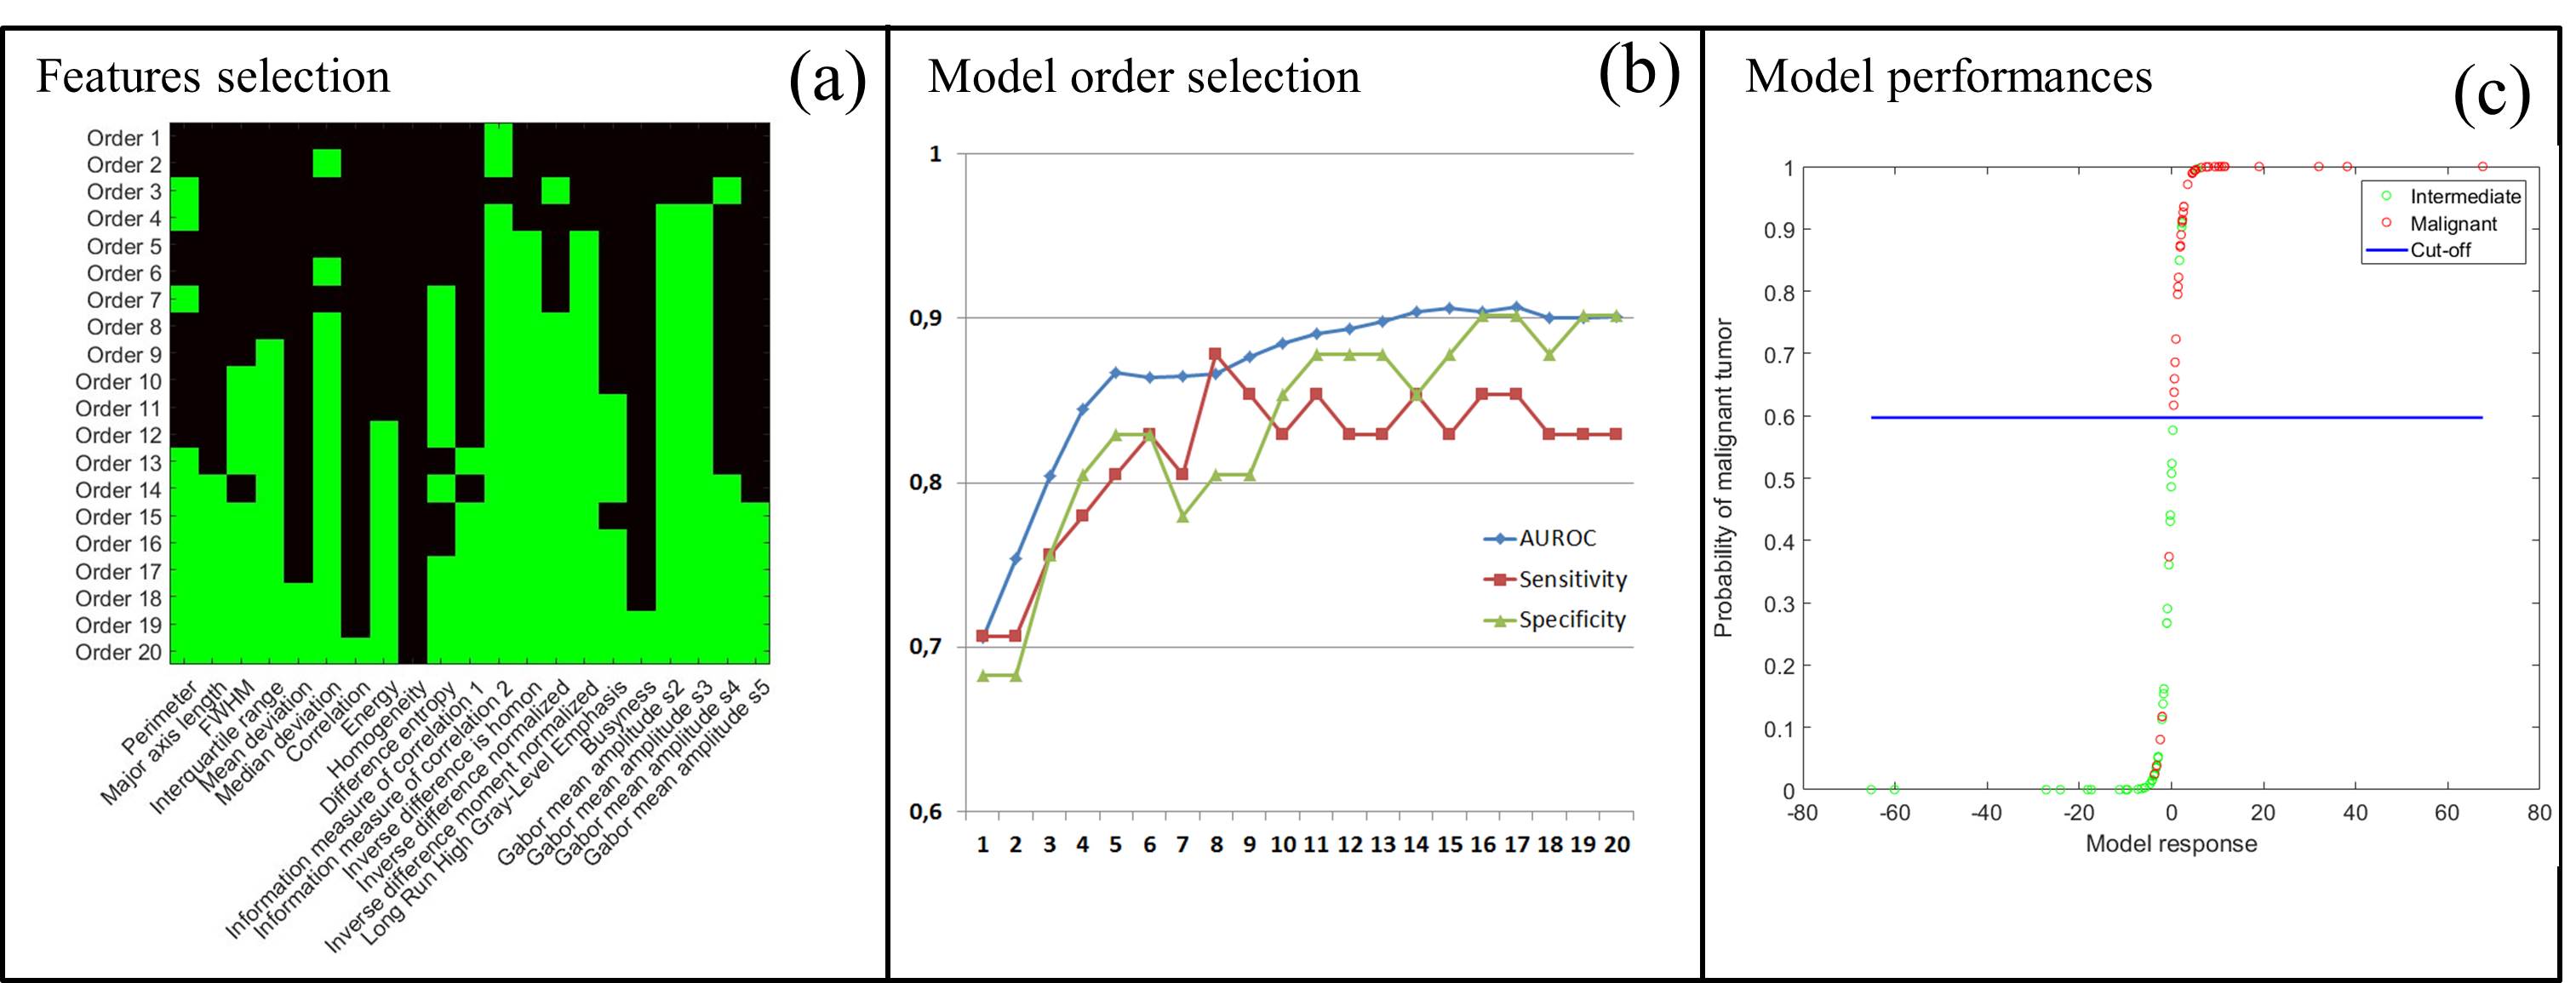
Based on the 0.8 threshold on the Pearson’s correlation coefficient, 55 radiomic features (63.2%) were found to be reproducible enough. To classify between benign and (intermediate + malignant) groups, the radiome was reduced to 24 features and the 12th order model gave the best performance (AUROC = 0.959 (95% CI: 0.921 – 0.996); sensitivity = 89% (95% CI: 80.2 – 94.9%) and specificity = 95.7% (95% CI: 78.1 – 99.9%). To classify between intermediate and malignant groups, the radiome was reduced to 21 features and the 17th order model gave the best diagnosis performances (AUROC = 0.907 (95% CI: 0.844 – 0.970); sensitivity = 85.4% (95% CI: 70.8 – 94.4%) and specificity = 90.2% (95% CI: 76.9 – 97.3%). The detail of optimal features combination and diagnosis performance order-by-order for each model is presented in Fig.2 and Fig.3Discussion
These results show that the evaluation of lipomatous tumor malignancy is feasible using a routinely used MRI acquisition in clinical practice. As suggested by the reproducibility study, the segmentation step may introduce inherent inter-observer variability and this latter need to be taking into account in the data mining. These encouraging results need to be further confirmed on another prospective or existing application cohorts.Acknowledgements
LABEX PRIMES (ANR-11-LABX-0063), program "Investissements d'Avenir" (ANR-11-IDEX-0007).References
(1) Murphey MD, Arcara LK, Fanburg-Smith J: From the archives of the AFIP: imaging of musculoskeletal liposarcoma with radiologic-pathologic correlation. Radiographics 2005; 25:1371-1395.
(2) Murphey MD, Carroll JF, Flemming DJ, Pope TL, Gannon FH, Kransdorf MJ. From the archives of the AFIP: benignmusculoskeletal lipomatous lesions. Radiographics 2004;2 4:1433–1466.
(3) Vallières M, Freeman CR, Skamene SR, El Naqa I. A radiomics model from joint FDG PET and MRI texture features for the prediction of lung metastases in soft-tissue sarcomas of the extremities. Phys. Med. Biol. 2015; 60:5471-5496.
(4) El Naqa I, Suneja G, Lindsay PE et al. Dose response explorer: an integrated open-source tool for exploring and modelling radiotherapy dose-volume outcome relationships. Phys. Med. Biol. 51 5719-5735.
(5) Efron B. and Tibshirani R. Improvements on cross-validation: the 632+ bootstrap method. Journal of the American Statistical Association. 1997; 92:548-556
(6) Sahiner B, Chan H-P, Hadjiiski L. Classifier performance prediction for computer-aided diagnosis using a limited dataset Med. Phys.2008; 35 1559-1570
Figures