1507
MRI biomarkers for focused-ultrasound treatment of pancreatic ductal adenocarcinomaEzekiel Maloney1, Ravneet Vohra1, Yak-Nam Wang1, Tatiana Khokhlova1, Stella Whang1, Kayla Gravelle1, Joshua Park1, JooHa Hwang1, and Donghoon Lee1
1University of Washington, Seattle, WA, United States
Synopsis
Pancreatic cancer is a devastating disease with poor prognosis. Pancreatic tumor therapy has been ineffective in part because pancreatic tumors have high interstitial fluid pressure (IFP), driven by high hyaluronan concentration and a dense desmoplastic stroma that inhibit penetration of drugs into the tumor. We performed multi-parametric MRI at high resolution to non-invasively assess tumor response in a KPC mouse model to pulsed focused ultrasound treatments. T1 and T2 relaxation as well as diffusion, magnetization transfer, and chemical exchange saturation transfer methods were used to characterize the tumors before and after focused ultrasound treatment.
Introduction
Pancreatic cancer is the fourth leading cause of cancer-related deaths in the United States, with 5 year survival rate of 8%.1 Unique features of pancreatic ductal adenocarcinomas (PDAs) include a robust fibroinflammatory stroma as well as a dense extracellular matrix that accumulates water molecules in a poorly mobile, gel-fluid phase.2 In combination, these features result in a high tumor interstitial fluid pressure (IFP; ~99mmHg versus 10.4 in normal pancreas) that collapses tumor vasculature and impedes therapeutic drug delivery.3 Hyaluronan (HA; a naturally occurring glycosaminoglycan) produced by PDA tumor cells is often present at exceedingly high concentrations in the tumor interstitium, and its presence correlates with high tumor IFP.2,4 In a genetic mouse model of PDA (KPC) that is known to closely mimic the progression of the human disease, pulsed focused ultrasound (pFUS) therapy has: 1) disrupted the tumor stroma, 2) improved delivery of chemotherapy to the tumor.3,5 A recent phase 1 clinical trial of pFUS therapy in combination with chemotherapy doubled median overall survival in patients with inoperable PDA versus chemotherapy alone.6 In clinical trials and in clinical practice, both the time and invasiveness required to assess treatment efficacy are critical considerations for the majority of patients with PDA who have rapidly progressive, non-surgical disease in a highly sensitive anatomic area. Our purpose is to implement non-invasive MRI methods to assess FUS treatment effects for PDA.Methods
Tumor bearing, genetically engineered KPC mice were used in combination with multi-parametric MRI at 14T (Paravision 5.1 software, Bruker Corp, Billerica, MA) to assess tumor response to ultrasound-guided pFUS treatments (VIFU 2000 Alpinion Medical Systems; 475 W peak electric power, 1 millisecond pulse duration, 1 Hz, duty cycle 0.1%). These pFUS treatment parameters were previously shown to enhance tumor permeability to chemotherapeutics.3 T1 and T2 relaxation maps, high (126, 180, 234, 340, 549) versus low (7, 47, 81) b-value apparent diffusion coefficient (ADC) maps, magnetization transfer ratio (MTR) maps, and chemical exchange saturation transfer (CEST) maps for the amide proton spectrum (3.5 parts per million or “ppm”) and the glycosaminoglycan (gag) spectrum (0.5-1.5 ppm) were generated and analyzed for 6 animals 48hrs pre-pFUS, and immediately post-pFUS therapy, using ImageJ. Three additional animals underwent the same imaging protocol, but with sham treatment. Animals were sacrificed immediately following post-treatment imaging. The whole-tumor was selected as the region of interest for data analysis and subsequent statistical analysis. Paired t-tests were used to assess statistical significance.Results
Following pFUS treatment of 6 KPC mice, mean tumor T2 relaxation decreased 4.96 milliseconds (ms) (p = 0.02), mean gag CEST decreased 14.69% (p = 7.88*10-7), mean high B-value ADC increased 2.32 x 10⁻³ millimeter(mm)2 / second (s) (p = 0.01), mean MTR increased 21.64% (p = 7.49*10-4), mean amide CEST increased 14.51% (p = 0.02). Treated areas demonstrated predominantly isointense signal on T1 weighted anatomic scans, in some instances with an associated peripheral ring of T1 hypoinense signal. However, overall there was no significant difference in mean tumor T1 relaxation time. Mean unstratified ADC values and mean low B-value ADCs were also not significantly different for pFUS treated animals. In addition, there were no significant differences in any mean parameter values for animals who received sham treatments (Figure 1).Discussion
Variable changes in T1 relaxation, and significantly increased MTR and amide CEST signals post-pFUS-treatment most likely represent sequelae of hyperacute hemorrhage from microcapillary vessels (Figure 2). Significant decreases in gag CEST and T2 relaxation may represent disruption of HA molecules and associated liberation of complexed water molecules from within the tumor stroma. Significant increase in high B-value ADC likely reflects increased diffusivity within the tumor. Animals selected for sham treatments tended to have more diffuse/infiltrative tumor morphologies that were poorly amenable to pFUS treatment (too much overlying bowel gas), while those who received pFUS treatment tended to have larger, focal tumor masses. This systematic difference in tumor morphologies/phenotype likely explains the differing baseline quantitative values for these treatment groups. Histopathologic studies are currently underway for correlation.Conclusion
T2 relaxation, gag CEST, and high B-value ADC maps may provide reliable quantitation of pFUS treatment effects for patients with PDA.Acknowledgements
Dr. Maloney is supported, in part, through a National Institutes of Health, National Research Service Award training grant held by the University of Washington Gastroenterology Division (grant number 5 T32 DK0072).References
- Siegel RL, Miller KD, Jemal A. Cancer Statistics, 2017. CA Cancer J Clin. 2017;67(1):7-30.
- DuFort CC, DelGiorno KE, Carlson MA, Osgood RJ, Zhao C, Huang Z, et al. Interstitial Pressure in Pancreatic Ductal Adenocarcinoma Is Dominated by a Gel-Fluid Phase. Biophys J 2016;110(9):2106-19.
- Li T, Wang YN, Khokhlova TD, D'Andrea S, Starr F, Chen H, et al. Pulsed High-Intensity Focused Ultrasound Enhances Delivery of Doxorubicin in a Preclinical Model of Pancreatic Cancer. Cancer Res 2015;75(18):3738-46.
- Fraser JR, Laurent TC, Laurent UB. Hyaluronan: its nature, distribution, functions and turnover. J Intern Med 1997;242(1):27-33.
- Yu MH, Lee JY, Kim HR, Kim BR, Park EJ, Kim HS, et al. Therapeutic Effects of Microbubbles Added to Combined High-Intensity Focused Ultrasound and Chemotherapy in a Pancreatic Cancer Xenograft Model. Korean J Radiol 2016;17(5):779-88.
- Dimcevski G, Kotopoulis S, Bjanes T, Hoem D, Schjott J, Gjertsen BT, et al. A human clinical trial using ultrasound and microbubbles to enhance gemcitabine treatment of inoperable pancreatic cancer. J Control Release 2016;243:172-81.
Figures
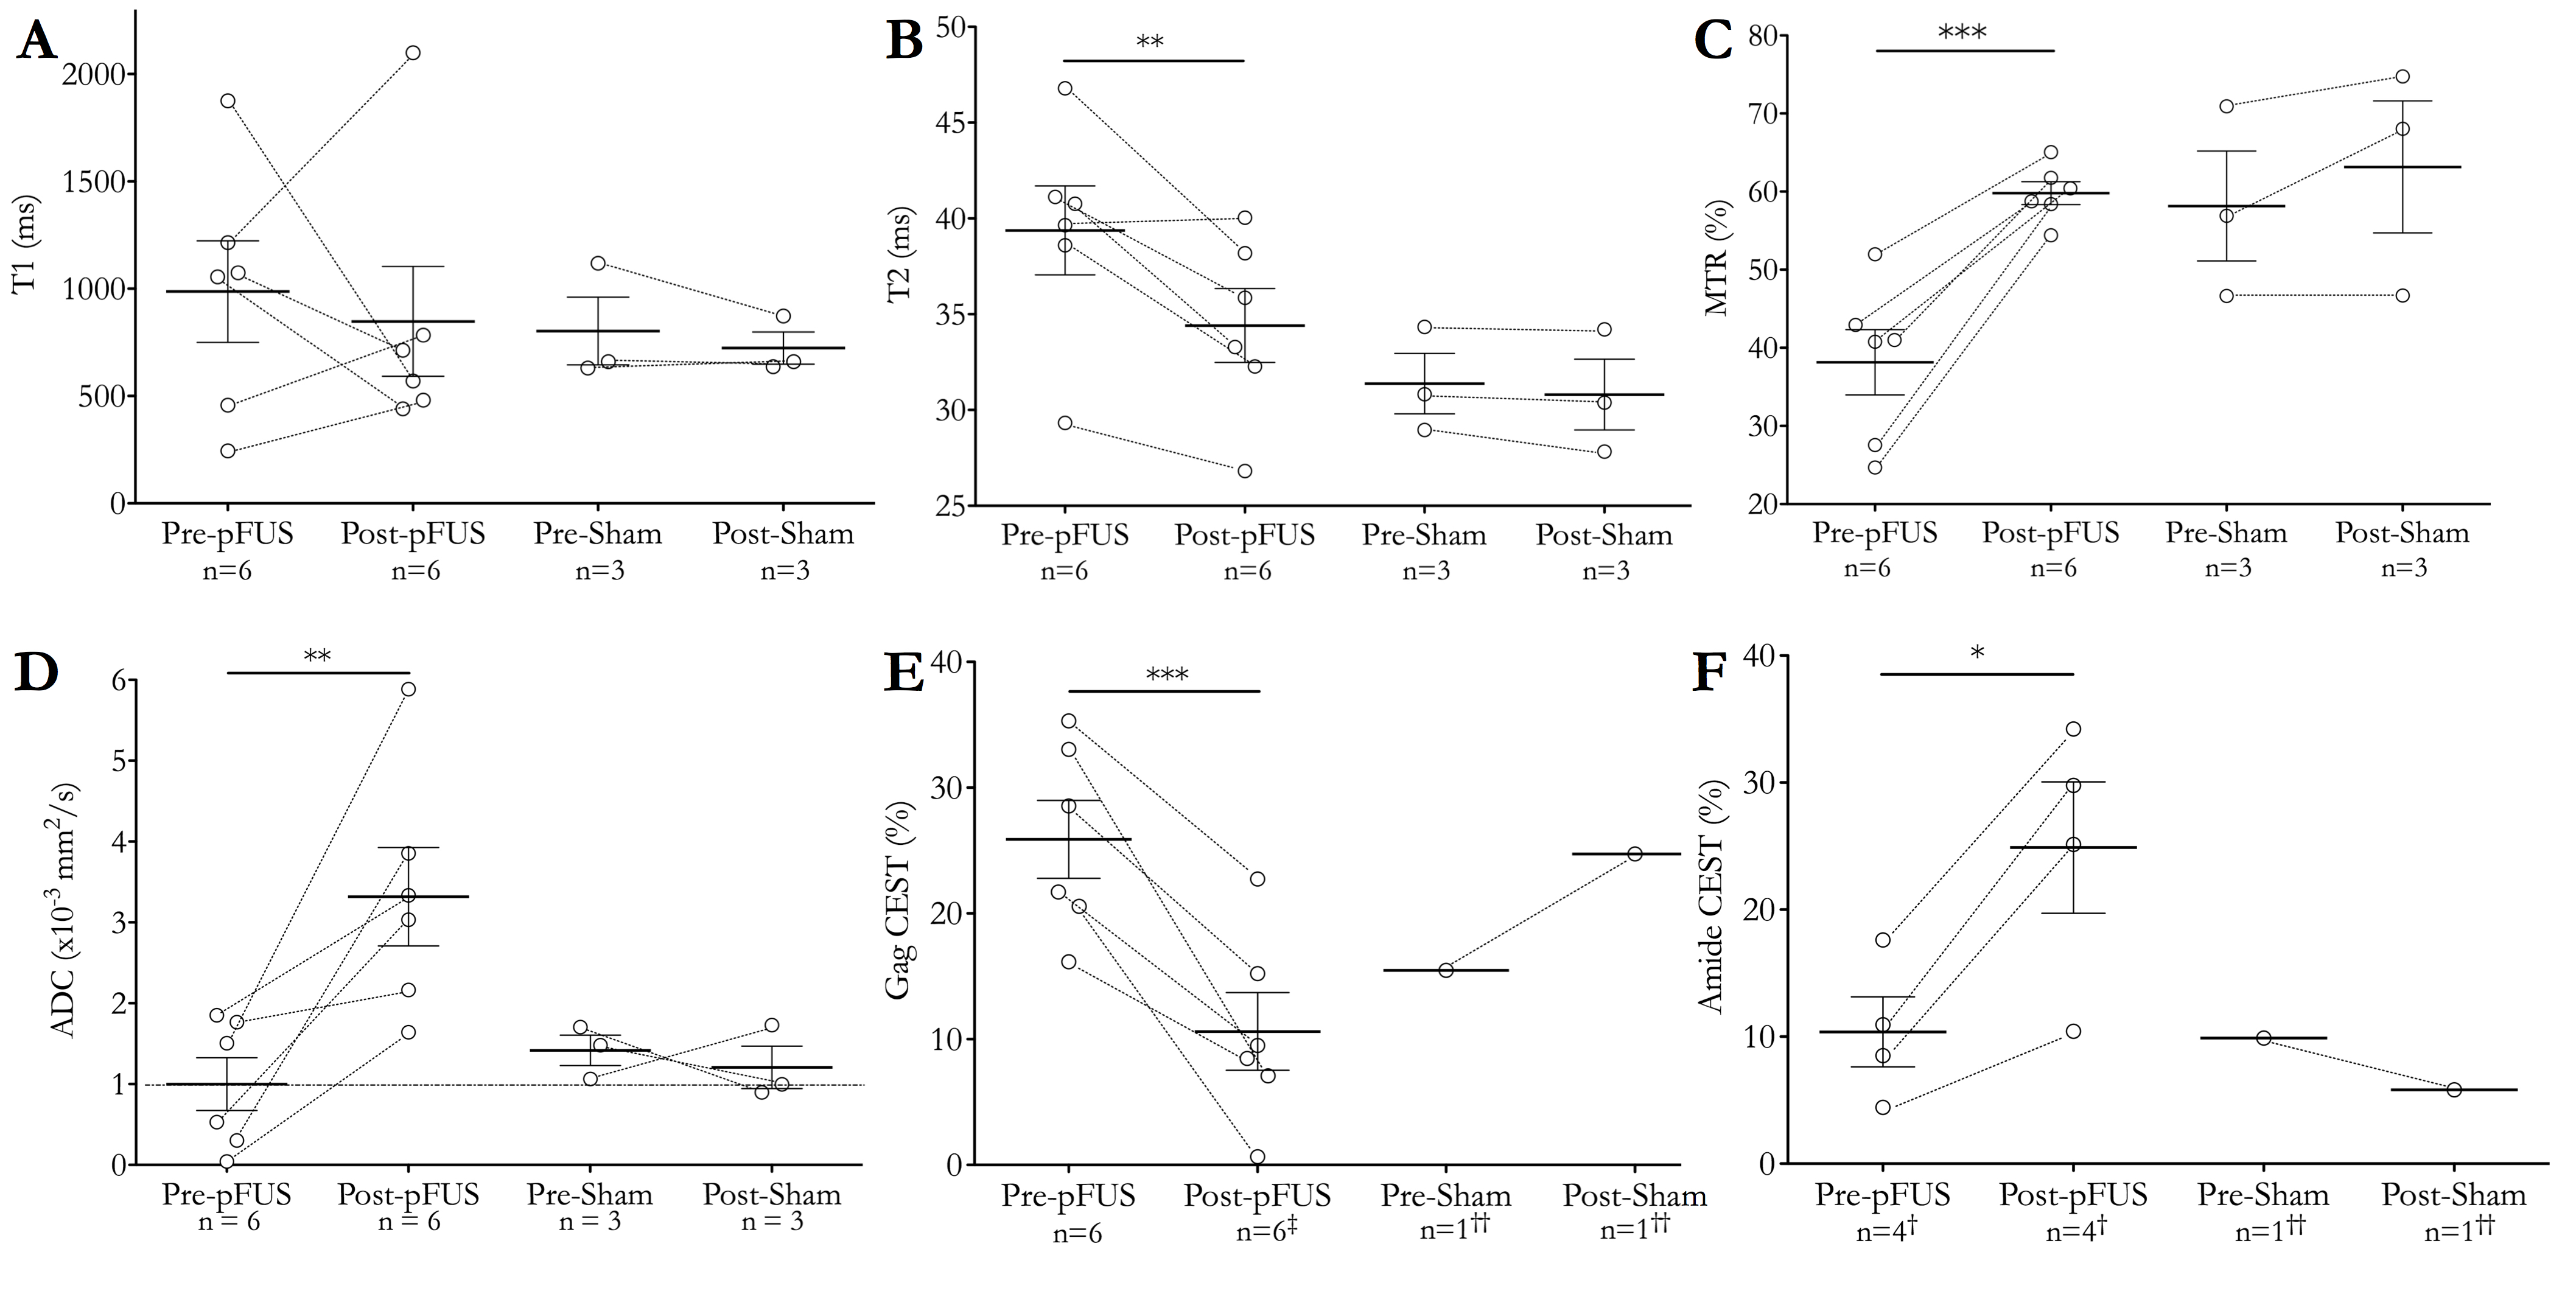
Figure 1 - 14T
MRI of pFUS and sham treatments for KPC mice. (D) The outlier value of 5.9 x 10⁻³
mm2 /s was likely due to higher than normal motion artifact.
Excluding this case, p=0.02. (E) ‡0.5 ppm map had negative values for 1 animal and
was excluded, but 1.0 and 1.5 ppm data was included. (F) †2 animals with motion
degradation were excluded. (E&F) †† 2 animals with motion degradation were
excluded. Solid horizontal lines = group means. Error bars = standard error
from the mean. * Represents p<0.05; ** Represents p<0.01; *** Represents
p<0.001.
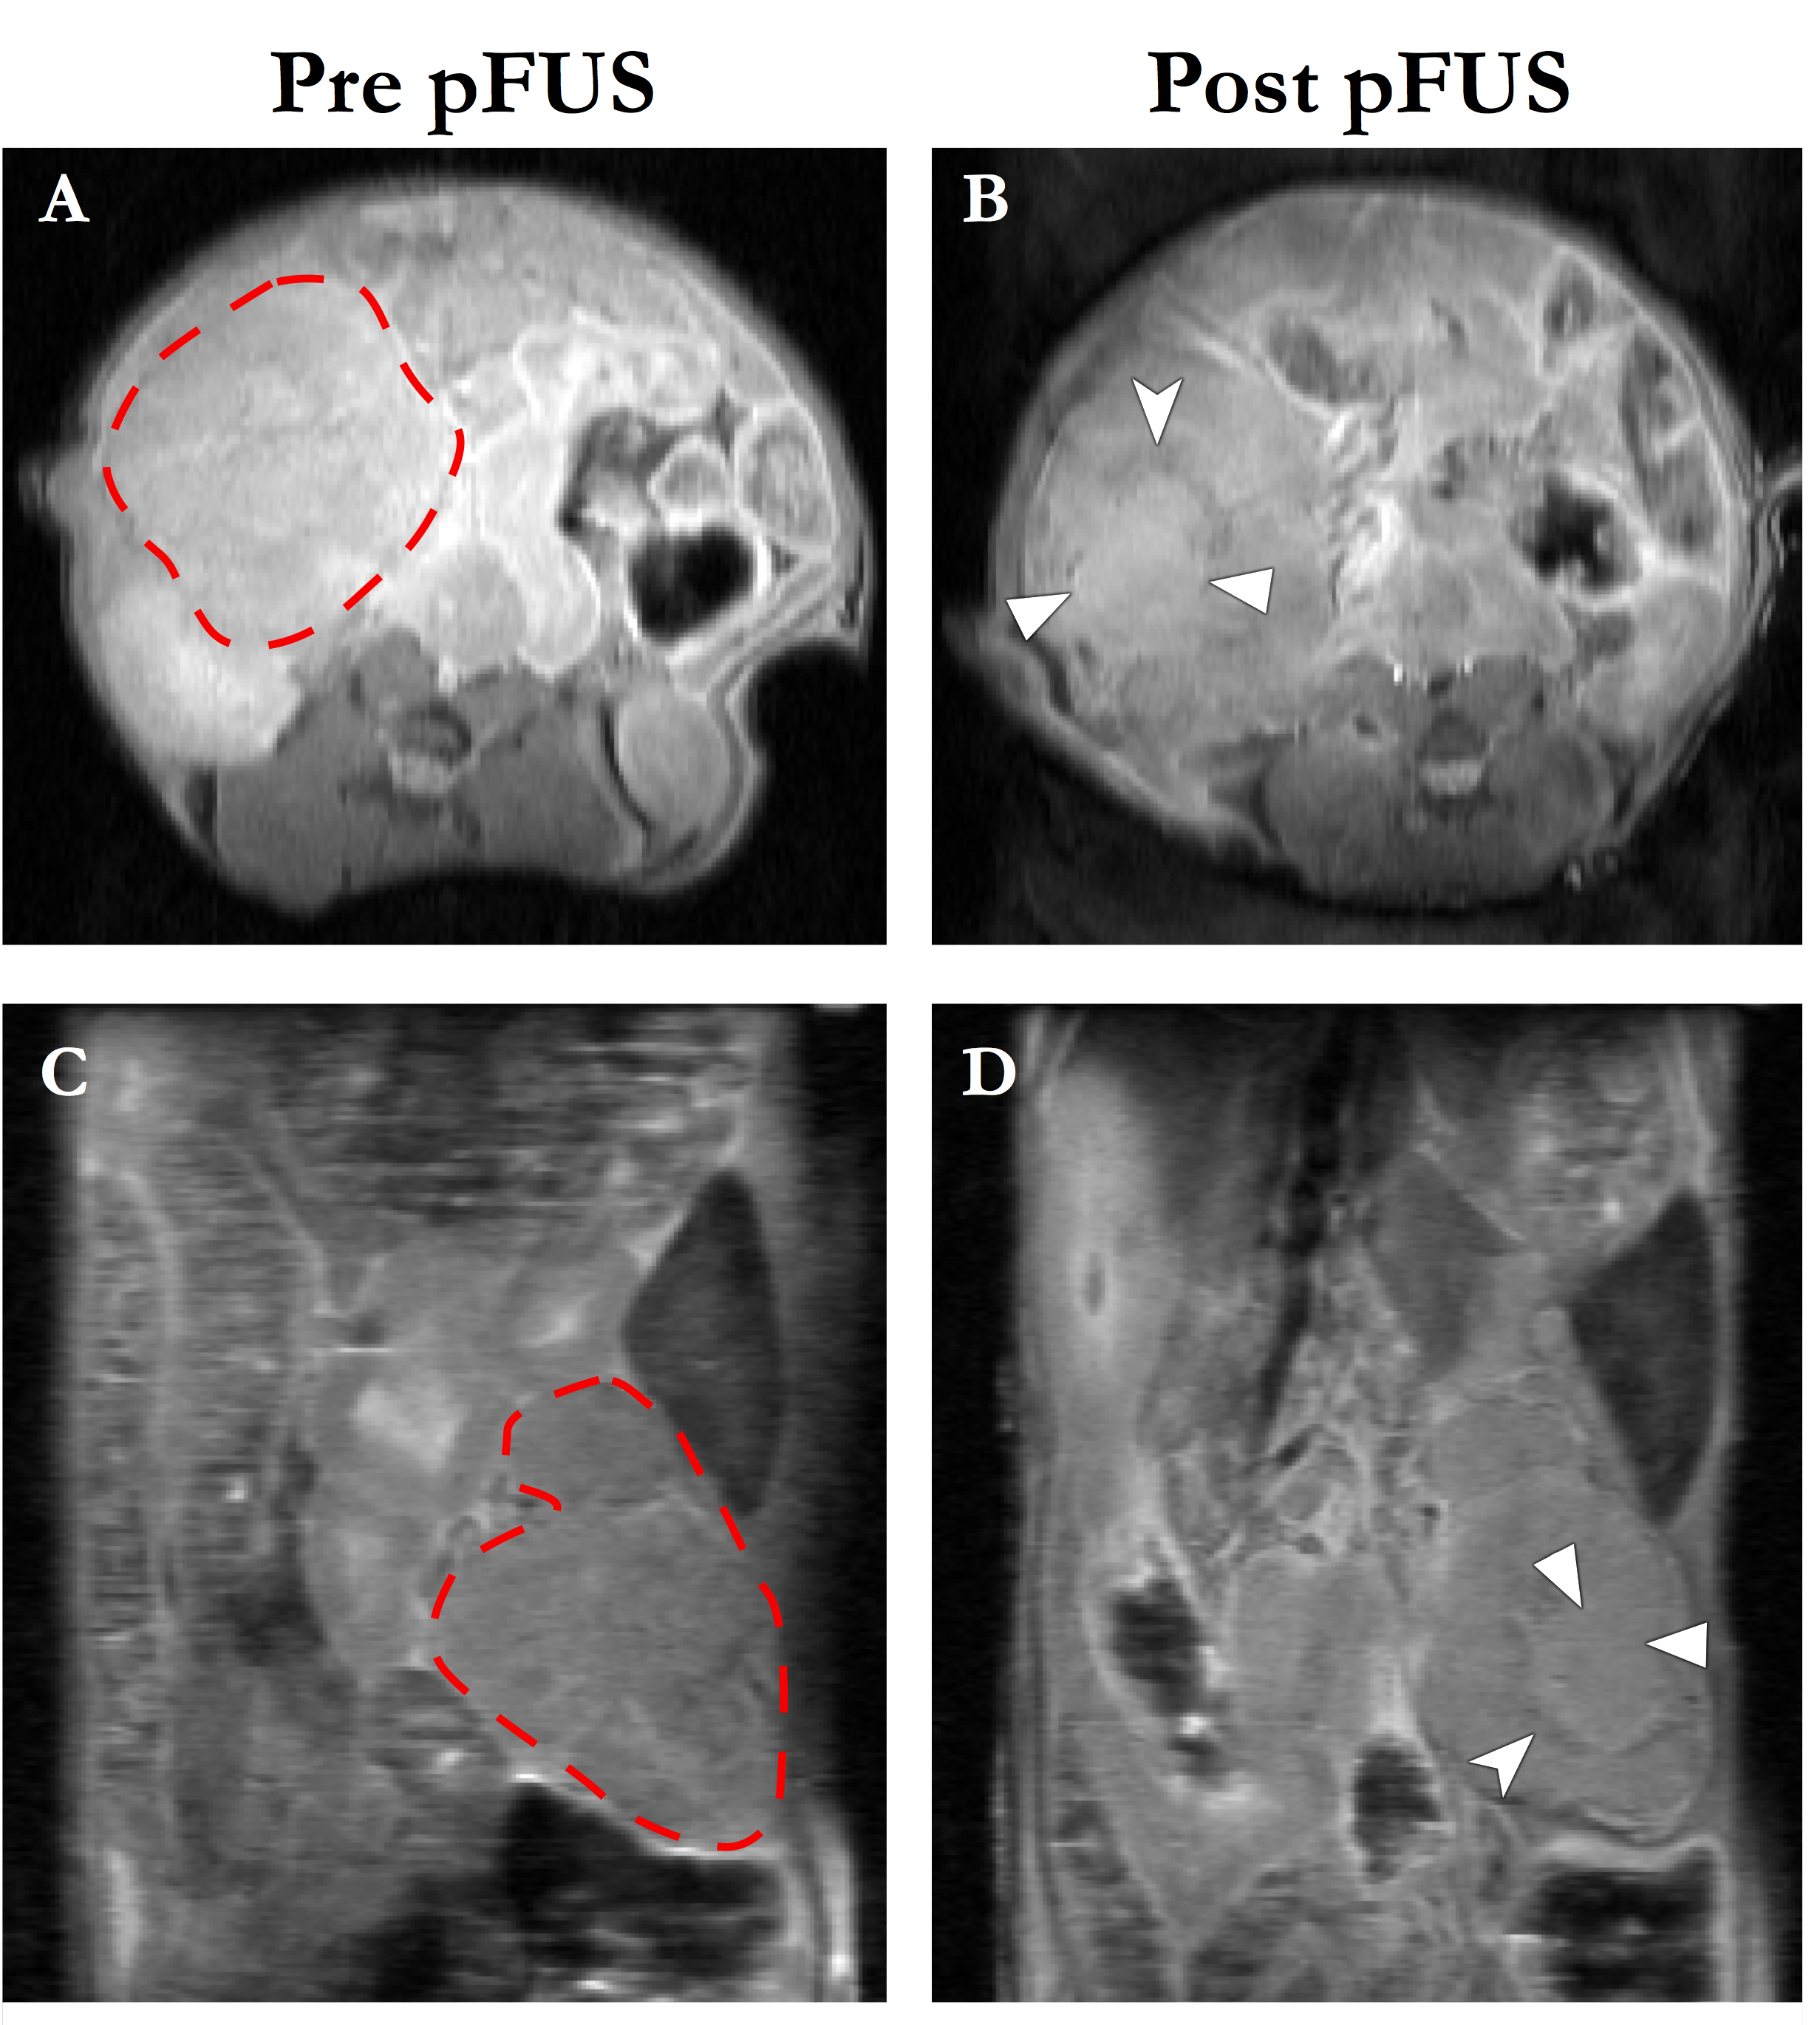
Figure 2 - Representative
axial (A&B) and coronal (C&D) pre- and post-treatment T1W anatomic
images from a KPC mouse. Dashed red lines in A&C demarcate the pancreatic
tumor mass. The treated area demonstrates predominantly isointense T1 signal
(solid arrowheads), with a peripheral ring of T1 hypoinense signal (notched
arrowheads), most likely representing sequelae of hyperacute hemorrhage. pFUS =
pulsed focused ultrasound.