1500
Mechanism of Stable Cavitation Induced Signal Intensity Changes in Fast Spin Echo Images1Department Of Biomedical Engineering And Environmental Sciences, National Tsing Hua University, Hsinchu City, Taiwan, 2Center for Advanced Molecular Imaging and Translation, Chang Gung Memorial Hospital, Taoyuan city, Taiwan, 3Department Of Electrical Engineering, Chang-gung University, Taoyuan city, Taiwan, 4Department Of Physical Medicine And Rehabilitation, National Taiwan University Hospital, Taipei city, Taiwan, 5Division Of Medical Engineering Research, National Health Research Institutes, Miaoli city, Taiwan
Synopsis
The purpose of this study was to comprehend the mechanism of stable cavitation (SC)-induced signal intensity (SI) changes by fast spin-echo images in a phantom with flowing MBs. We postulated that the different patterns of SI changes might be related to transmitting FUS pulses at different timing of k-line acquisitions. The SC-induced microstreaming and shear force could generate hypo- and hyper-SI changes, respectively. In conclusion, the illustration of the mechanism could be helpful for designing experiments in monitoring SC-induced SI changes.
Introduction
Because the disruption of gas-filled microbubbles (MBs) under inertial cavitation can cause hemolysis1, stable cavitation (SC) is a more appropriate scheme to conduct blood-brain barrier (BBB) opening. Previous studies demonstrated that transmitting focused ultrasound (FUS) pulses to MBs in phantom could induce substantial signal intensity (SI) changes in gradient-echo or spin-echo images.2,3 However, the mechanism of SI changes due to SC in a phantom with flowing MBs has not been thoroughly discussed. The purpose of this study was to comprehend the mechanism of SC-induced SI changes by fast spin-echo images.Methods
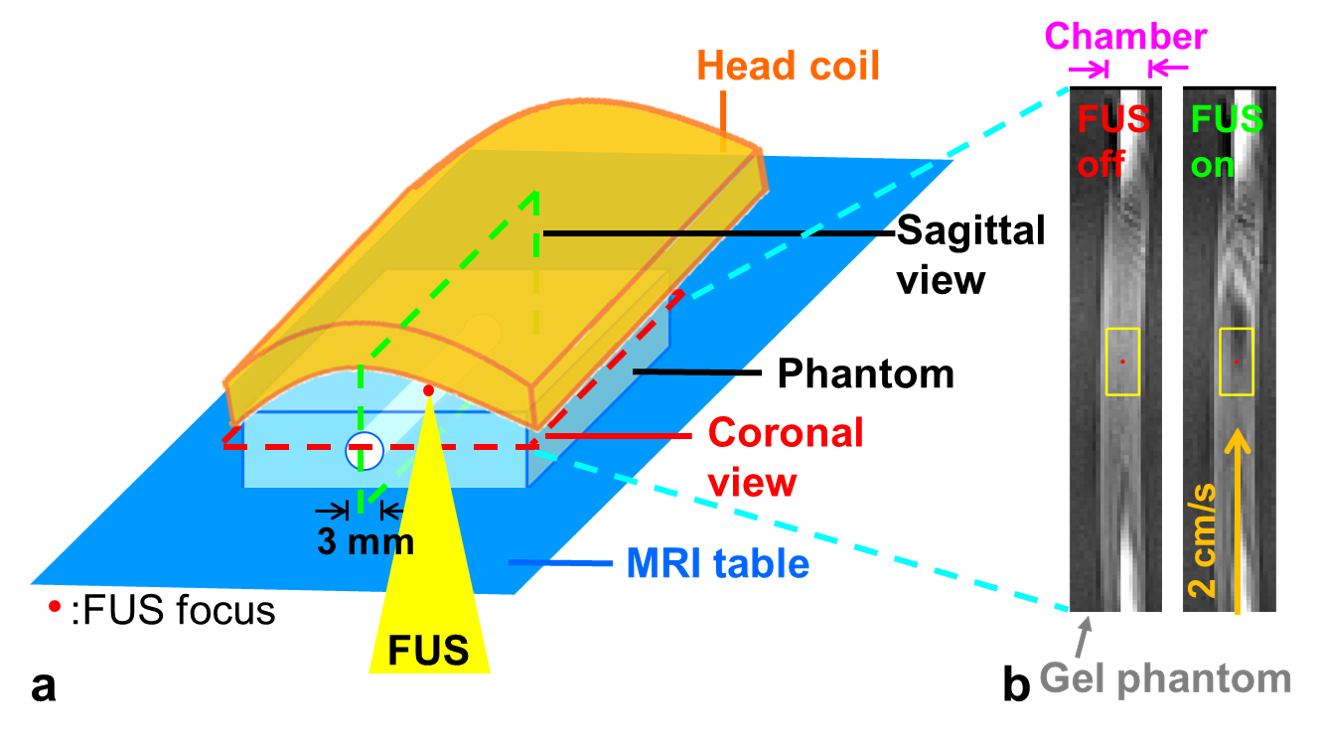
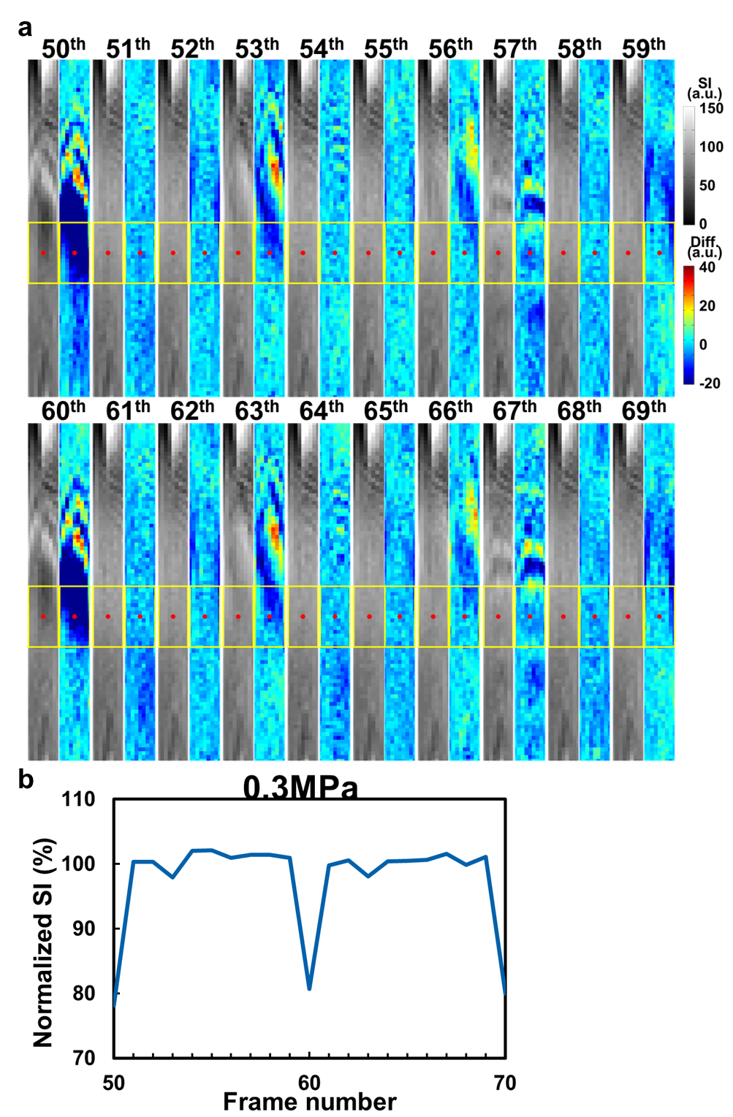
In Figure 1a, 0.1% MBs (lipid shell with C3F8, mean diameters=1.25µm, concentration=(4.36±0.32)×1010 droplets/mL, MRI Bubble, Trust Bio-sonics inc.)4 were injected into a hollow chamber (diameter=3 mm) in an agarose phantom with a constant velocity=2 cm/s. The single-element transducer (RK300, FUS Instruments) transmitted FUS pulses bottom-up to flowing MBs with acoustic pressure=0.3 MPa, pulse repetitive frequency(PRF)=1 Hz, and duty cycle=1%. The half-Fourier acquisition single-shot turbo spin-echo (HASTE) images were acquired in a 7-Tesla MR scanner (ClinScan, Bruker) with parameters as follows: TR/TE=700/29 ms, voxel size=0.27x0.27x1 mm3, temporal resolution=0.7 s, measurements=200 (140 s). To evaluate SI changes, a 3.8x1.9 mm2 rectangular region-of-interesting (ROI) was determined around the FUS focus. The SI within ROI was normalized to mean SI during the pre-FUS period: normalized SI=(SI/SIpre)x100%.Results & Discussion
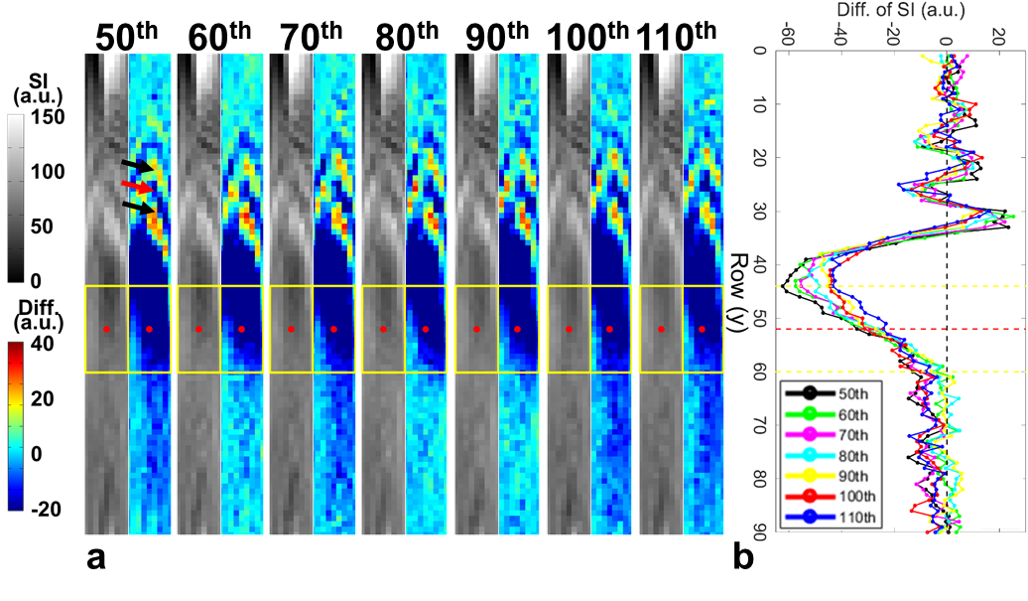
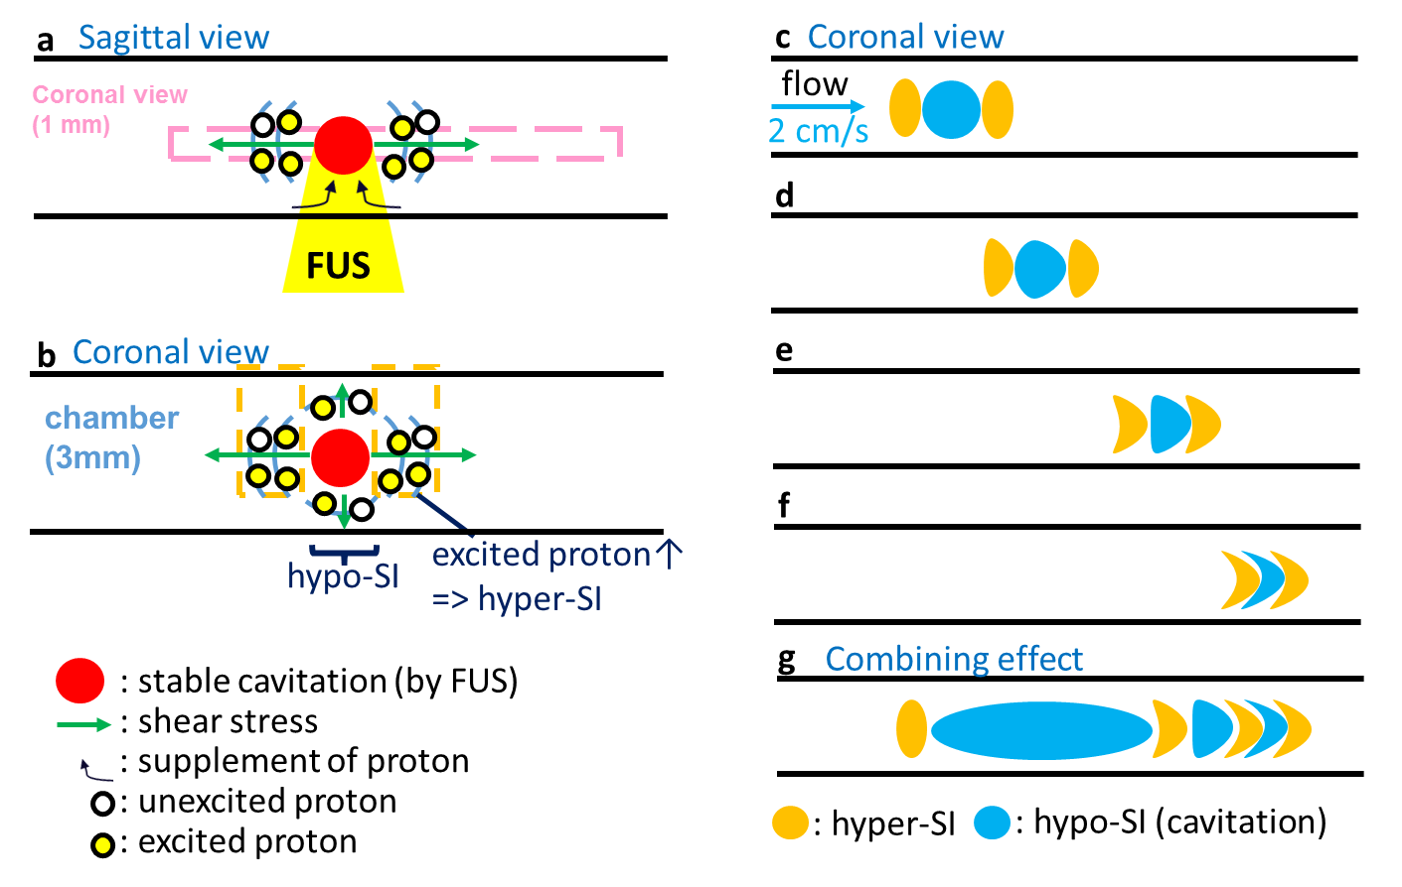
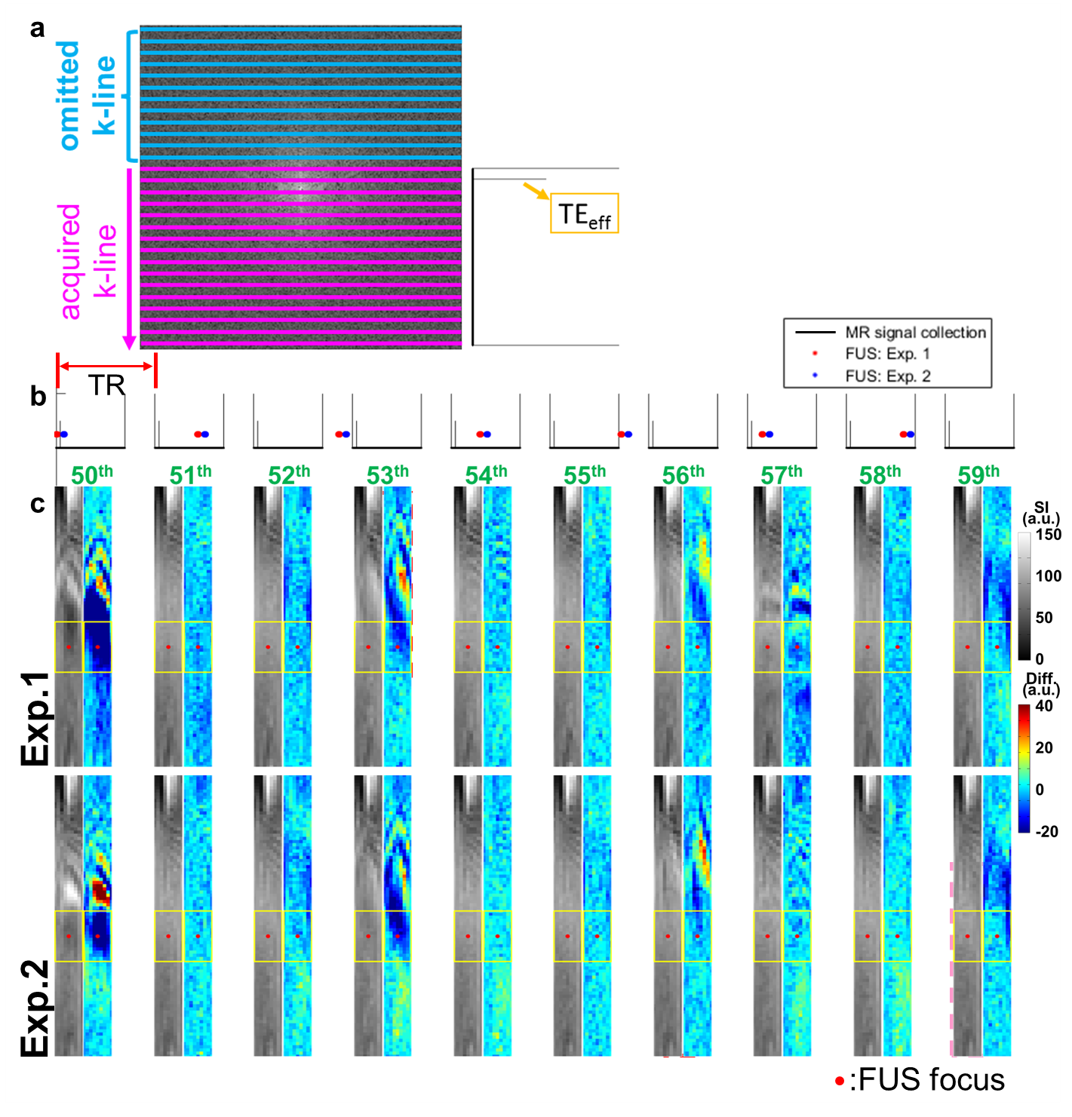
In Figure 1b, substantial SI changes were shown upon transmitting FUS pulses. Figure 2a displays the magnitude images and the pseudo-colored difference images (subtracted from pre-FUS) of 20 sequential frames (50th to 69th). We found that the 50th frame presented similar difference map and quantitative results (Figure 2b) to that of the 60th frame, saying SI changes repeated patterns every 10 frames. Therefore, we postulated that the different patterns of SI changes among the 50th to 69th frames might be related to transmitting FUS pulses at different timing of k-line acquisitions. This repeated pattern maintained while extending the frames to the 110th frame (Figure 3a). The consistency of the quantitative difference of normalized SI along the focus further verified this finding (Figure 3b). We also found that the SI changes downstream to focus exhibited both hyper- and hypo-SI (black and red arrows in Figure 3a) during FUS transmission. A possible mechanism was illustrated in Figure 4. With low-energy FUS exposure, SC-induced microstreaming might lead to intra-voxel dephasing and result in hypo-SI surrounding the focus (Figure 4a). On the other hand, SC-induced microstreaming would also generate a shear stress which pushed the excited protons to surroundings, leading to increased proton density and hyper-SI during a pulse length of FUS (10 ms) (Figure 4b and 4c). In conjugating with the laminar flow effect in chamber, the mass with hypo-SI and hyper-SI would be deformed gradually during acquiring k-lines in a TR (700ms, Figures 4d-4f). The combining effect from Figure 4c to 4f was illustrated in Figure 4g which was similar to the difference map shown in Figure 3a. In this study, we transmitted FUS pulses with PRF=1 Hz and acquired HASTE images with TR=700 ms, indicating that we dyssynchronized the FUS sonication and HASTE acquisition. While transmitting FUS at different timing of k-line acquisition, the SI changes pattern would be different. Figure 5a illustrates the temporal relationship of TE and the acquisitions of k-lines in HASTE images. The effective TE at 29 ms represented the timing of acquiring central k-lines in HASTE images. Figure 5b demonstrates transmitting FUS pulses at different timing of k-lines in two experiments. Experiment 1 (Exp. 1) was set to transmit FUS pulses at an earlier timing than experiment 2 (Exp. 2). Figure 5c illustrates that if transmitting FUS pulses right before the acquisition of central k-lines, it would generate more substantial SI changes (50th, 53rd and 56th). In contrast, if the FUS transmission occurred after effective TE (51st, 54th and 58th) or do not occurred during the acquisition of k-space (52nd, 55th and 59th), only minor SI changes could be observed. On the other hand, similar timing of FUS transmission could generate similar MR images. For example, the timing of the 53rd and 56th frames of Exp. 1 was similar to that of the 56th and 59th frames of Exp. 2, respectively (Figure 5c). Therefore, similar difference maps could be observed in images acquired at similar timing of FUS transmission.Conclusion
In conclusion, we comprehended the mechanism of SC-induced SI changes by HASTE images in a phantom with flowing MBs. The illustration of the mechanism could be helpful for designing experiments in monitoring SC-induced SI changes.Acknowledgements
Center for Advanced Molecular Imaging and Translation, Chang Gung Memorial Hospital, Taoyuan, TaiwanReferences
1. Chen W-S, Brayman AA, Matula TJ, Crum LA, Miller MW. The pulse length-dependence of inertial cavitation dose and hemolysis. Ultrasound in medicine & biology. 2003;29(5):739-48.
2. Lin SC CC, Wu CH, Wang CH, Kang ST, Yeh CK, Chen ES, Peng HH. Real-time monitoring of inertial cavitation effect on diluted microbubbles by MRI. In Proceedings of the 21st Annual Meeting of ISMRM, Salt Lake City, Utah, 2013. 2013:Abstract 1825.
3. Peng HH, Wu CH, Kang ST, Zhang JW, Liu HL, Chen WS, et al. Real‐time monitoring of inertial cavitation effects of microbubbles by using MRI: In vitro experiments. Magnetic resonance in medicine. 2017;77(1):102-11.
4. Fan C-H, Liu H-L, Ting C-Y, Lee Y-H, Huang C-Y, Ma Y-J, et al. Submicron-bubble-enhanced focused ultrasound for blood–brain barrier disruption and improved CNS drug delivery. PloS one. 2014;9(5):e96327.
Figures