1498
Accelerated MR-Thermometry Using Gradient Echo Keyhole for Focused Ultrasound1Radiology and Biomedical Imaging, University of California San Francisco, San Francisco, CA, United States
Synopsis
MRgFUS treatments require rapid imaging to visualize the temperature and accurately determine thermal dose. We propose accelerated gradient echo keyhole trajectories for MR-thermometry, which acquire the middle of k-space densely (keyhole) while interleaving the outer k-space data. The trajectory acquisitions were synchronized to the ultrasound pulse to increase temperature accuracy. Different combinations of the keyhole size and number of interleaves were created and their accuracy was tested in a MATLAB simulation that uses the Bioheat Transfer Equation as a gold standard for temperature. The trajectories were implemented in RTHawk and results validated in a phantom experiment during focused ultrasound.
Purpose
Non-invasive focused ultrasound treatments make it crucial for clinicians to monitor the treatment in real-time to determine if the tissue has been ablated [1]. Temperatures in the focal zone can rise as quickly as 3°C/s and the thermal dose doubles with every 1°C rise in temperature [2]. Thus, temperature estimates need to be acquired at a sufficient frame rate to accurately measure temperature and determine thermal dose. EPI sequences are commonly used for accelerating MR-thermometry sequences, but have a drawback of distortion artifacts [3]. The purpose of this study was to identify parameters for gradient echo keyhole trajectories [4] to under-sample k-space and increase frame rate while still maintaining temperature accuracy by synchronizing the k-space acquisition to the ultrasound pulse for proton resonance frequency (PRF) based thermometry.
Methods
Trajectory design
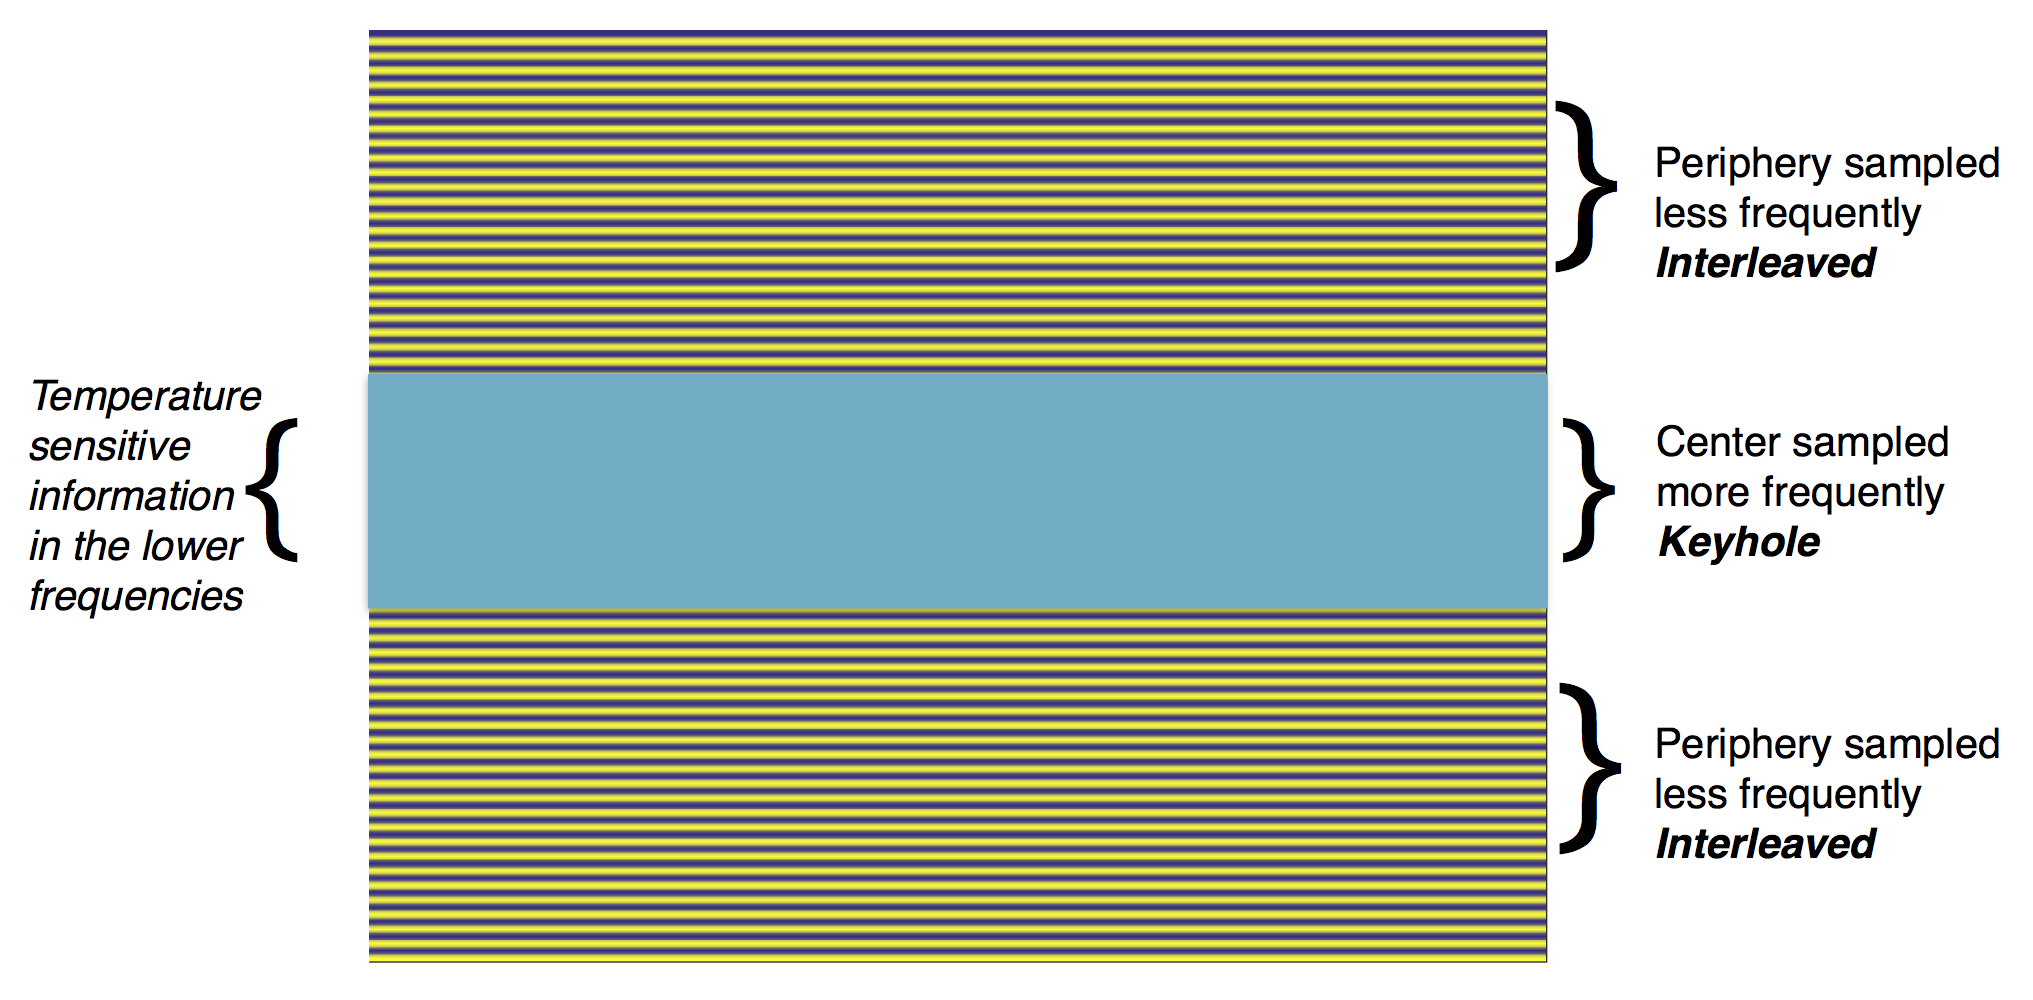
In thermometry applications, the temperature sensitive information is usually contained in the middle of k-space (low-frequency). The key characteristic of keyhole trajectories is that they acquire the low-frequency data densely (keyhole) and the high frequency data sparsely (interleaves). The under-sampling was done in the phase-encode direction by varying the keyhole size and outer k-space data in an interleaved fashion. Figure 1 shows an example of two interleaves with 32 keyhole lines: The blue keyhole is updated in every frame, the purple (odd) lines are updated in every odd frame, and the yellow (even) lines in every even frame. This combination results in an 1.66x acceleration and the full k-space is updated every 2 frames.
Simulations based on Pennes Bioheat Transfer Equation (BHTE)
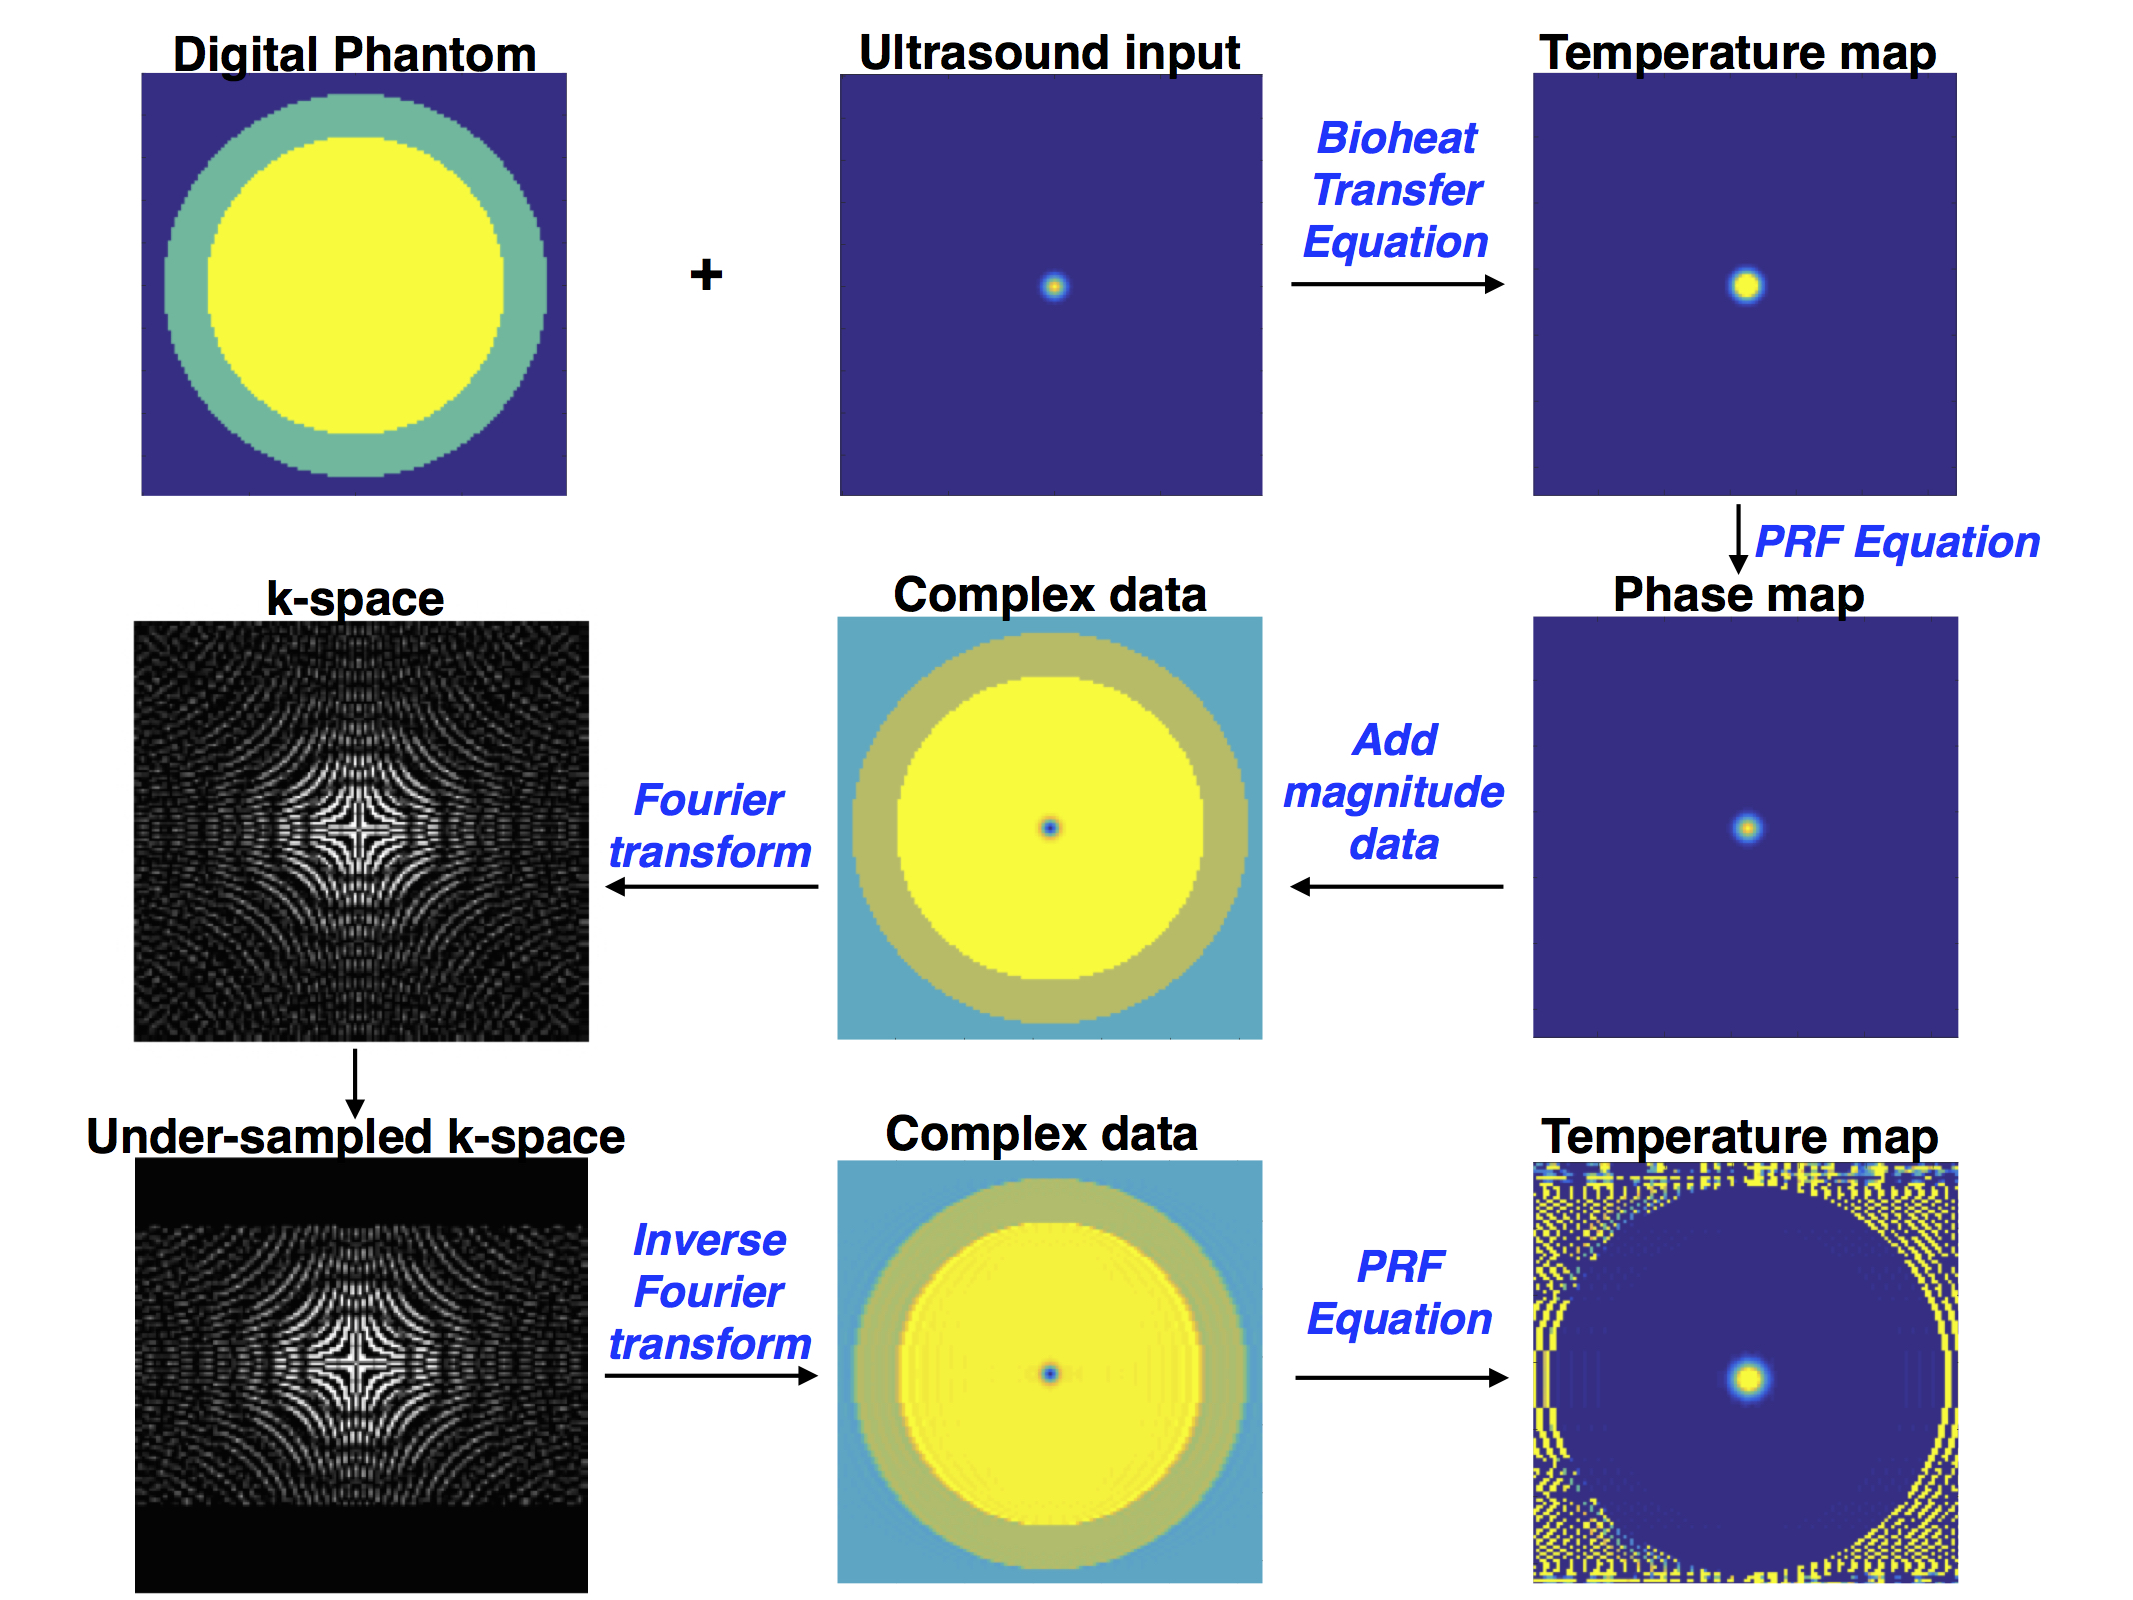
A digital 2-D phantom (courtesy Dr. William Grissom, Vanderbilt University) with specified acoustic properties was implemented in MATLAB (MathWorks, Natick, MA). Time-temperature curves were generated using the BHTE for given ultrasound parameters. Temperatures were calculated using the simulated under-sampled k-space data (Fig. 2). The difference between the maximum temperature within the phantom as predicted by the BHTE and that obtained by the scan simulation was used to measure the accuracy of the various under-sampling schemes (the BHTE was used as a theoretical gold standard). For under-sampling, keyhole size was varied from 1-128 and number of interleaves ran from 2-7. Based on the assumption that the low spatial frequencies contain the temperature sensitive information, the acquisition was synchronized to the pulse by ending the sonication at the center of k-space. Data was acquired in sequential (top-bottom), center-in (high frequency first) and center-out (low frequency first) patterns. The sonication lengths were long (30 s) and short (3 s).
Phantom experiment
RTHawk (HeartVista, Menlo Park, CA) was used for real-time imaging on a 3T scanner (GE Healthcare, Waukesha, WI) by creating a thermometry pipeline that allows custom built trajectories. Axial and coronal views of a soft tissue-mimicking phantom were acquired for a 30 s sonication (TE/TR=13.4/28.5 ms, 256x128 matrix, FOV=24 cm). For this experiment, the data was retrospectively under-sampled by varying the number of central k-space lines used for reconstruction (32, 64, 100) and compared to the fully sampled acquisition (128).
Results and Discussion
BHTE simulation
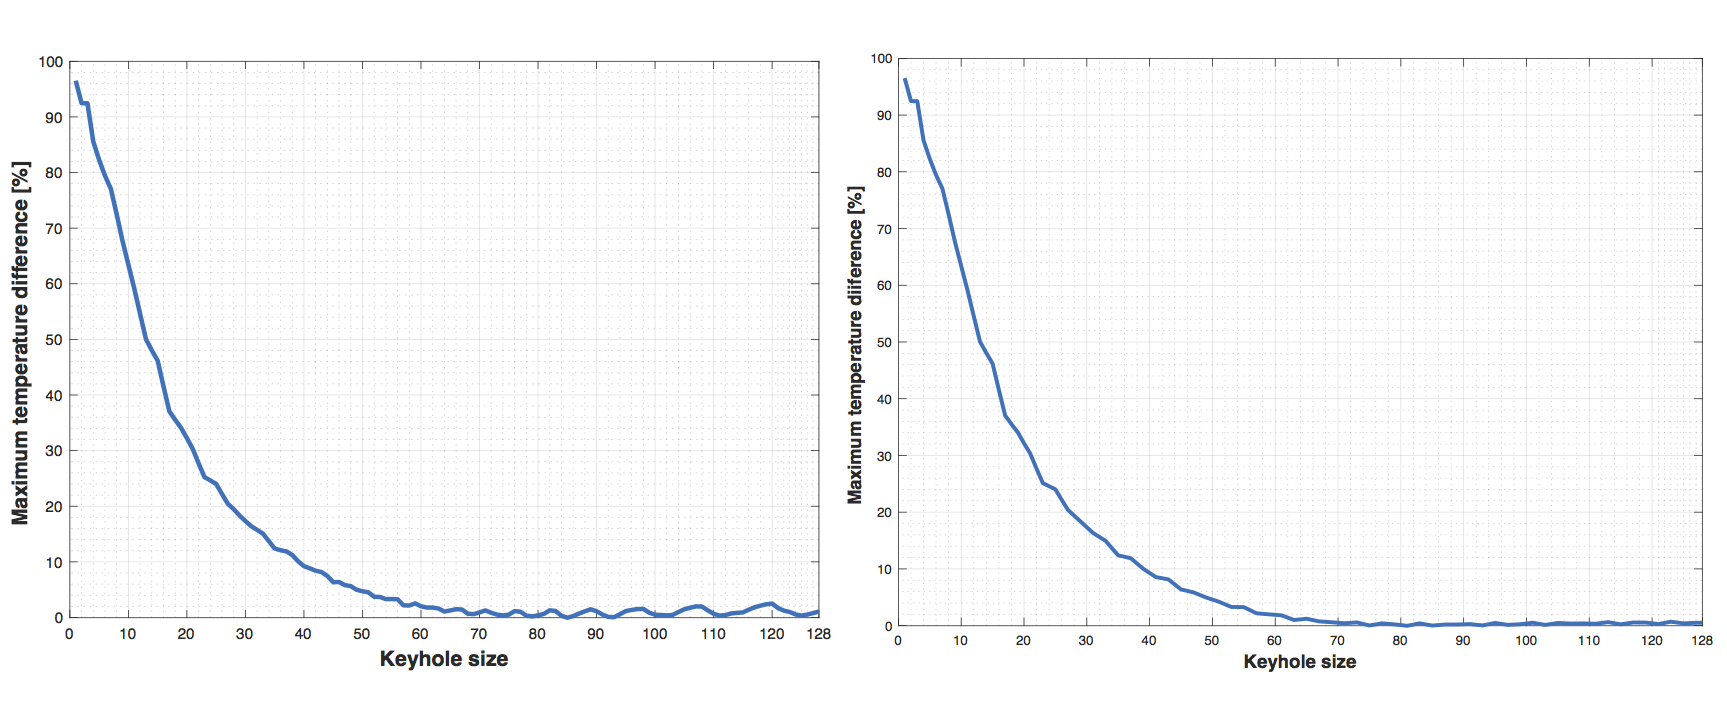
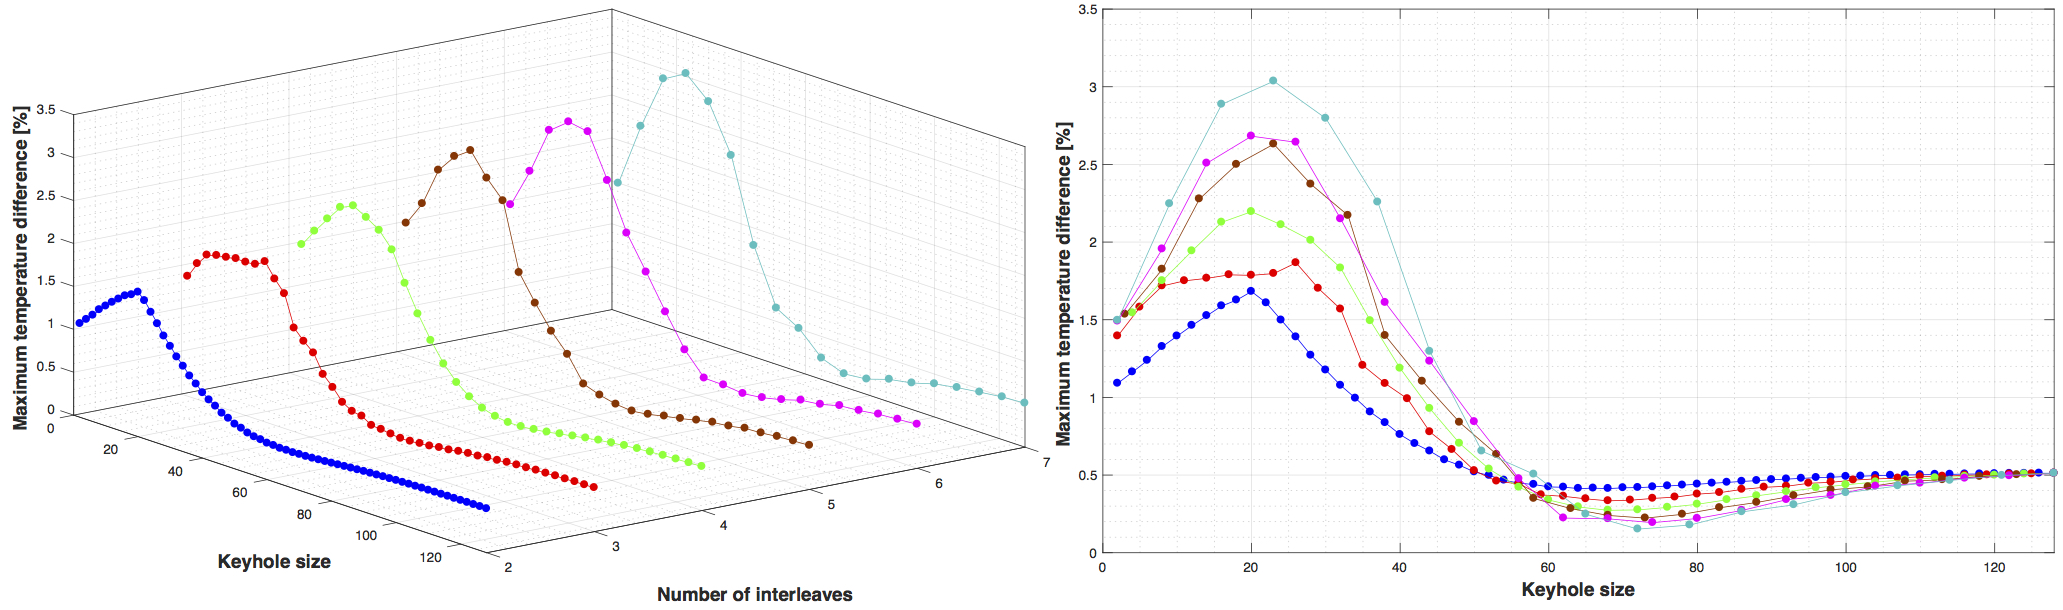
Figure 3 shows the accuracy of using just the keyhole lines for a synchronized, sequential acquisition (30 s sonication) compared to an unsynchronized acquisition. Figure 4 shows the efficiency of combining the keyhole data with the outer, interleaved data. Different schemes have varying accuracies based on the sonication length. For example, for 58 keyhole with 7 interleaves the temperature difference is 0.39% and 8.43% at 30 s and 3 s respectively. For 3 s sonications, acquiring only the low-frequency data (70 lines) results in 1.39% difference in temperature prediction. For 30 s sonications, using 63 keyhole with 5 interleaves provides an acceleration of 1.68x and 0.40% temperature prediction difference.
Phantom experiment
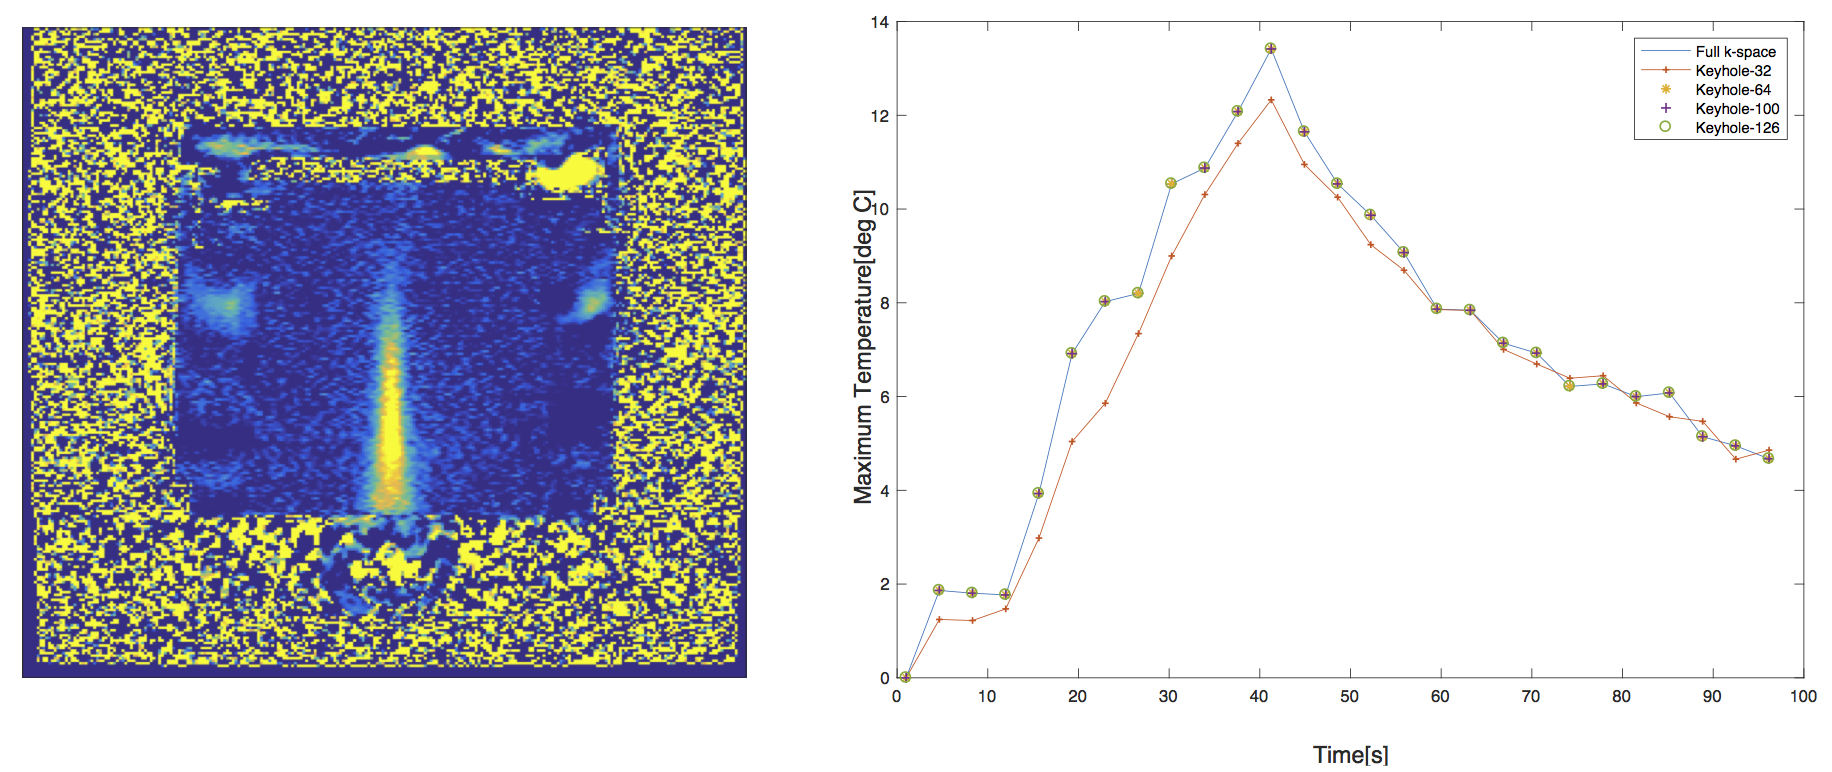
Figure 5 shows the time-temperature curves of the phantom created by using different keyhole sizes as compared to a fully-sampled k-space. Compared to the full k-space, refreshing the middle 32 lines underestimates the temperature, but using 64, 100,126 lines do as well as using all 128 lines. This experiment showed that using only central k-space lines provides accurate temperature measurements, agreeing with the results from the simulation (Fig. 3).
Conclusion
In these proposed trajectories, each line of k-space is acquired within one TR, eliminating distortion artifacts as seen in EPI. Synchronizing the pulse to the acquisition increases temperature accuracy. Sequential acquisition performs better than other acquisition patterns. An in-vivo validation study should be performed to test the feasibility of these under-sampled trajectories in soft tissue. Overall, it can be seen that the keyhole approach is promising to achieve accurate temperature measurements while providing a higher frame rate.Acknowledgements
I would like to thank Dr. William Grissom (Vanderbilt University Institute of Imaging Science) who was willing to share his code with me which helped me get started on building this simulation.References
1. Todd N, Vyas U, Bever JD, Payne A, and Parker DL. The effects of spatial sampling choices on MR temperature measurements. Magnetic resonance in medicine, 65(2):515–521, 2011.
2. Todd N, Payne A, and Parker DL. Model predictive filtering for improved temporal resolution in MRI temperature imaging. Magnetic resonance in medicine, 63(5):1269–1279, 2010.
3. Zaitsev M, Zilles K, and Shah NJ. Shared k-space echo planar imaging with keyhole. Magnetic resonance in medicine, 45(1):109–117, 2001.
4. Ozhinsky E, Salgaonkar V, Diederich CJ, and Rieke V. MR Thermometry-guided Ultrasound Hyperthermia of User-Defined Regions Using the ExAblate Prostate Ablation Array. In: Proceedings of the 25th International Society of Magnetic Resonance in Medicine; 2017; Apr 21-26; Honolulu, HI. ISMRM; 2017. Abstract nr 5429.
5. Rieke V and Pauly KB. MR thermometry. Journal of magnetic resonance imaging, 27(2):376–390, 2008.
6. Pennes HH. Analysis of tissue and arterial blood temperatures in the resting human forearm. Journal of applied physiology, 1(2):93–122, 1948.
Figures