1494
Hybrid Proton Resonance Frequency Shift and Variable Flip Angle T1 Temperature Mapping using a Golden-Angle 3D Stack-of-Radial Technique1Radiological Sciences, University of California Los Angeles, Los Angeles, CA, United States, 2Physics and Biology in Medicine, University of California Los Angeles, Los Angeles, CA, United States, 3Urology, University of California Los Angeles, Los Angeles, CA, United States, 4Bioengineering, University of California Los Angeles, Los Angeles, CA, United States
Synopsis
Proton resonance frequency shift (PRF) is widely used for MR temperature mapping, but is not applicable in adipose tissues. T1 measurement is an alternative MR temperature mapping method that can be applied in adipose tissues. Combined PRF-T1 mapping has been evaluated for Cartesian MRI, but there is a lack of research for non-Cartesian techniques. In this work, we propose a new multi-echo 3D stack-of-radial technique that combines PRF and variable-flip-angle T1 measurement for MR temperature mapping. Preliminary results from laser ablation in phantoms demonstrate good agreement between temperature derived from both PRF and T1 compared to readings of temperature probes.
Introduction
Proton resonance frequency shift (PRF) is a widely used method for MR temperature mapping. However, PRF fails in adipose tissue due to the absence of hydrogen bonds. Alternatively, T1 relaxation time has been used to measure temperature in adipose tissues using variable flip-angle (VFA) gradient-recalled echo (GRE) imaging. Combined PRF-T1 methods have been investigated for Cartesian sampling1,2, but there is a lack of research for non-Cartesian sampling. Non-Cartesian sampling schemes such as golden-angle 3D stack-of-radial offer inherent robustness to motion and potential for accelerating acquisition speed3. In this abstract, we propose a new golden-angle 3D stack-of-radial MRI technique that combines PRF and VFA T1 measurement for temperature mapping. Proof-of-concept phantom ablation experiments are presented to evaluate the feasibility and accuracy of this new method.
Methods
Hybrid PRF-T1 3D Stack-of-Radial Temperature Mapping
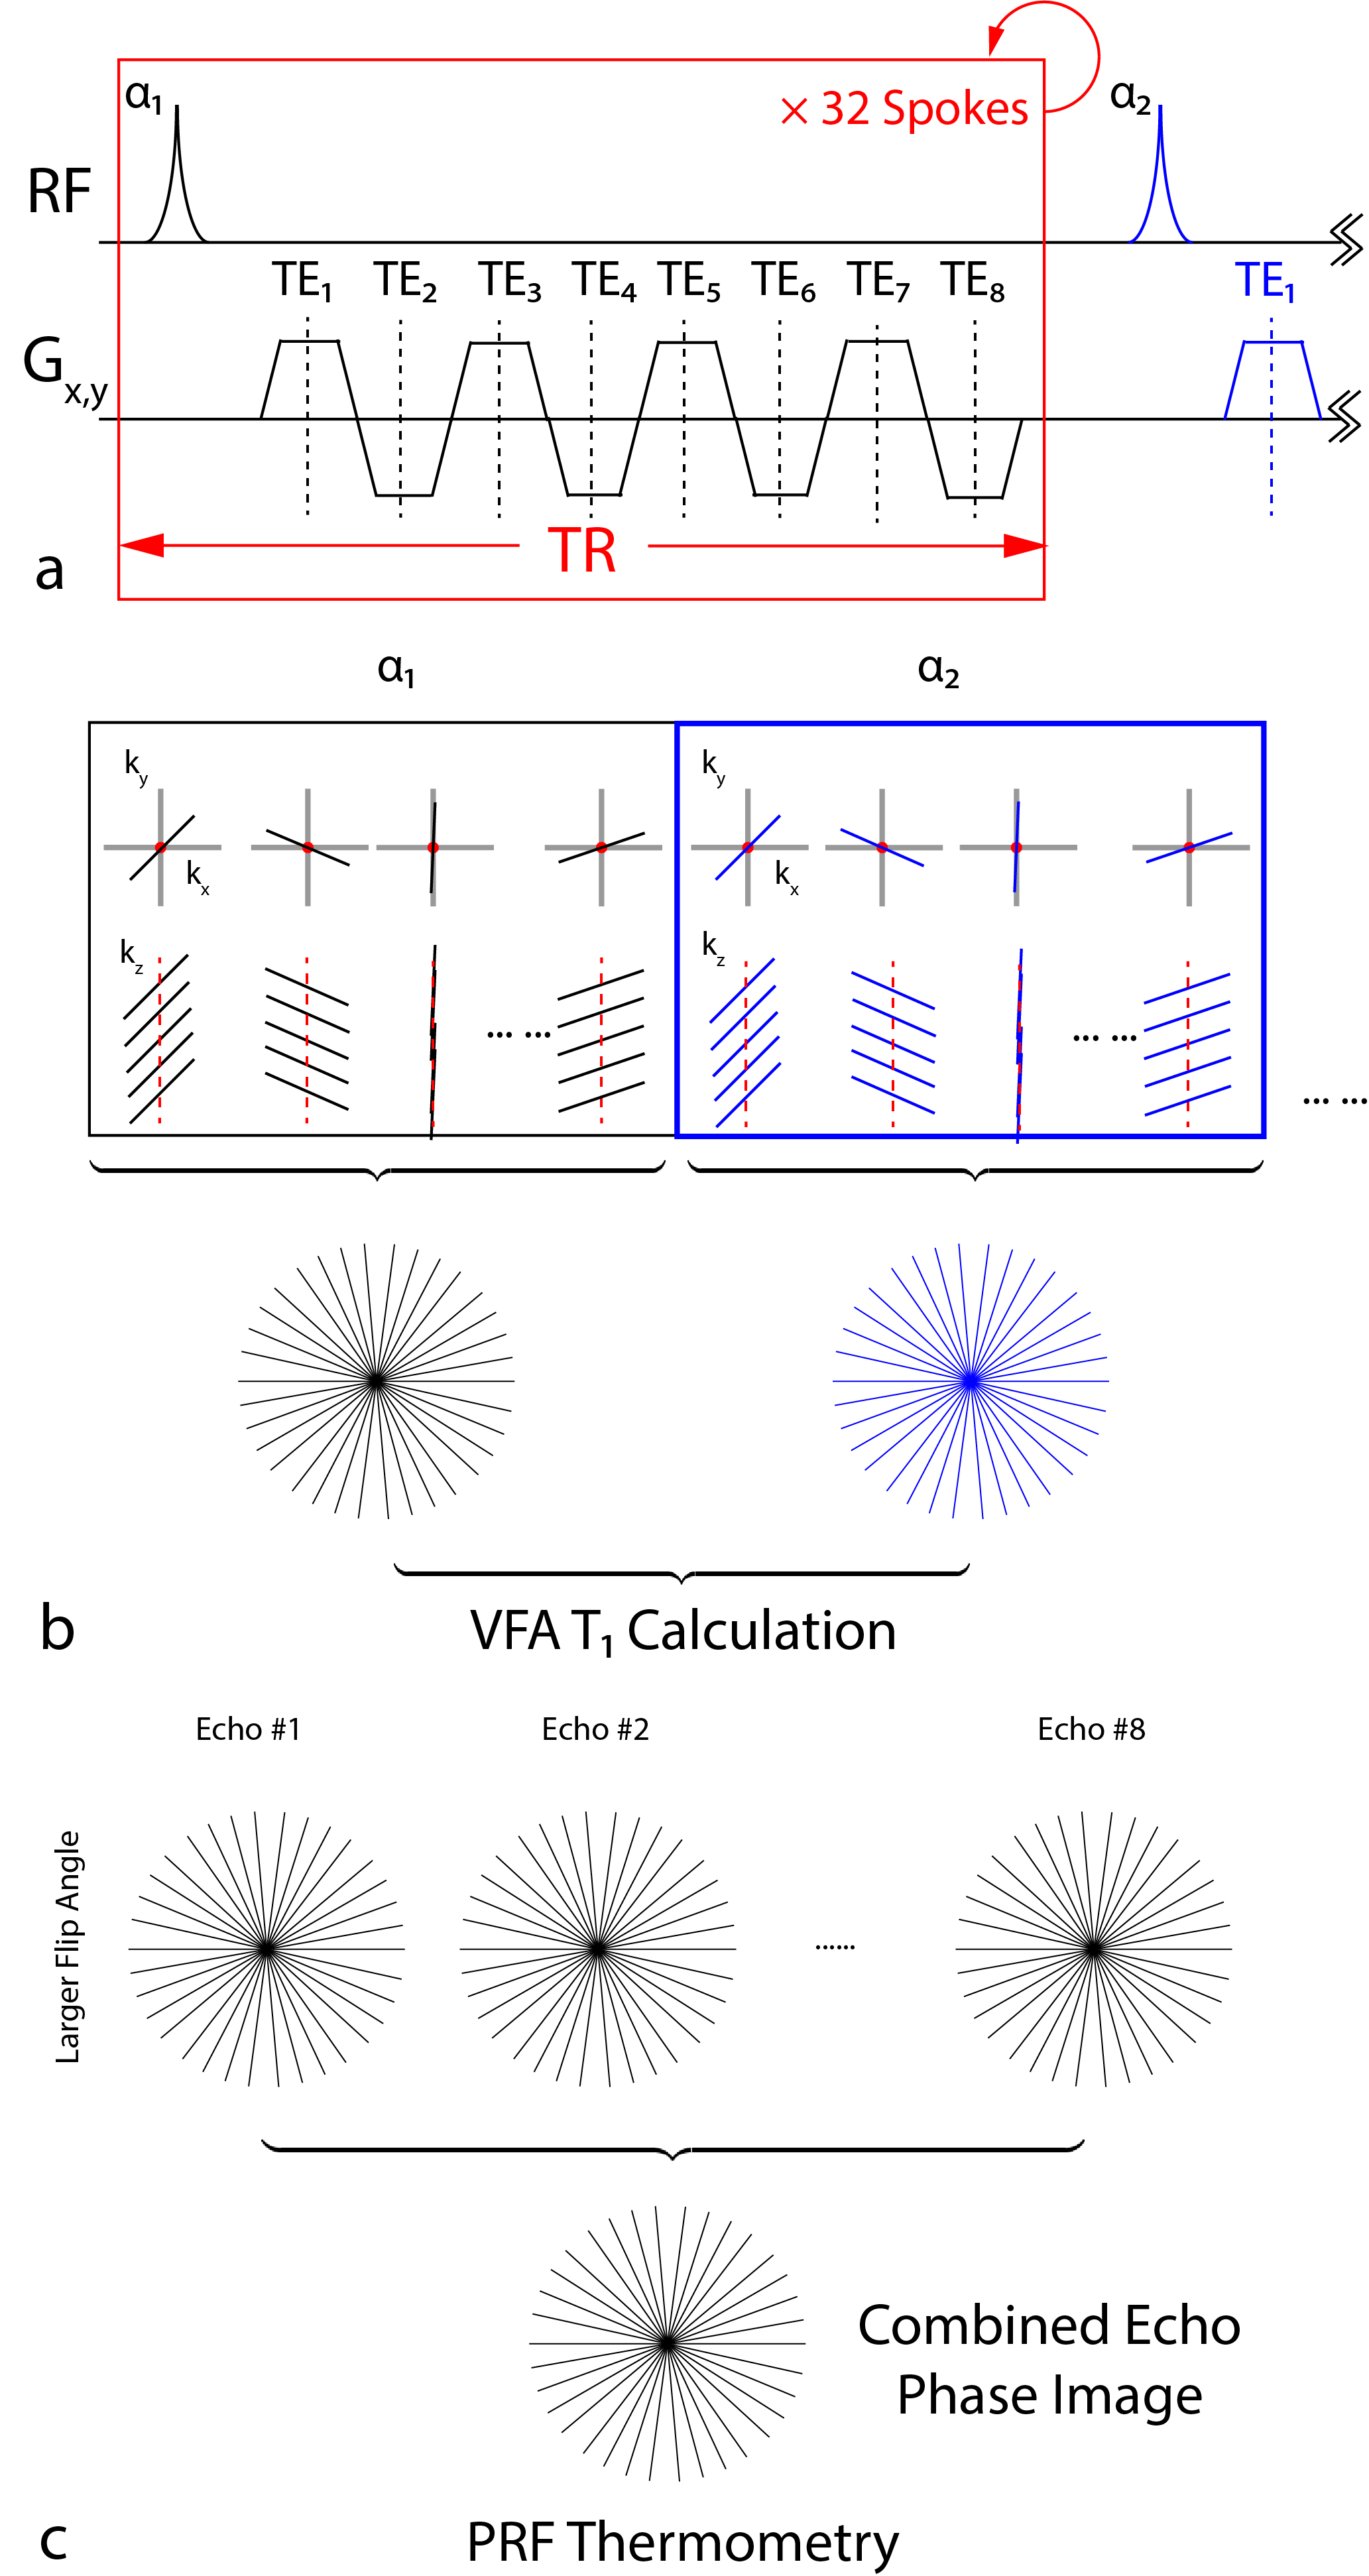
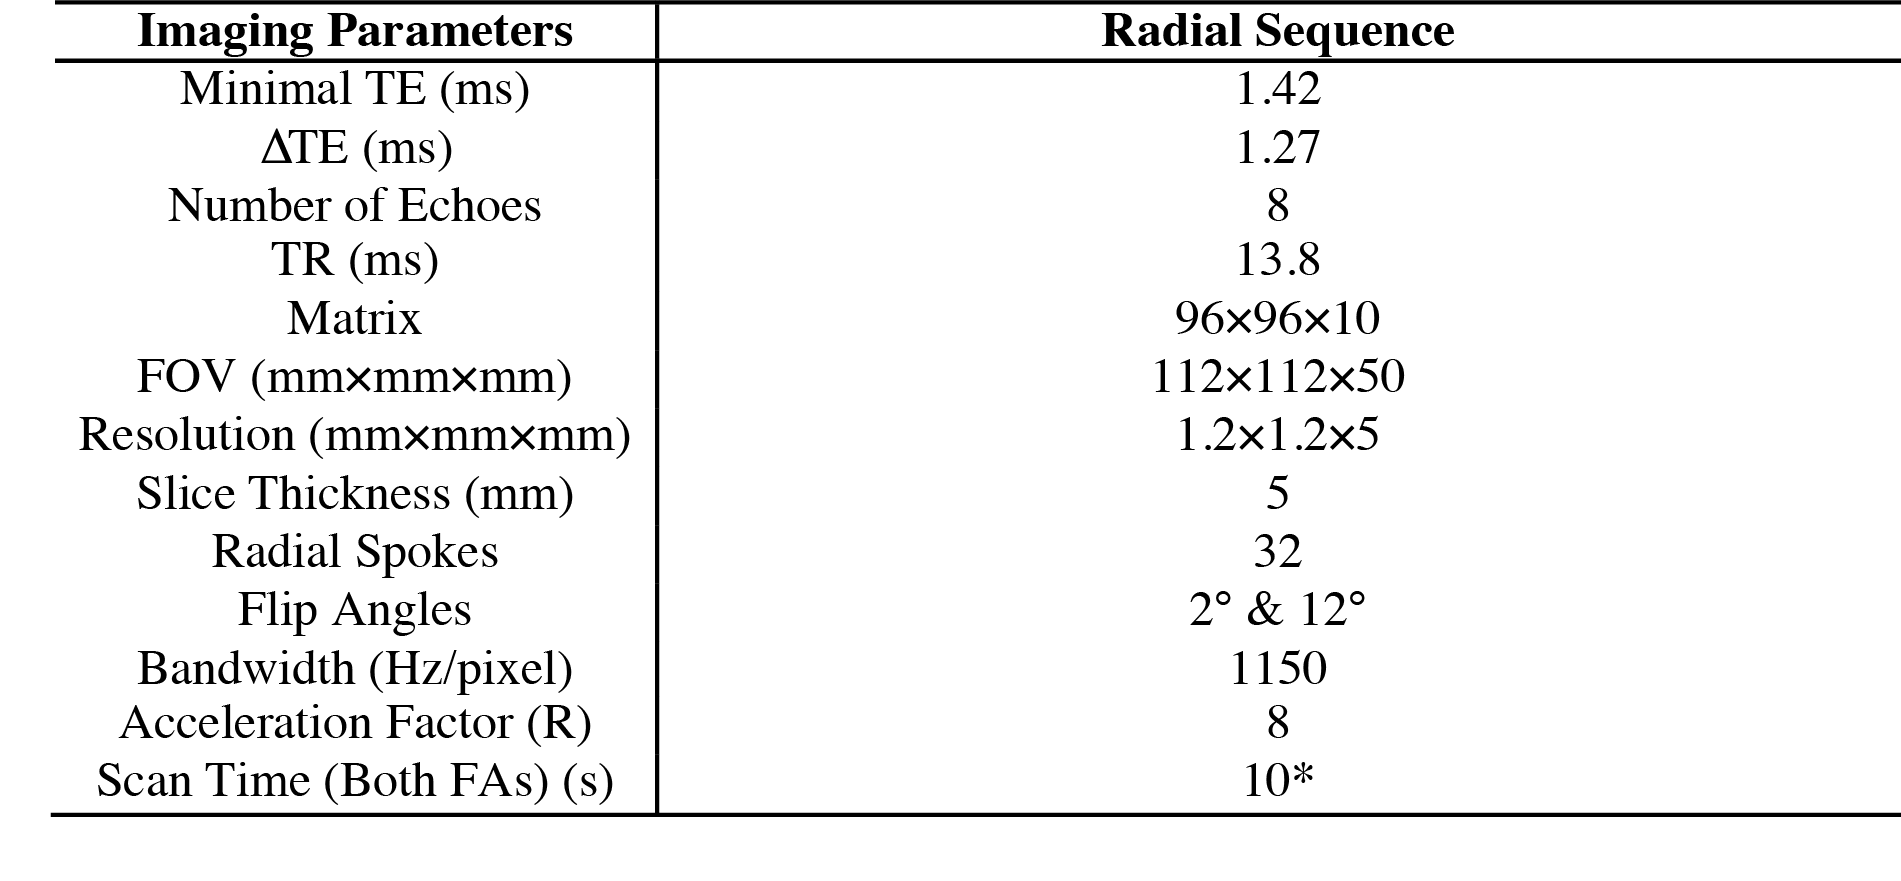
Fig. 1 shows the proposed method based on a bipolar multi-echo RF-spoiled GRE sequence with the golden-angle-ordered 3D stack-of-radial trajectory4. Parameters are presented in Table 1. The magnitude images of the first echo acquired using both flip angles are used for T1 mapping (Fig.1b), while the echo-combined phase images acquired with the larger flip angle are used for PRF temperature mapping (Fig.1c). To correct for eddy current effects and gradient errors, 80 calibration spokes (40 each for Gx and Gy) were obtained in a reference scan5.
Phantom Experiments
Focal laser ablation (PhoTex15, BioTex) was performed at 3T (Prisma, Siemens) in a gel phantom, which was kept in a 37°C water bath prior to experiment. A laser fiber was inserted into the phantom and a temperature probe was inserted in parallel to measure real-time temperature change as reference. The two optimal flip angles for VFA were calculated for an expected phantom T1 of 2.5s to be 2° and 12°. A B1+ map was acquired to calibrate the flip angles. The proposed sequence was first run at baseline (37°C) to provide a reference before 30 measurements were obtained during ablation. Data from all channels were adaptively combined6. For PRF thermometry, all echoes were combined3 with an effective TE=10ms. Temperature change was extracted from the evolution of both the phase of the combined echo with a coefficient of ‑0.01ppm/°C, and the T1 map with the coefficient of 5.76ms/°C7 using the standard VFA fitting process8. For T1 maps, the amplitude images of three consecutive acquisitions were averaged in a sliding-window approach to improve SNR.
Results
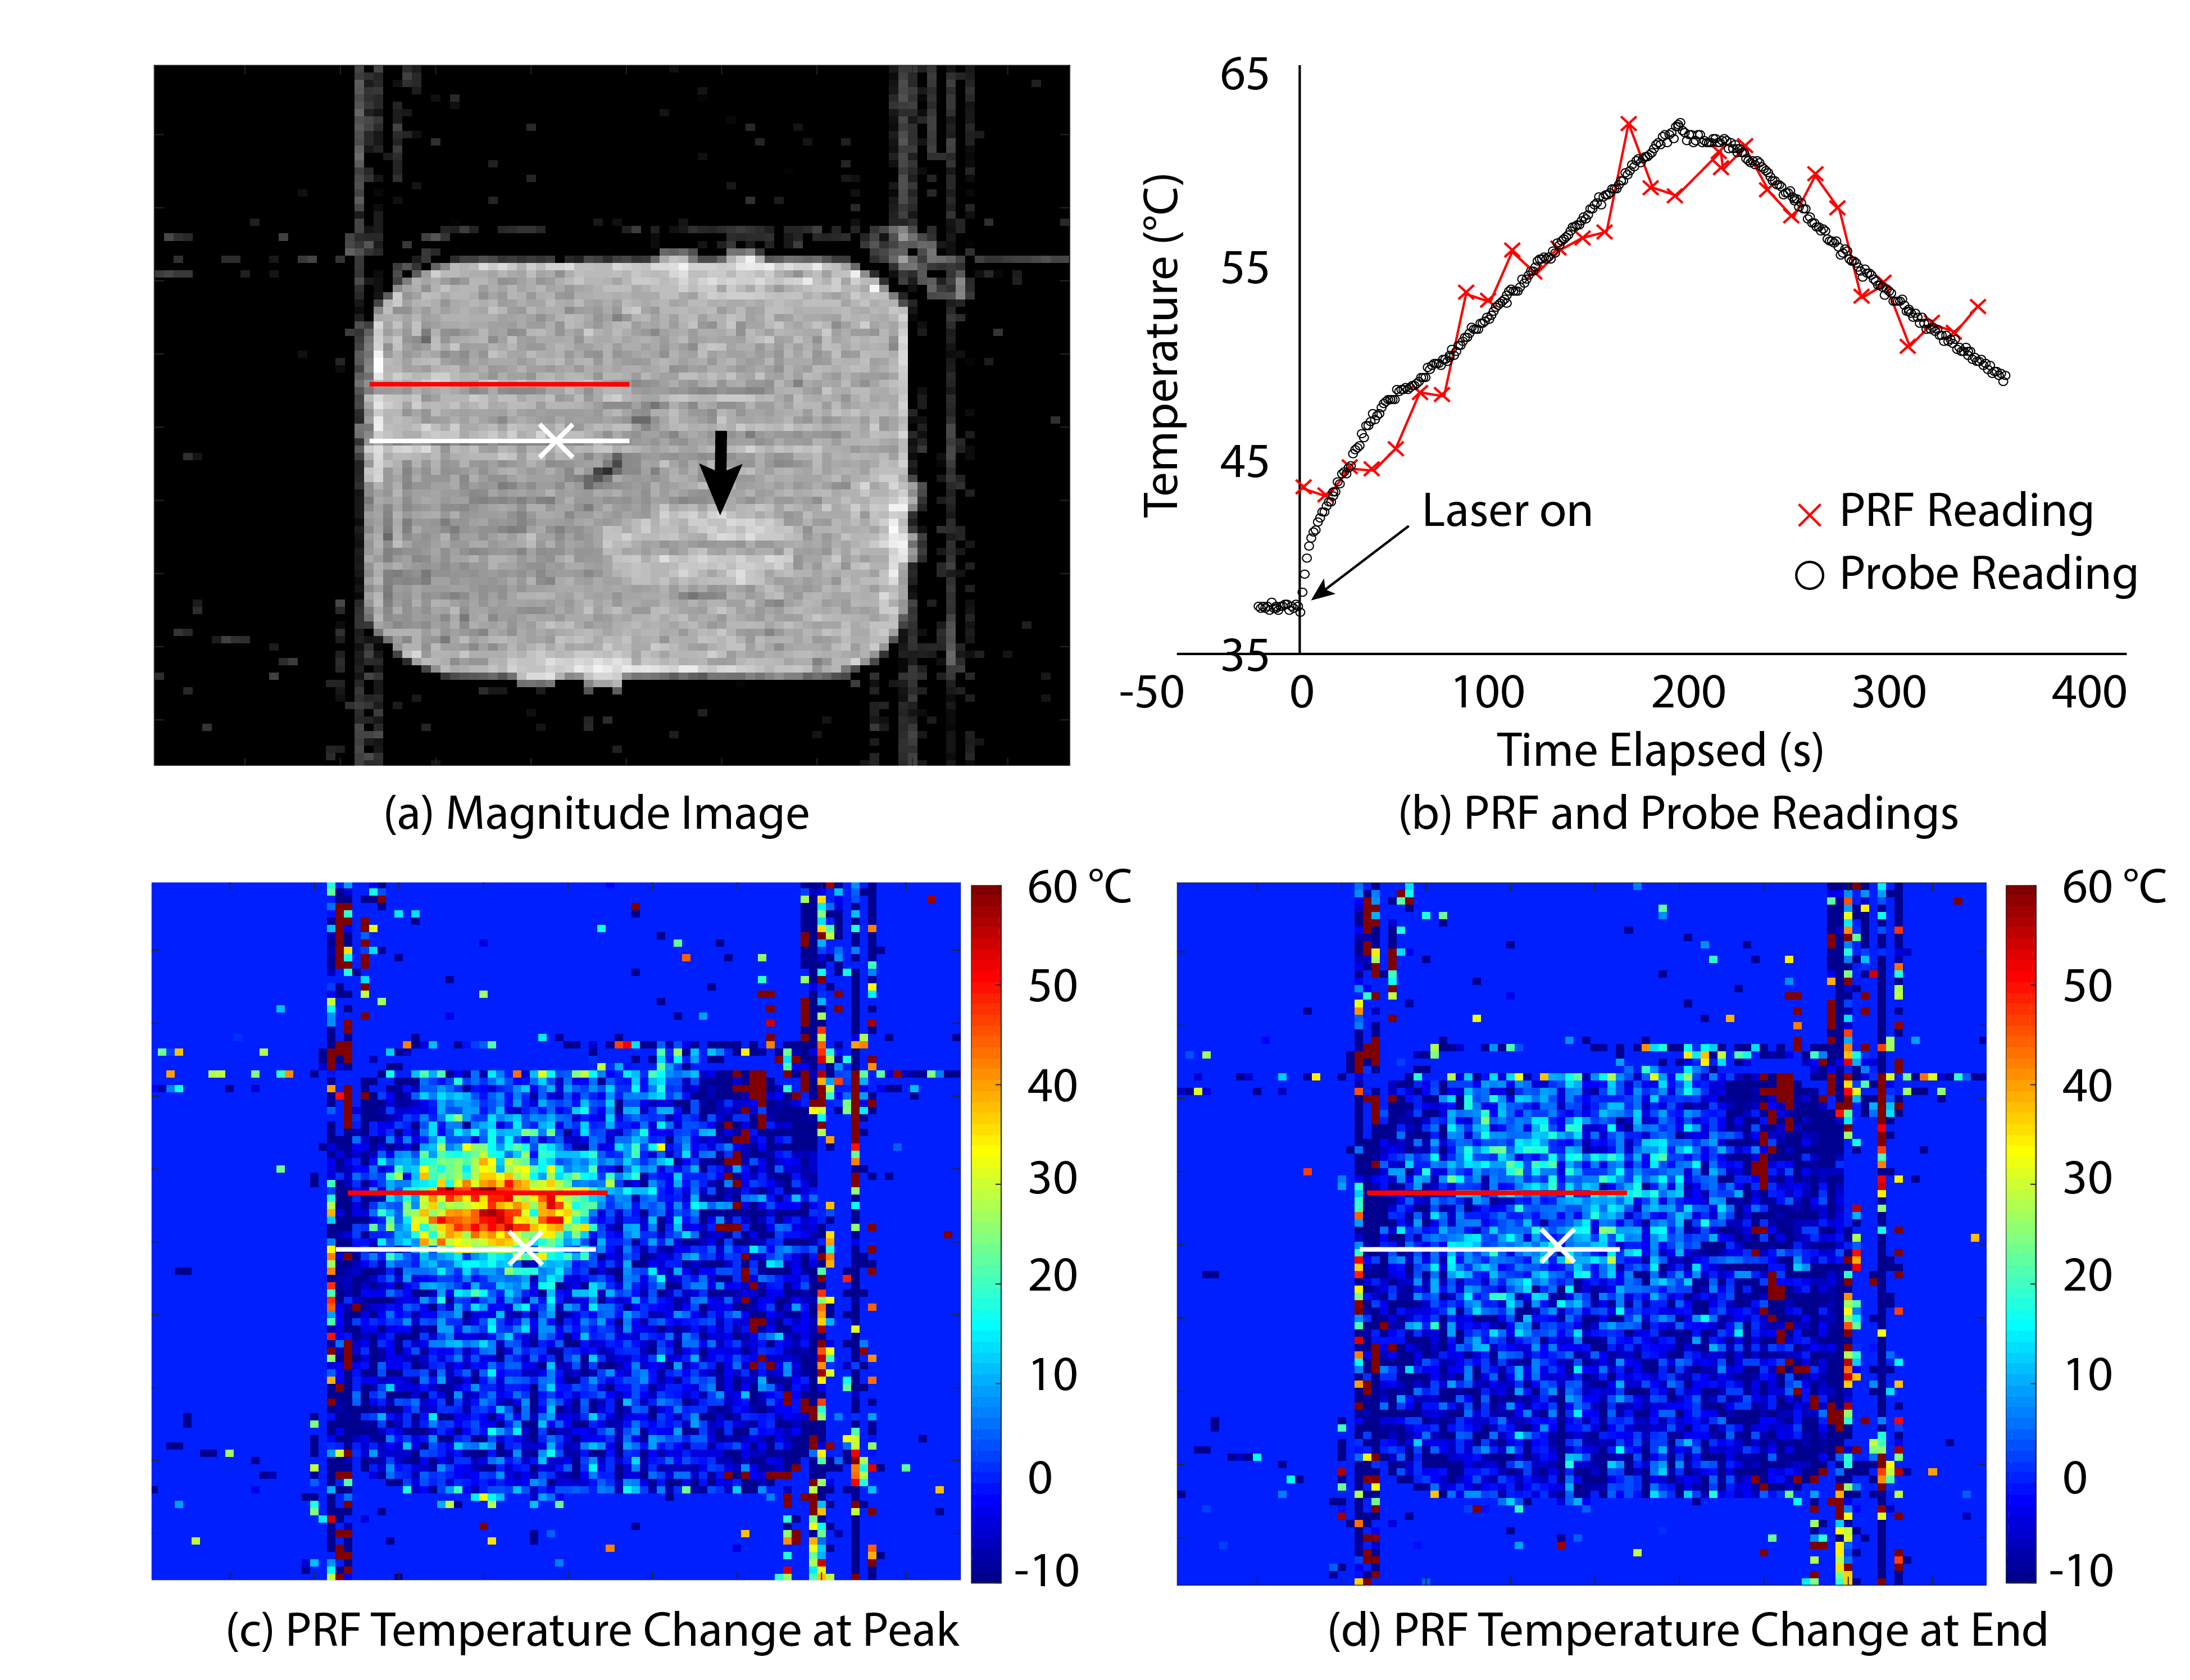
Fig.2a shows the magnitude image of the central coronal slice at baseline. The paths of the laser fiber and temperature probe are represented by the red and white lines, respectively. Fig.2c and Fig.2d show the relative temperature change with respect to baseline temperature using PRF at the time of peak temperature and at the end of ablation, respectively. In both images, the white cross marks the position of one temperature sensor, whose readings are shown in Fig.2b along with the absolute PRF temperature value of the corresponding pixel.
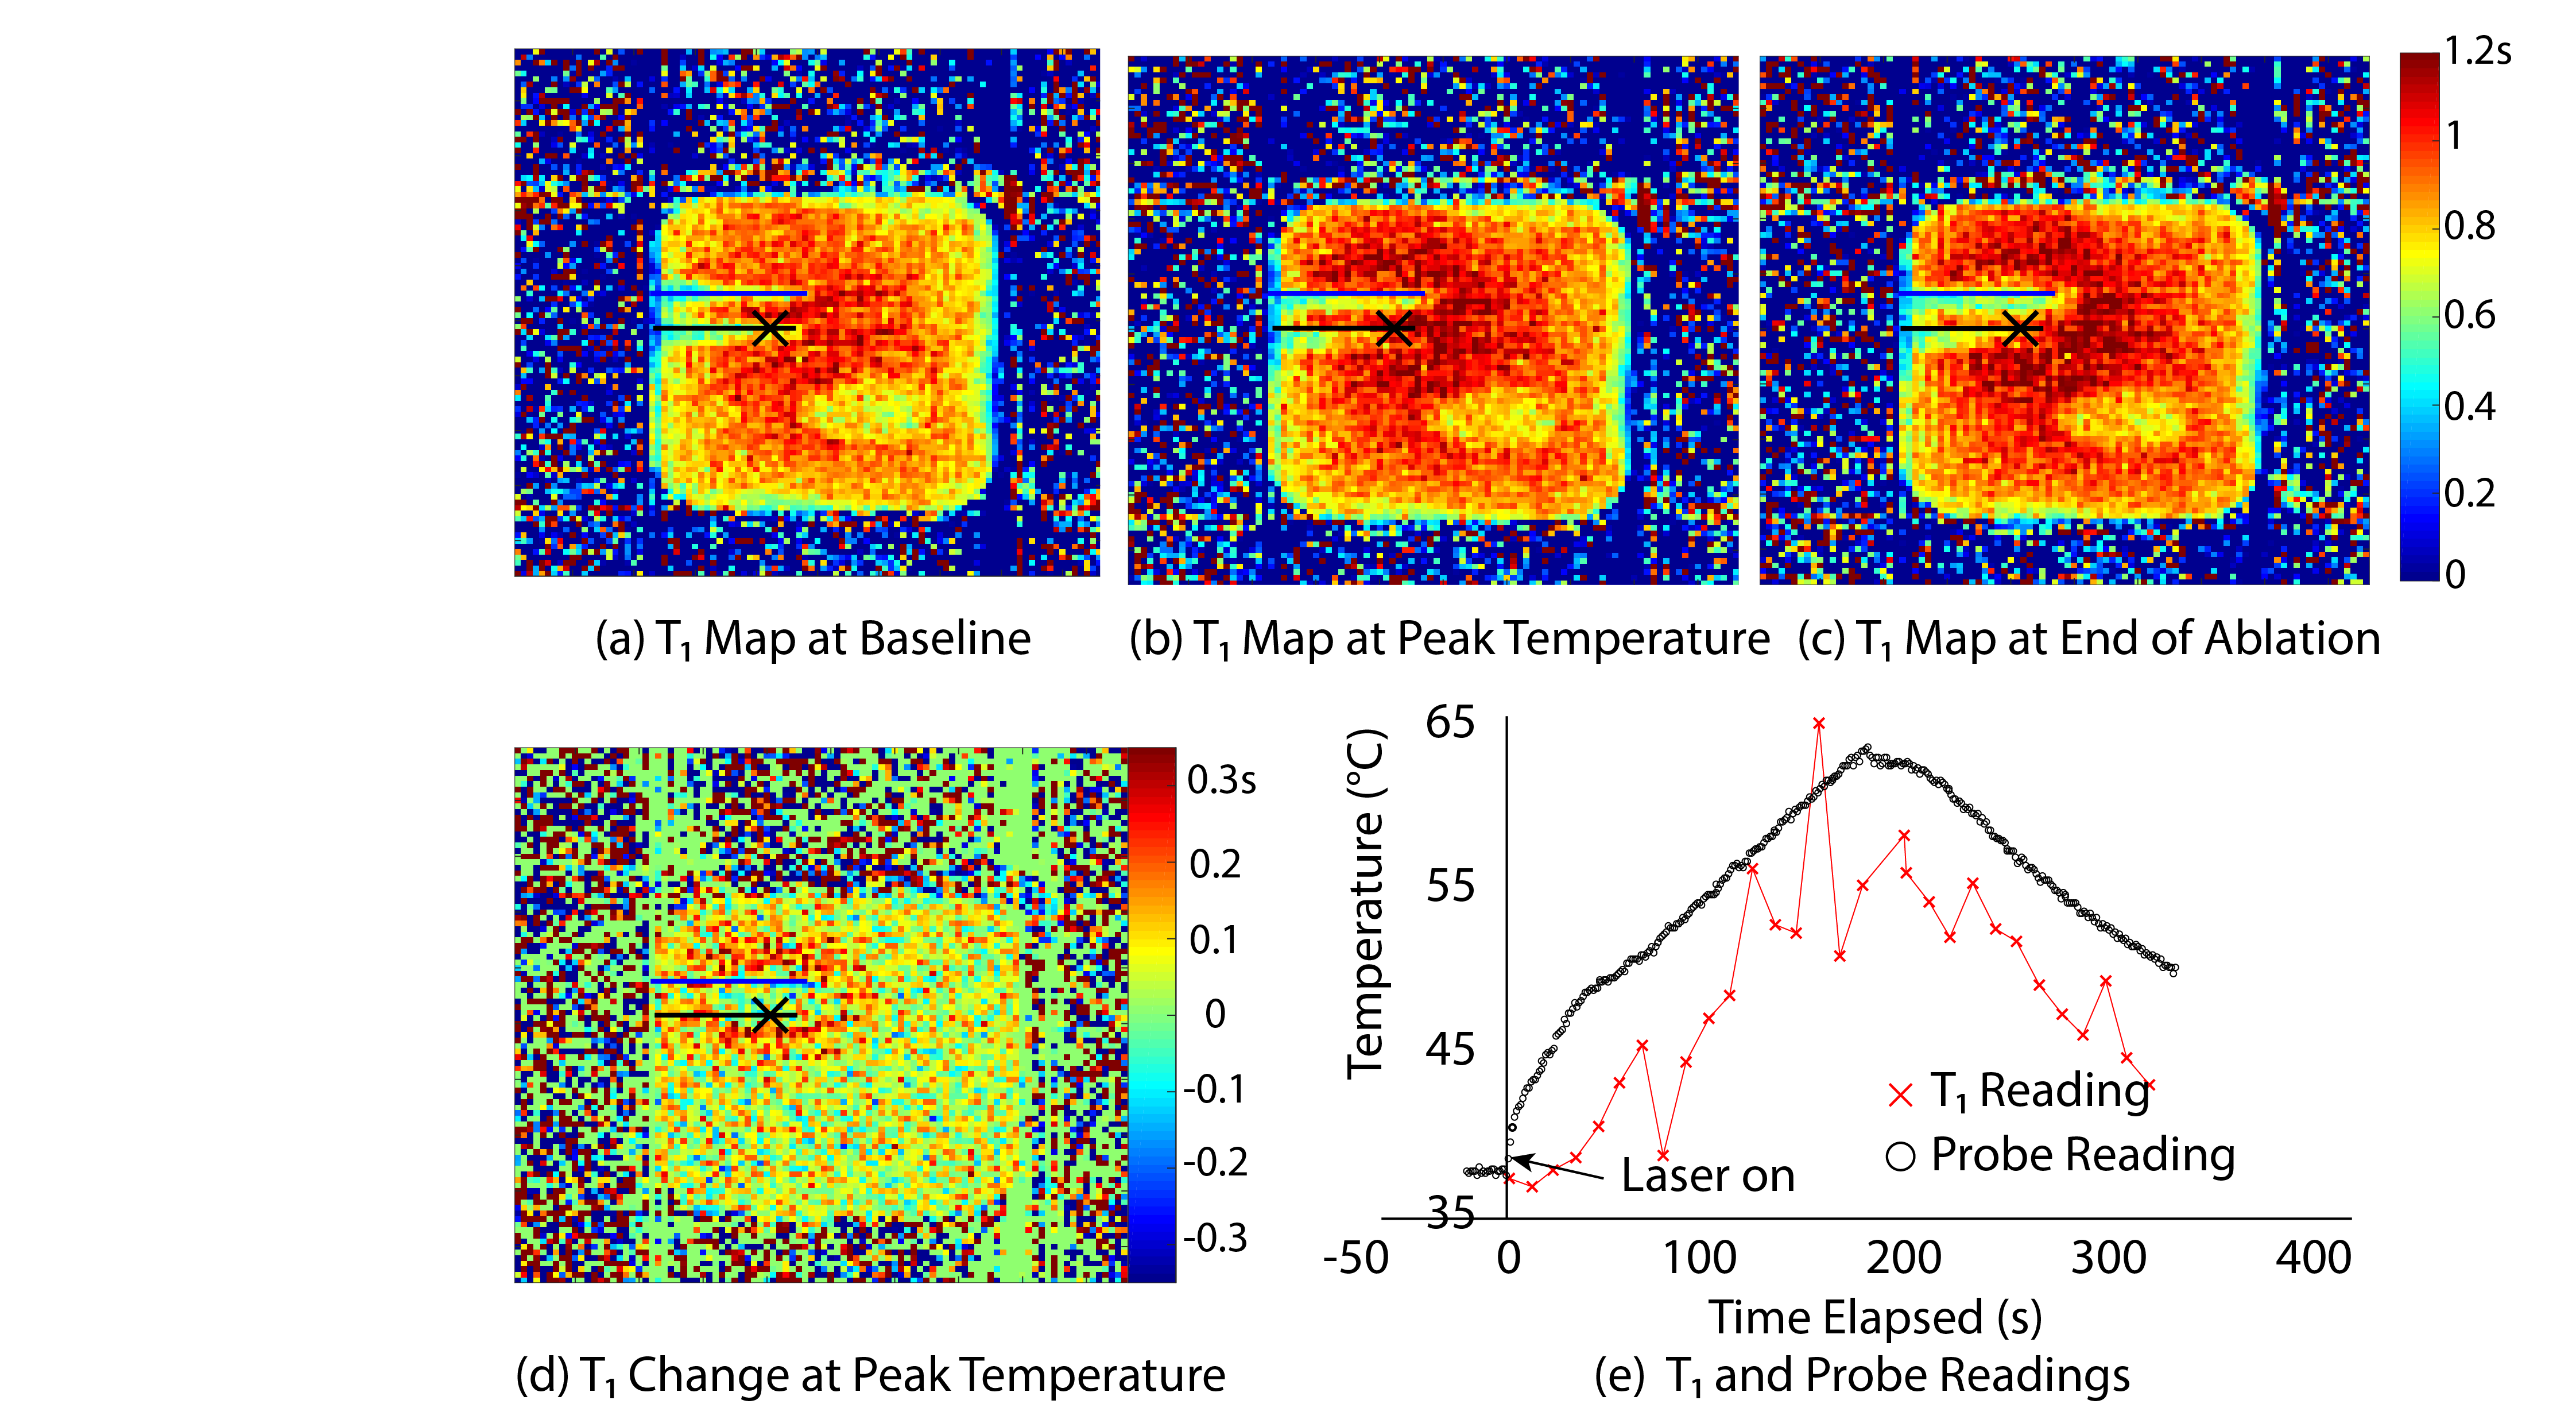
Fig.3 shows the T1 maps of the central coronal slice using the proposed sequence at the baseline temperature, at the time of peak temperature and at the end of ablation. Fig.3d illustrates the change in T1 value at peak temperature with respect to Fig.3a. In Fig.3e the change in T1 value in the pixel marked by the cross is translated to absolute temperature values, which are plotted alongside the temperature probe readings.
Discussion
The proposed sequence achieved spatial coverage of 112×112×50mm3 with resolution of 1.2mm and temporal resolution of 10s per dataset. The PRF results obtained in the laser ablation experiment showed a high degree of agreement with temperature probe readings. An average deviation of 2°C was observed between the PRF and temperature probe results, likely attributable to the low SNR and the high radial undersampling. The T1 measurement, however, was much noisier and yielded, on average, 4.5°C lower temperature values. This can be due to several factors. First, the expected T1 time (2.5s) used in determining the optimal flip angles was very different from the T1 measured (~1.2s). Second, the small number of radial spokes might not establish GRE steady-state for VFA. Lastly, the temperature coefficient for water T1 is known to vary and can cause an error of ~10°C. These can be better addressed when the proposed sequence is applied to adipose tissues, whose shorter T1 and better characterized temperature coefficient can lead to higher SNR and temperature accuracy. Future work will include the incorporation of parallel imaging and constrained reconstruction to achieve higher coverage, finer spatiotemporal resolution, and increased temperature accuracy.Conclusion
We proposed a new hybrid PRF-T1 thermometry method using the golden-angle 3D stack-of-radial trajectory. Preliminary data using this technique demonstrated promising temperature accuracy with dynamic 3D coverage.Acknowledgements
The authors thank Dr. Xiaodong Zhong at Siemens Healthineers for helpful discussions. This work was supported in part by Siemens Healthineers.References
1. Todd N, Diakite M, Payne A, Parker DL. Hybrid proton resonance frequency/T1 technique for simultaneous temperature monitoring in adipose and aqueous tissues. Magn. Reson. Med. 2013;69:62–70.
2. Todd N, Diakite M, Payne A, Parker DL. In vivo evaluation of multi-echo hybrid PRF/T1 approach for temperature monitoring during breast MR-guided focused ultrasound surgery treatments. Magn. Reson. Med. 2014;72:793–799.
3. Svedin BT, Payne A, Bolster BD, Parker DL. Multiecho pseudo-golden angle stack of stars thermometry with high spatial and temporal resolution using k-space weighted image contrast. Magn. Reson. Med. 2017:1–13.
4. Winkelmann S, Schaeffter T, Koehler T, Eggers H, Doessel O. An Optimal Radial Profile Order Based on the Golden Ratio for Time-Resolved MRI. IEEE Trans. Med. Imaging 2007;26:68–76.
5. Armstrong T, Dregely I, Stemmer A, Han F, Natsuaki Y, Sung K, Wu HH. Free-breathing liver fat quantification using a multiecho 3D stack-of-radial technique. Magn. Reson. Med. 2017:1–13.
6. Walsh DO, Gmitro AF, Marcellin MW. Adaptive reconstruction of phased array MR imagery. Magn. Reson. Med. 2000;43:682–690.
7. Hey S, de Smet M, Stehning C, Grüll H, Keupp J, Moonen CTW, Ries M. Simultaneous T1 measurements and proton resonance frequency shift based thermometry using variable flip angles. Magn. Reson. Med. 2012;67:457–463.
8. Fram EK, Herfkens RJ, Johnson GA, Glover GH, Karis JP, Shimakawa A, Perkins TG, Pelc NJ. Rapid calculation of T1 using variable flip angle gradient refocused imaging. Magn. Reson. Imaging 1987;5:201–208
Figures