1493
Application of hybrid MR-ultrasound imaging to multi-baseline thermometry1Radiology, Brigham and Women's Hospital, Harvard Medical School, Boston, MA, United States
Synopsis
MR thermometry, and more specifically the proton resonance frequency (PRF) shift method, has been widely employed for monitoring temperature change. However, breathing motion tends to corrupt the image phase that PRF relies upon. An existing free-breathing method called ‘multi-baseline thermometry’ was improved here by including a small ultrasound-based sensor fixed to the abdomen of the volunteer, to further help monitor and handle breathing motion. Utilizing both morphology (as in multi-baseline thermometry) and sensor information, better estimates of temperature changes could be achieved during breathing.
Introduction
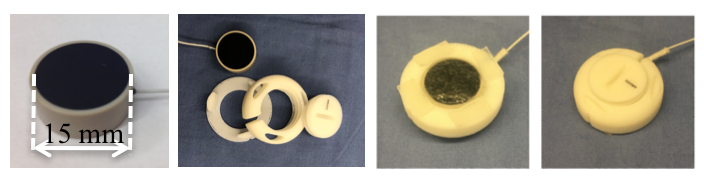
Proton resonance frequency (PRF)1 is the most commonly-used MR thermometry method, mostly because its temperature coefficient is nearly independent of tissue type2. However, in abdominal imaging, breathing motion creates additional phase shifts that may corrupt temperature measurements. Two main PRF approaches have been proposed to handle breathing motion: the referenceless3 and multi-baseline4 methods. The present work fits in the same general category as multi-baseline thermometry. However, ultrasound (US) signals are further included here as biometric navigators5, leading to hybrid MR-US acquisitions6. US-based sensors as shown in Fig. 1 were employed: they consist of an MR-compatible transducer, a 3D-printed capsule, ultrasound gel for acoustic coupling and two-way tape for skin fixation. These devices are called here ‘organ configuration motion’ (OCM) sensors, and one was fixed just below the rib cage to characterize breathing motion. As compared to more traditional motion-monitoring approaches such as respiratory bellows and navigator echoes, advantages of OCM sensors include: OCM sensors contact only a small area of the torso and their signals directly capture internal motion (unlike bellows), and OCM signals are acquired in parallel with MRI and as such do not affect the overall scan efficiency (unlike most navigator echoes). Compared to conventional multi-baseline thermometry, the inclusion of OCM signals into the reconstruction chain led to improved PRF measurements in the presence of free breathing.Methods
Multi-baseline thermometry requires reference data to be acquired, without cooling or heating, to provide a phase reference. Temperature-induced phase shifts are then calculated with respect to such reference data. For every time point in the heating/cooling process, a best-matching image must be chosen from the reference set. While the matching process would normally be based on image similarity, the present method further involved signals from an OCM sensor. Human scans were performed after informed consent, on a 3.0T Siemens Verio system (45mT/m, 200/T/m/s), using a flexible body coil matrix, with parameters: FOV=38x38cm2, matrix size=192x192, slice thickness=5mm, flip angle=30°, bandwidth=390Hz/px, TR/TE=10/4.8ms, 500 dynamic acquisitions, temporal resolution=0.6 s, partial Fourier ratio=5/8. An MR-compatible OCM sensor that included a 1MHz transducer (Imasonics, 15-mm diameter) was employed (Fig. 1). Phase-based, Doppler-like processing was performed on OCM signals to generate velocity and displacement measurements, for depth locations up to 15cm below the sensor. In one of two measurements, a cold compress was applied to the abdomen, in-between the body matrix and the OCM sensor, to create small but detectable temperature changes. The cooling phase following the application of the compress was captured, and reference data were acquired after a 15-min delay, when temperature was mostly stable and unchanging. Similarity in image and OCM signals were used to identify optimal matches: while images tested similarity in morphology, OCM signals tested consistency in terms of biomechanical motion.Results
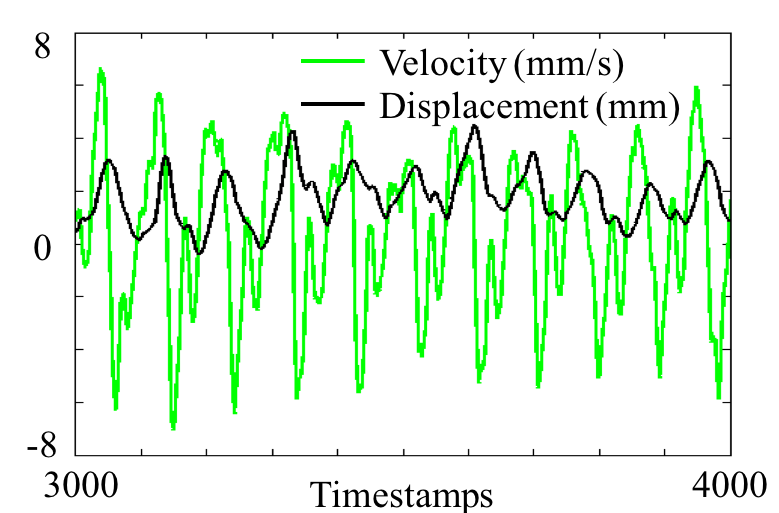
Figure 2 shows measurements
derived from OCM signals: mean displacement (black line) and velocity (green line)
were averaged over all sampled tissue depths. Velocity was about zero at full inspiration
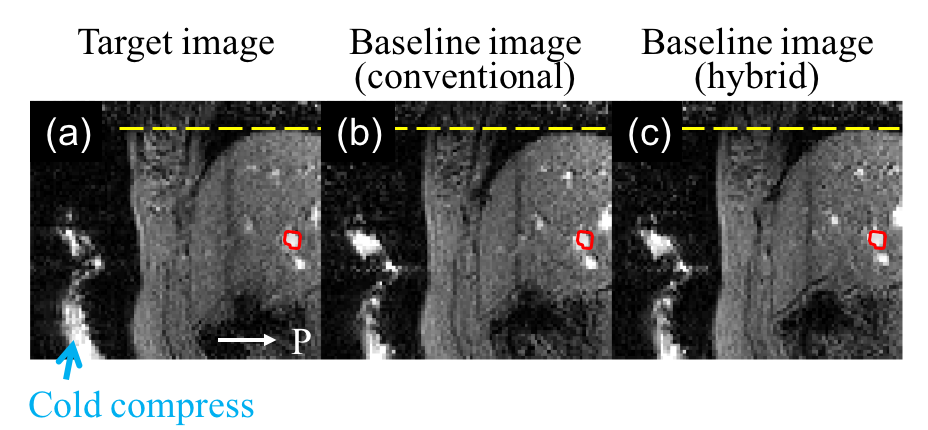
and expiration while displacement was maximal at these time points. Figure 3
shows an example of a matching process, where an optimal match was sought for
the image in Fig. 3a. Using only image similarity, the image in Fig. 3b was
identified as the best match, as opposed to that in Fig. 3c when further
including OCM-based information. Yellow and red markings, common to Fig. 3a,
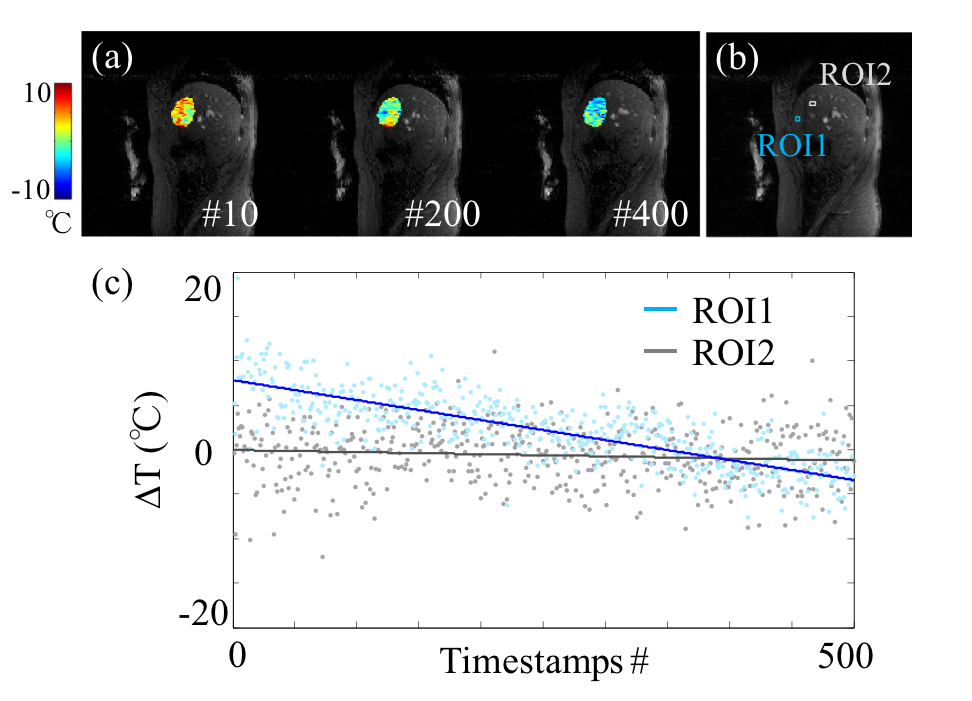
3b and 3c, help appreciate how the image in Fig. 3c appears to be a better match than that in Fig. 3b. Using the proposed processing, temperature change is
displayed as a color overlay in Fig. 4a, for three time points. Two different
ROIs, at shallower and deeper locations, are defined in Fig. 4b with blue and
white squares, respectively. As shown in Fig. 4c the shallower ROI, the one in
closer proximity to the cold compress, was associated with a temperature change
of about 10˚C while temperature was nearly constant for the ROI located more
deeply in the abdomen.
Discussion and Conclusion
An improved version of the multi-baseline free-breathing thermometry approach was introduced, which included the use of OCM sensors and associated hybrid MR-US imaging. The OCM sensor offered rich motion-related information, including Doppler-like measurements of the displacement and velocity of tissues due to breathing. Such information helped identify the best available matches out of a library of reference data, as part of multi-baseline thermometry. Both morphological similarities and internal motion as detected by OCM were taken into account in the proposed processing, giving rise to hybrid US-MR imaging for PRF thermometry.Acknowledgements
Support from NIH grants P41EB015898 and R01CA149342 is acknowledged.References
1. Ishihara, Y., Calderon A., Watanabe H., et al. A precise and fast temperature mapping using water proton chemical shift. Magn Reson Med. 1995;34(6):814-823.
2. Peters, R.D., R.S. Hinks, and R.M. Henkelman. Ex vivo tissue-type independence in proton-resonance frequency shift MR thermometry. Magn Reson Med. 1998;40(3):454-459.
3. Rieke, V., Vigen K.K., Sommer G., et al. Referenceless PRF shift thermometry. Magn Reson Med. 2004;51(6):1223-1231.
4. Vigen, K.K., Daniel B.L., Pauly J.M, et al. Triggered, navigated, multi-baseline method for proton resonance frequency temperature mapping with respiratory motion. Magn Reson Med. 2003;50(5):1003-1010.
5. Schwartz, B.M. and N.J. McDannold. Ultrasound echoes as biometric navigators. Magn Reson Med. 2013;69(4):1023-1033.
6. Preiswerk, F., Toews M., Cheng CC., et al. Hybrid MRI-Ultrasound acquisitions, and scannerless real-time imaging. Magn Reson Med. 2017;78(3):897-908
Figures