1491
Evaluate Acoustic Radiation Force Induced Displacement of High Velocity Core by Phase-contrast MRI1Biomedical Engineering and Environmental Sciences, National Tsing Hua University, Hsinchu, Taiwan, 2Center for Advanced Molecular Imaging and Translation, Chang Gung Memorial Hospital, Taoyuan, Taiwan, 3Electrical Engineering, Chang-gung University, Taoyuan, Taiwan, 4Physical Medicine and Rehabilitation, National Taiwan University Hospital, Taipei, Taiwan, 5Division of Medical Engineering Research, National Health Research Institutes, Miaoli, Taiwan
Synopsis
We hypothesized that the aggregated bubbles could be seen as a barrier, which might alter the flow pattern by shifting the high velocity core of flowing fluid. The aim was to assess the secondary acoustic radiation force and the size of aggregated bubbles, and thereby to estimate the amount of delivered drug in the targeting tissue. We found that larger displacement generally occurred with higher acoustic pressure, higher microbubble concentration, and slower flow velocity. In conclusion, we verified the feasibility of using phase-contrast MRI to evaluate the displacement of high velocity core in a phantom with flow microbubbles.
Introduction
The acoustic radiation force (ARF) induced by microbubbles (MBs) with focused ultrasound (FUS) was well-known as a scheme for localizing drug delivery. The primary ARF can propel MBs to the far-field of a vessel while the secondary ARF can aggregate MBs to form a large size bubbles [1,2]. With secondary ARF, the aggregated MBs can improve drug load. The amount of carried drug can be measured by assessing secondary ARF [3]. Previous studies reported the aggregated bubble size would increase with higher acoustic pressure and MB concentration and lower flow velocity [3,4]. We hypothesized that the aggregated bubbles could be seen as a barrier, which might alter the flow pattern by shifting the high velocity core of flowing fluid in a vessel. In this study, we employed phase-contrast MRI (PC-MRI) to real-time evaluate the displacement of high velocity core in a phantom with flowing MBs. The aim was to assess the secondary ARF and the size of aggregated bubbles, and thereby to estimate the amount of delivered drug in the targeting tissue.Method
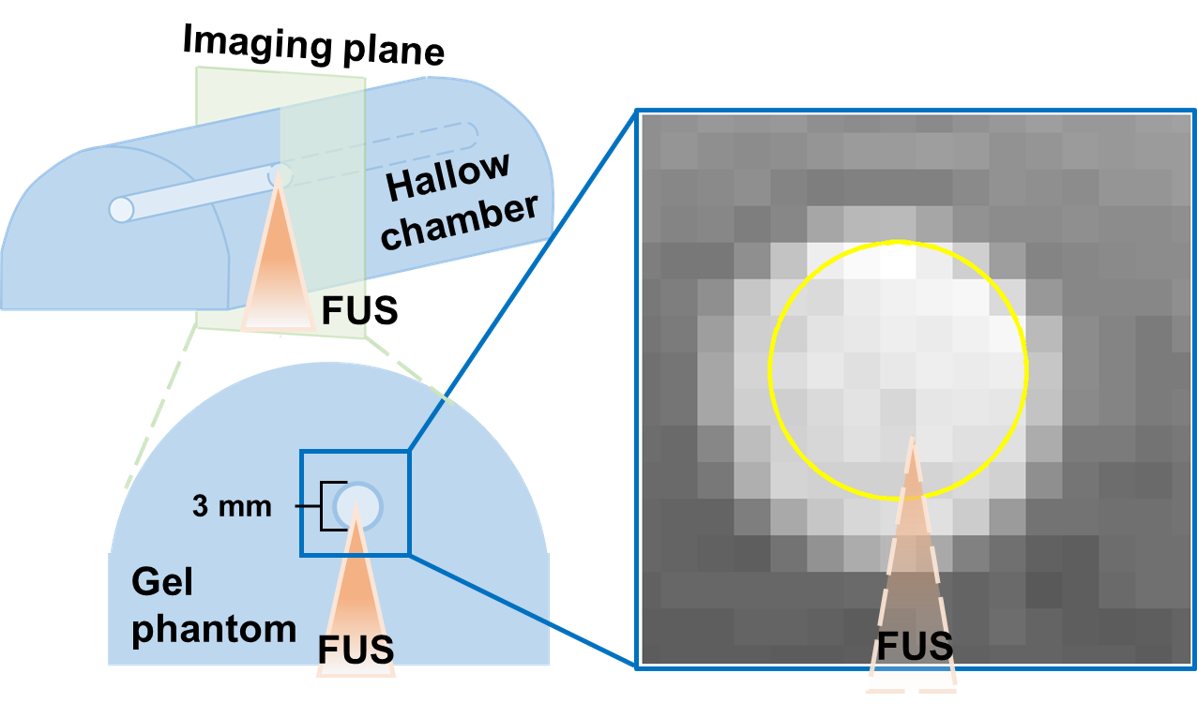
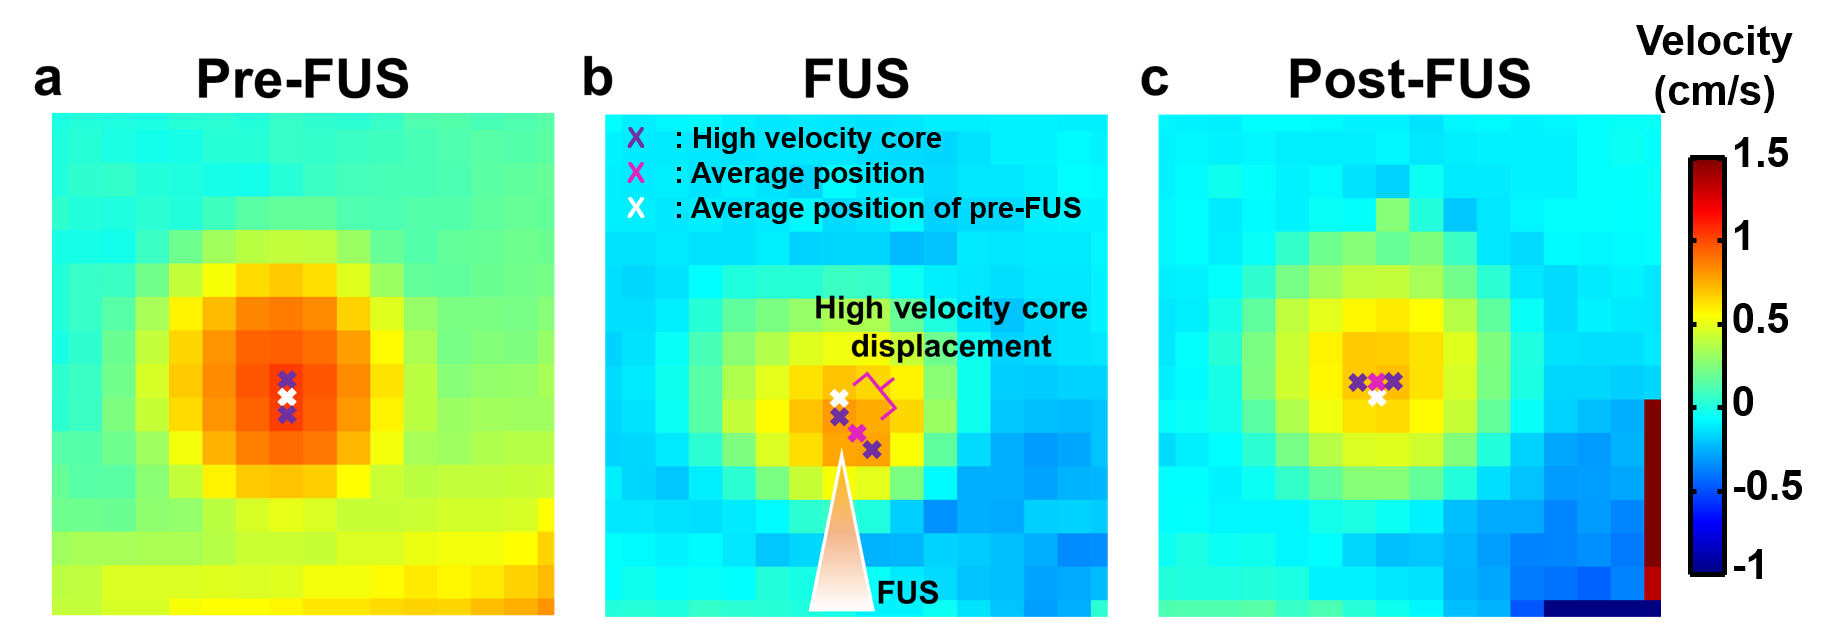
Figure 1 displays the experimental set-up. The MBs (lipid shell with C3F8, mean diameter=1.25 µm (Number%), Trust Bio-sonics inc.) was diluted to 0.1%, 0.2%, 0.5%, and 1% and injected into a chamber (diameter=3 mm) of a gel phantom with constant velocities=1, 1.5, and 2 cm/s. Continuous FUS pulses were transmitted to MBs with acoustic pressure=25, 50, 75, and 100 kPa by a single-element probe (central frequency=1 MHz, diameter=2.5 cm, curvature=2.0 cm, RK300, FUS Instruments). Phase-contrast MRI was performed in a cross-sectional view of the chamber with TR/TE=26.9/8.4 ms, voxel size=0.31x0.31x1 mm3, flip angle=10 , velocity encoding Venc=6 cm/s, temporal resolution=4.2 s, measurement=30 in a 7-Tesla MR scanner (ClinScan, Bruker). The MR images were acquired during pre-FUS (t=0-31.6 s), FUS transmission (t=31.6-71 s), and post-FUS (t=71-110.6 s). The position of high velocity core was determined by the pixels with velocity>mean velocity of top 5% pixels (P95) within the selected ROI. The displacement of high velocity core was the distance between high velocity cores of pre-FUS and FUS, as shown in Figure 2.Results
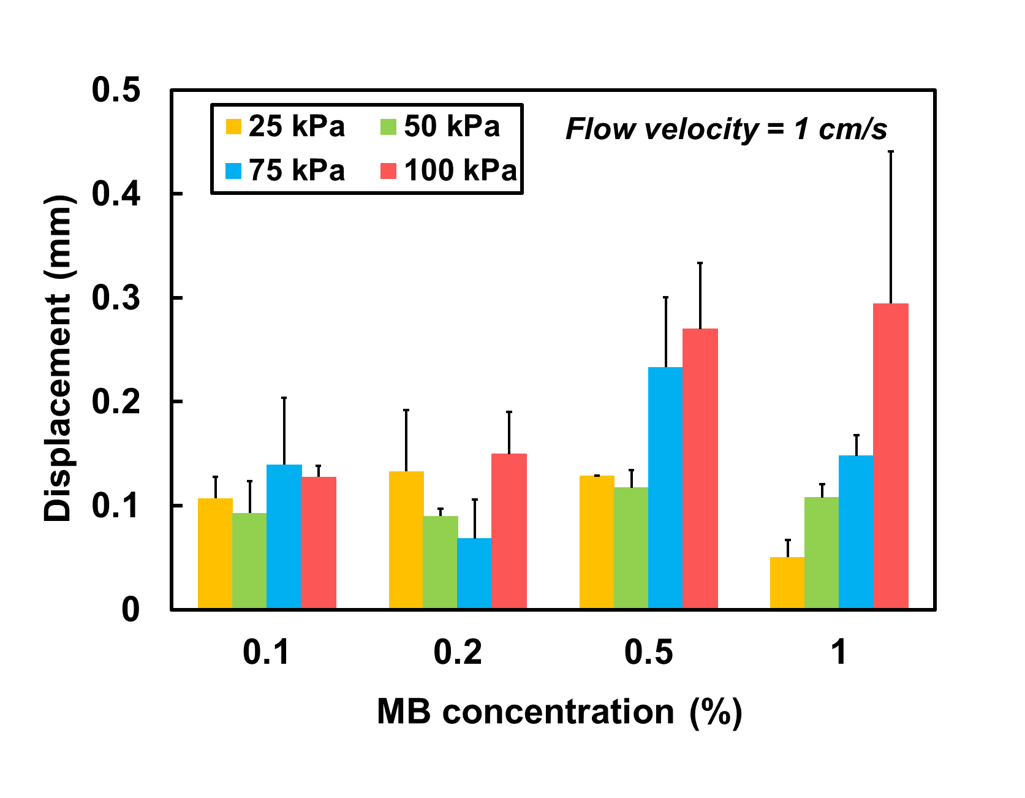
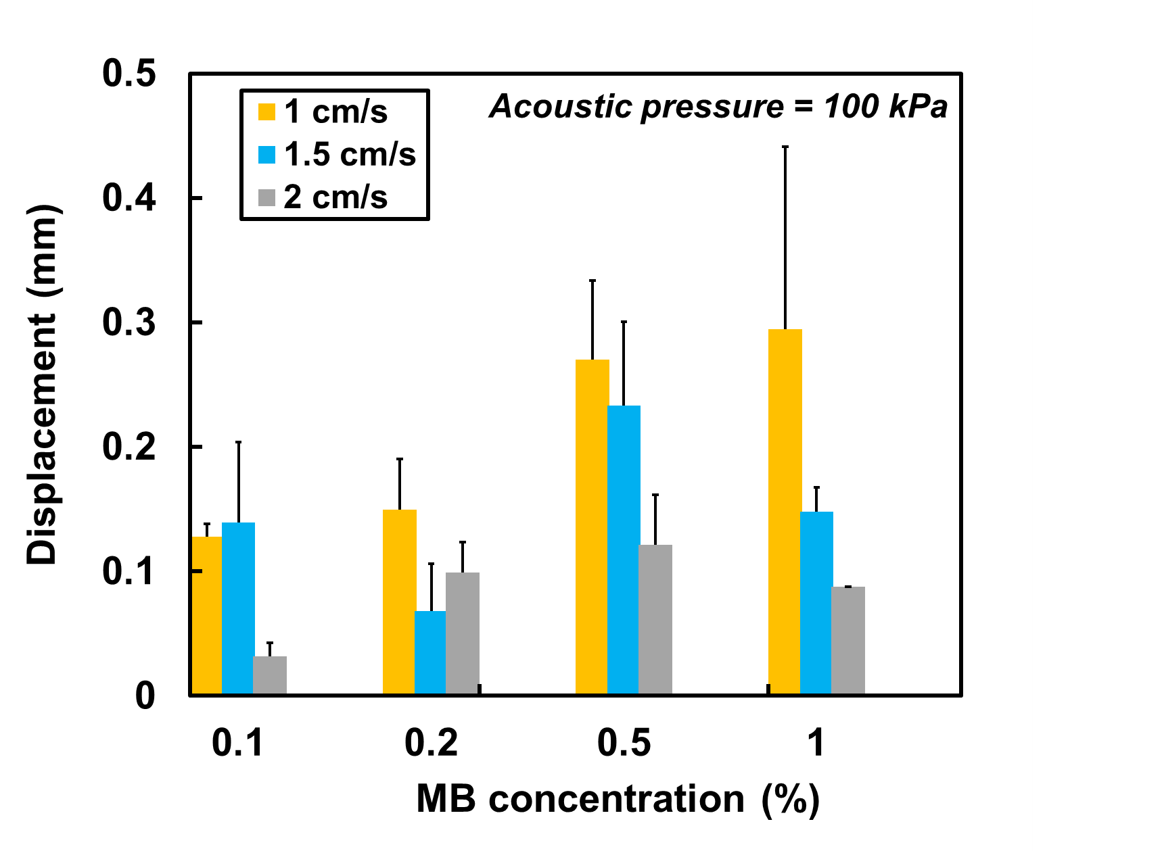
Figure 2 displays the velocity fields of the cross-sectional areas of the chamber at pre-FUS, FUS (t=40 s), and post-FUS. There was a substantial displacement between the high velocity cores of pre-FUS and FUS (Figures 2a and 2b). After turning off FUS, the displacement became smaller (Figure 2c). Figure 3 shows displacements increased with increase of acoustic pressures and MB concentrations. However, with MB concentration of 0.1% and 0.2%, this trend was absent. In Figure 4, with acoustic pressure of 100 kPa, the displacement increased with decrease of flow velocity at MB concentrations of 0.5% and 1%, reflected that lower flow velocity could afford relatively stable flow for the formation of larger aggregated bubbles.Discussion and Conclusion
In this study, the secondary ARF-induced aggregated bubbles, which were located at the far-field of the vessel, would narrow down the pathway of flowing MBs and the high velocity core of the flow would be shifted during FUS transmission.
Rychak et al previously reported the correlation between the size of aggregated bubbles and acoustic pressure, MBs concentration, and flow velocity by video microscopy [3]. In our work, we found that larger displacement generally occurred with higher acoustic pressure, higher MB concentration, and slower flow velocity. Higher acoustic pressure produced stronger secondary ARF and accordingly led to larger aggregated bubbles and larger influence on flow pattern. Microbubbles with more condensed concentration presented a closer distance with each other and were with a higher possibility of forming large-sized aggregated bubbles. Lower flow velocity could increase the opportunity of fixing the aggregated bubbles at the same place and increase the displacement of high velocity core. Nevertheless, the displacements might also demonstrate relatively small values with certain conditions. For example, with MB concentration of 1.0%, the large-sized aggregated bubbles would spread along the chamber wall instead of fixing at a certain position [4]. Thus, the maximum displacement appeared in 0.5% rather than in 1%.
In conclusion, we verified the feasibility of using PC-MRI to evaluate the displacement of high velocity core in a chamber with flowing MBs. By measuring the displacement, the secondary ARF effect plus the size of aggregated bubbles might possibly be quantified. In the future, a systematic investigation will be conducted to validate the relationship between the measured displacement and the size of aggregated bubbles and the drug load in a drug delivering study.
Acknowledgements
Center for Advanced Molecular Imaging and TranslationReferences
- Dayton et al, A Priliminary Evaluation of the Effects of the Primary and Sondary Radiation Forces on Acoustic Contrast Agents, IEEE TRANSACTIONS ON ULTRASONICS, fERROELECTRICS, AND FREQUENCY CONTROLL, 1997, 1264-1277
- Dayton et al, Acoustic radiation force in vivo: A mechanism to assist targeting of microbubbles, Ultrasound in Medicine and Biology,1999, 1195-1201
- Rychak et.al, Acoustic Radiation Force Enhances Targeted Delivery of Ultrasound Contrast Microbubbles: In Vitro Verification, IEEE Transactions on Ultrasonics, Ferroelectrics, and Frequency Control, 421-432,2005
- Masuda et al, Observation Of Flow Variation In Capillaries Of Artificial Blood Vessel By Producing Microbubble Aggregations, Proceedings of the Annual International Conference of the IEEE Engineering in Medicine and Biology Society, EMBS,2012, 2064-2067
Figures