1490
Detection of Acoustic Radiation Force-Induced Aggregated Bubbles by Velocity and Vorticity Maps1Biomedical Engineering and Environmental Sciences, National Tsing Hua University, Hsinchu, Taiwan, 2Center for Advanced Molecular Imaging and Translation, Chang Gung Memorial Hospital, Taoyuan, Taiwan, 3Electrical Engineering, Chang-gung University, Taoyuan, Taiwan, 4Physical Medicine and Rehabilitation, National Taiwan University Hospital, Taipei, Taiwan, 5Division of Medical Engineering Research, National Health Research Institutes, Miaoli, Taiwan
Synopsis
The aim of this study was to real-time localize the occurrence of secondary ARF and the aggregated bubbles by velocity and vorticity maps. During FUS transmission, the flow velocity and vorticity downstream to the FUS focus increased substantially. By observing the pixel-wise flow behavior in a scatter plot with information of velocity and vorticity, the position of aggregated bubbles could be localized in the regions with decreased velocity and vorticity. In conclusion, we verified the feasibility of using phase-contrast MRI to real-time detect secondary ARF and aggregated bubbles by combining pixel-wise velocity and vorticity information.
Introduction
The acoustic radiation force (ARF) induced by transmitting focused ultrasound (FUS) to microbubbles (MBs) with was well-known as a scheme for localizing drug delivery. The primary ARF can can propel aggregated MBs to the far-field of a vessel while the secondary ARF aggregates MBs to form a large size bubbles [1,2]. In the presence of secondary ARF, we hypothesize that the aggregated bubbles could be seen as a barrier of flow and altered the local flow velocity and vorticity. In this study, we adopted phase-contrast MRI (PC-MRI) to evaluate the changes of flow velocity and vorticity nearby the aggregated bubbles. We aim to real-time localize the occurrence of secondary ARF and the aggregated bubbles.Methods
All images were acquired with PC-MRI (TR/TE= 64.7/12.2 ms, pixel size=0.31x0.31x1 mm3, pixel bandwidth=260 Hz/pixel, flip angle=10 , three-directional velocity encoding Venc=6 cm/s, temporal resolution=8.3 s) in a 7-Tesla scanner (ClinScan, Bruker). The pixel-wise vorticity was calculated by:
$$$ 𝐷𝝎/𝐷𝑡= 𝜕𝝎/𝜕𝑡+(𝒖∙𝛻)𝝎 $$$ (1),
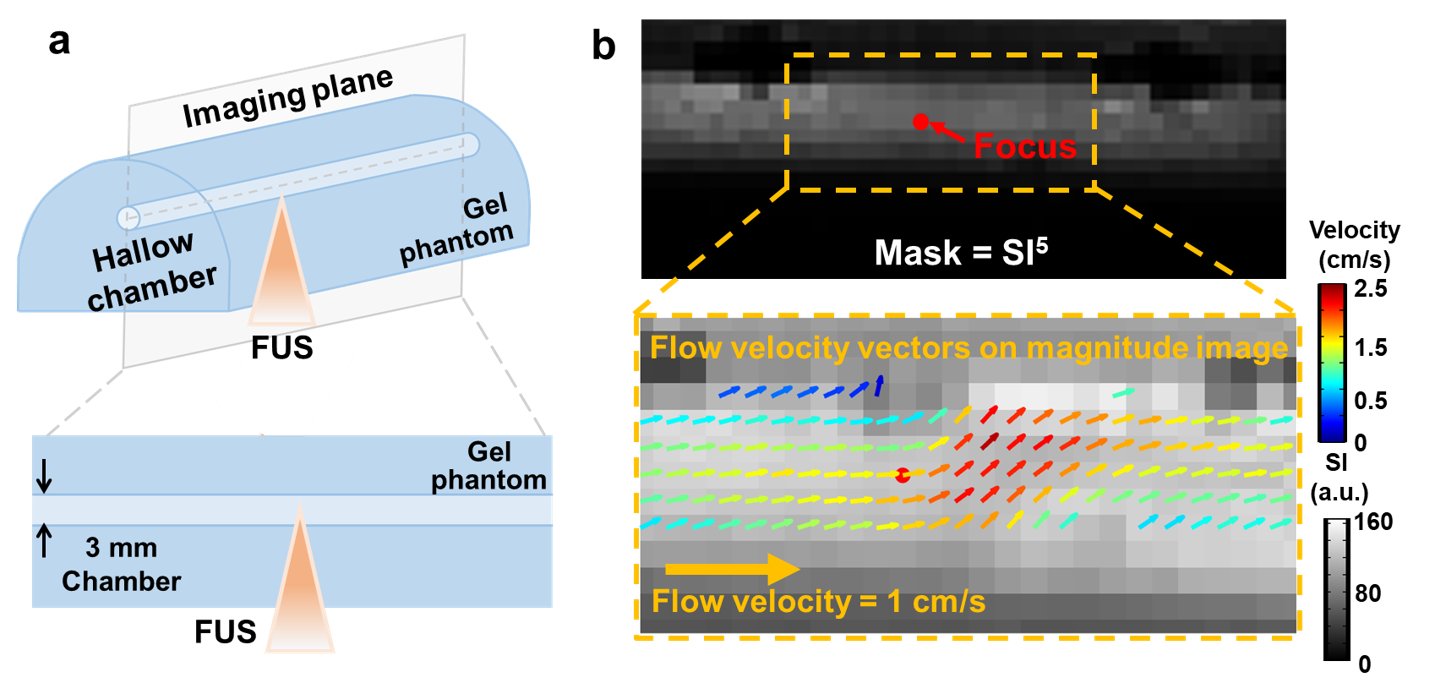
where 𝝎 is voritcity and 𝒖 is flow velocity. Figure 1a demonstrates the experimental setup. Diluted MBs (lipid shell with C3F8, mean diameter=1.25 µm (Number%), Trust Bio-sonics) with concentration of 1.0% and 0.5% were injected with a velocity=1 cm/s into a hallow chamber (diameter=3 mm) in a gel phantom. Continuous FUS pulses with acoustic pressure=100 kPa were transmitted from a single-element probe (central frequency=1 MHz, diameter=2.5 cm, curvature=2.0 cm, RK300, FUS Instruments). The MR imaging plane were prescribed parallel to the chamber of phantom. To automatically outline the chamber wall, the signal intensity (SI) of a magnitude image was calculated to a power of 5 to enhance the fluid signals in the chamber (top, Figure 1b). The top 5% of SI5 (P95) was set as a threshold. The pixels with SI5>P95 and localized between 3 mm-upstream and 4.5 mm-downstream to the focus were selected as the region-of-interest (ROI) to calculate velocity and vorticity maps. The pixels in the ROI were coded with pseudo-color vectors to denote pixel-wise velocity and flow direction (bottom, Figure 1b).
Results
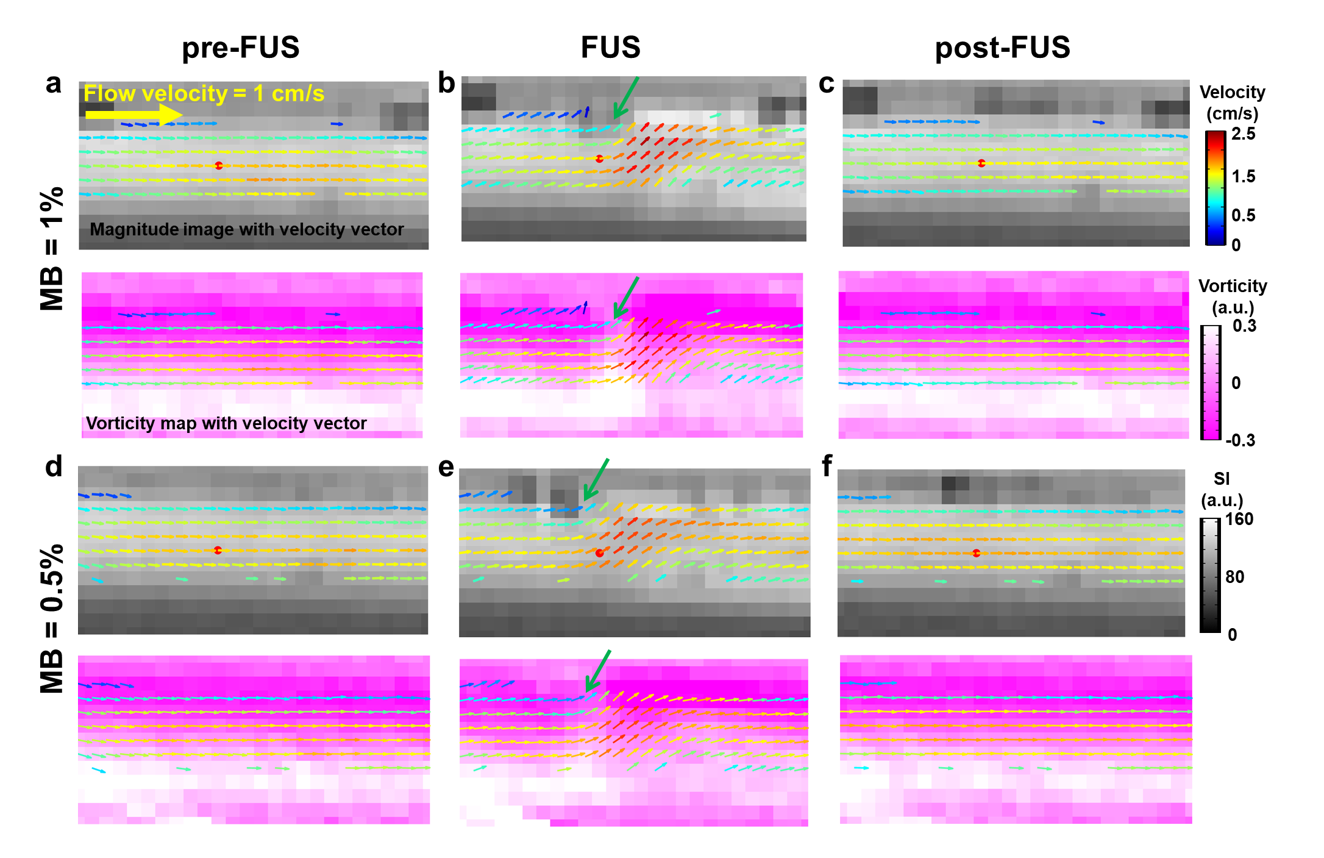
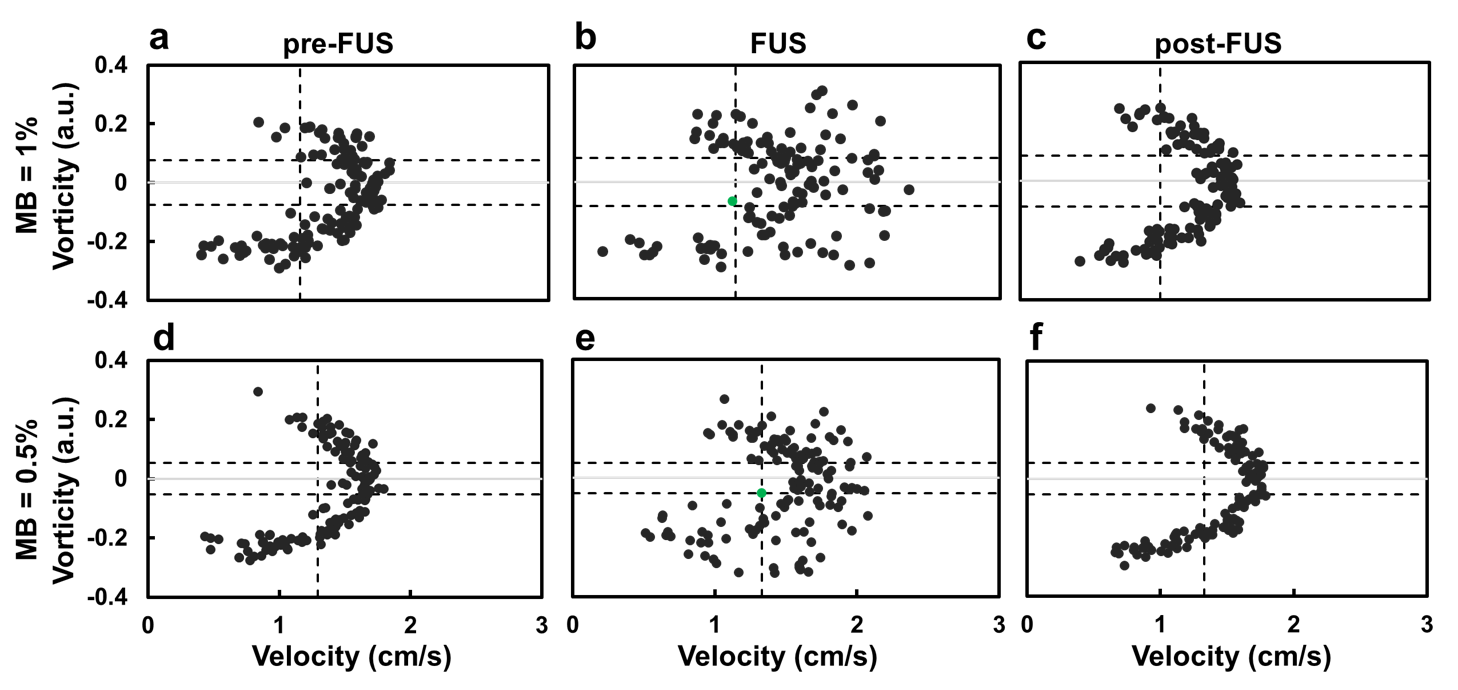
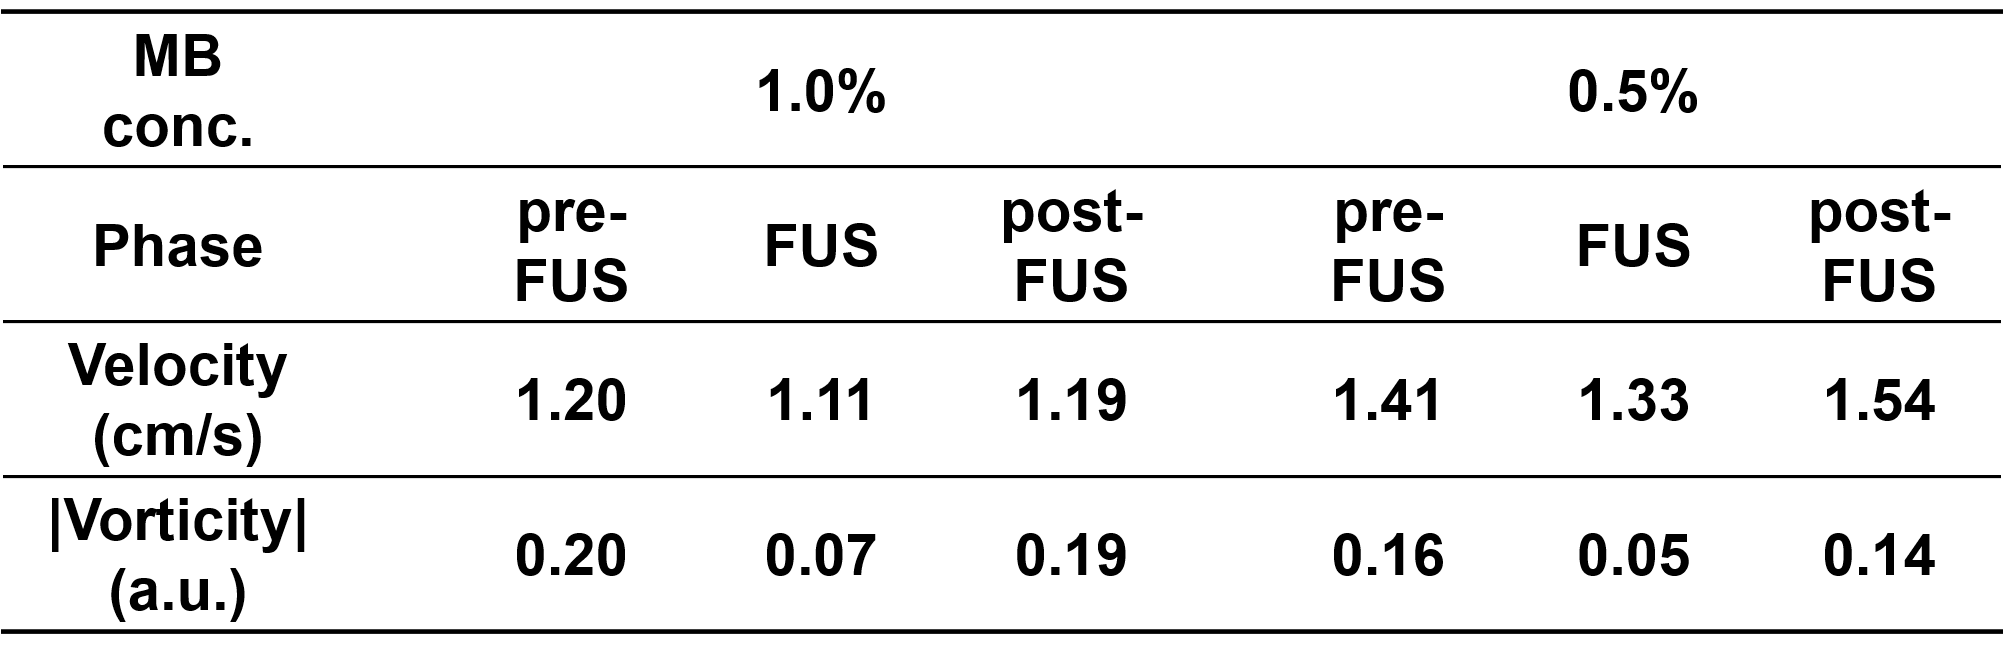
As shown in Figure 2, pixel-wise velocity vectors overlapped on magnitude images (top) and vorticity maps (bottom) at the phases of pre-FUS, FUS (after 20 s of FUS transmission) and post-FUS for MBs concentration of 1.0% and 0.5%. At pre- and post-FUS, velocity vectors could be seen as lamina flow. During FUS transmission, the flow velocity and vorticity downstream to the FUS focus (red dot) increased substantially (Figures 2b and 2e). The downstream velocity vectors also changed their flow directions substantially. Figure 3 presents the pixel-wise flow behavior by a scatter plot with information of velocity and vorticity. To localize the aggregated bubbles, we determined thresholds for velocity and vorticity, respectively. With MB concentration=1% and 0.5%, the thresholds were P25 and P30 for velocity (vertical dash-line in Figure 3) and P30 and P20 for |vorticity| (two horizontal dashed-lines in Figure 3). With the demarcation of aforementioned thresholds, only one single pixel shown in the quadrant with low velocity and low vorticity in the phase of FUS, as indicated by green dots in Figures 3b and 3e. The single pixel was considered as the position of aggregated bubbles and also indicated by green arrows in Figures 2b and 2e. Table 1 summarizes the evolution of velocity and vorticity of the aggregated bubbles at different phases.Discussion and Conclusion
In this study, we used PC-MRI to real-time detect the position of secondary ARF and aggregated bubbles by velocity and vorticity maps. Previous studies reported that the maximum diameter of aggregated bubbles was about 0.5 mm [4,5], which equaled to 1~2 pixel(s) in our study. Therefore, a series of threshold values of velocity and vorticity were screened till only 1~2 pixel(s) shown in the quadrant with low velocity and low vorticity. The position of aggregated bubbles thus could be localized for different MB concentrations by combing information of velocity and vorticity. We also found that the aggregated bubbles was at downstream to FUS focus in MB=1.0% but upstream in MB = 0.5%. This could be attributed to the FUS beamwidth=20 mm, which might lead to a spatial shift of the aggregated bubbles. In conclusion, we verified the feasibility of using PC-MRI to real-time detect secondary ARF and aggregated bubbles by combining pixel-wise velocity and vorticity information. In the future, the feasibility of the proposed method will be conducted in in vivo experiments to provide helpful information for drug delivery study.Acknowledgements
Center for Advanced Molecular Imaging and TranslationReferences
- Dayton et al, A Priliminary Evaluation of the Effects of the Primary and Sondary Radiation Forces on Acoustic Contrast Agents, IEEE TRANSACTIONS ON ULTRASONICS, fERROELECTRICS, AND FREQUENCY CONTROLL, 1997, 1264-1277
- Dayton et al, Acoustic radiation force in vivo: A mechanism to assist targeting of microbubbles, Ultrasound in Medicine and Biology,1999, 1195-1201
- Rychak et al, Acoustic radiation force enhances targeted delivery of ultrasound contrast microbubbles: In vitro verification, IEEE Transactions on Ultrasonics, Ferroelectrics, and Frequency Control,2005, 421-432
- Kohji Masuda et al, Effect of Existence of Red Blood Cells in Trapping Performance of Microbubbles by Acoustic Radiation Force, Japanese Journal of Applied Physics 50, 2011, 07HF11
- Kohji Masuda et al, Observation of flow variation in capillaries of artificial blood vessel by producing microbubble aggregations, Engineering in Medicine and Biology Society (EMBC), 2012 Annual International Conference of the IEEE
Figures