Jong-Min Kim1,2, Chulhyun Lee3, Young-Seung Jo1, Han-Jae Chung1,2, Seong-Dae Hong1,2, You-Jin Jeong1,2, Jeong-Hee Kim4, and Chang-Hyun Oh1,2
1Department of Electronics and Information Engineering, Korea University, Seoul, Republic of Korea, 2ICT convergence technology for Health&Safety, Korea University, Sejong, Republic of Korea, 3Bioimaging Research Team, Korea Basic Science Institute, Chungbuk, Republic of Korea, 4Research Industrial for Advanced Industrial Technology, Korea University, Sejong, Republic of Korea
Synopsis
Because the multiple Fast Field Echo (mFFE) is rich in contrast
manipulation, such as, in water-fat, susceptibility, conductivity, and
temperature imaging, it is well suited to guide the thermal treatment. In this
study, we sought to investigate the feasibility of the mFFE for monitoring and
guidance of HIFU treatment in ex-vivo swine tissue. To demonstrate this study,
we present the conductivity, temperature, and susceptibility mapping results. We
have shown that the mFFE is very useful for guidance and monitoring of the HIFU
treatment. Simultaneous temperature, conductivity, and susceptibility mapping
has been tried using the mFFE sequence and its utility has been shown in this
paper.
Introduction
In MR-HIFU, the roles of MR guidance are to target the therapy,
monitor the progress of the therapy, and assess its effectiveness1. Because
the multiple Fast Field Echo (mFFE) is rich in contrast/mechanism2-5, the mFFE is well suited to perform these roles. In addition to its already-proven capability of high contrast in tissue discrimination, we have found that mFFE is good for finding the focal spot by using the T2 change during HIFU treatment. The imaging results show that this proposed method can be useful in guidance of HIFU treatment as well as in monitoring its effectiveness. Its utility to shown by comparing the imaging results including the temperature mappig results.Metertials&Methods
An ex-vivo swine tissue sample was imaged
using a 3.0 T MRI (Philips, Achieva, The Netherlands) scanner equipped with a
HIFU system (EfoE Ultrasonics, Inc., South Korea, center frequency=2.31 MHz).
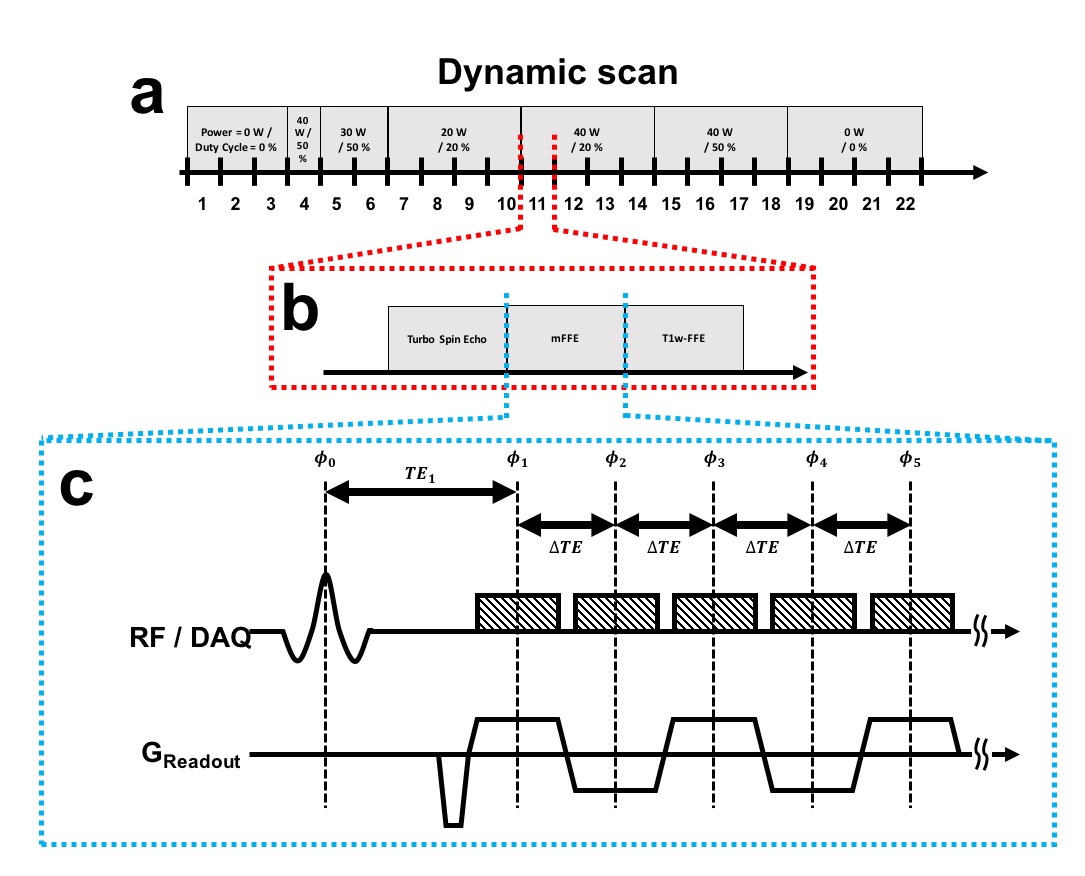
The experimental setup is shown in Fig. 1. The image set has Turbo Spin Echo
(TSE) (for the focal spot localization)6, mFFE, and T1-weighted Fast Field
Echo (T1w-FFE; for the PRF method). The TSE parameters were
TR/TE=500/23 ms, Flip Angle (FA)=90/180o, and TSE-factor=8. The mFFE parameters were TR/TE1/ΔTE=50/2.0/1.9 ms, FA=18o, and the number of echoes=5. The T1w-FFE parameters were TR/TE=200/10
ms, and FA=40o. All scans were performed using voxel size=2×2×8 mm3, FOV=256×256×72 mm3, number of slices=9. A commercial SENSE-NV-16
RF coil was used for signal reception.
The temperature change by using the mFFE, ΔTmFFE;n-th echo, was calculated as:
$$ΔT_{mFFE;n-th\,echo}=\frac{ΔΦ_n}{γ·α·B_0·(TE_1+(n-1)·ΔTE)}$$
where ΔΦn is the temperature-induced phase difference of
n-th echo, γ is the gyromagnetic ratio, α is the PRF coefficient (assumed to be 0.01
ppm/oC), and B0 is the main magnetic field strength.
Laplacian operation in
conductivity mapping and background bias removal in QSM were performed by
using Kalman filter7. QSM was conducted using a dipole inversion was
done using threshold based k-space division8-9. The conductivity map
is acquired by the phase of the H+-field measurement
retrieved from the Helmholtz equation ($$$σ=\frac{\nabla^2e^{iθ(H^+)}}{ωμe^{iθ(H^+)}}$$$)10. The acquired MR
images were processed by MATLAB 2017b (Mathworks, USA).
Results
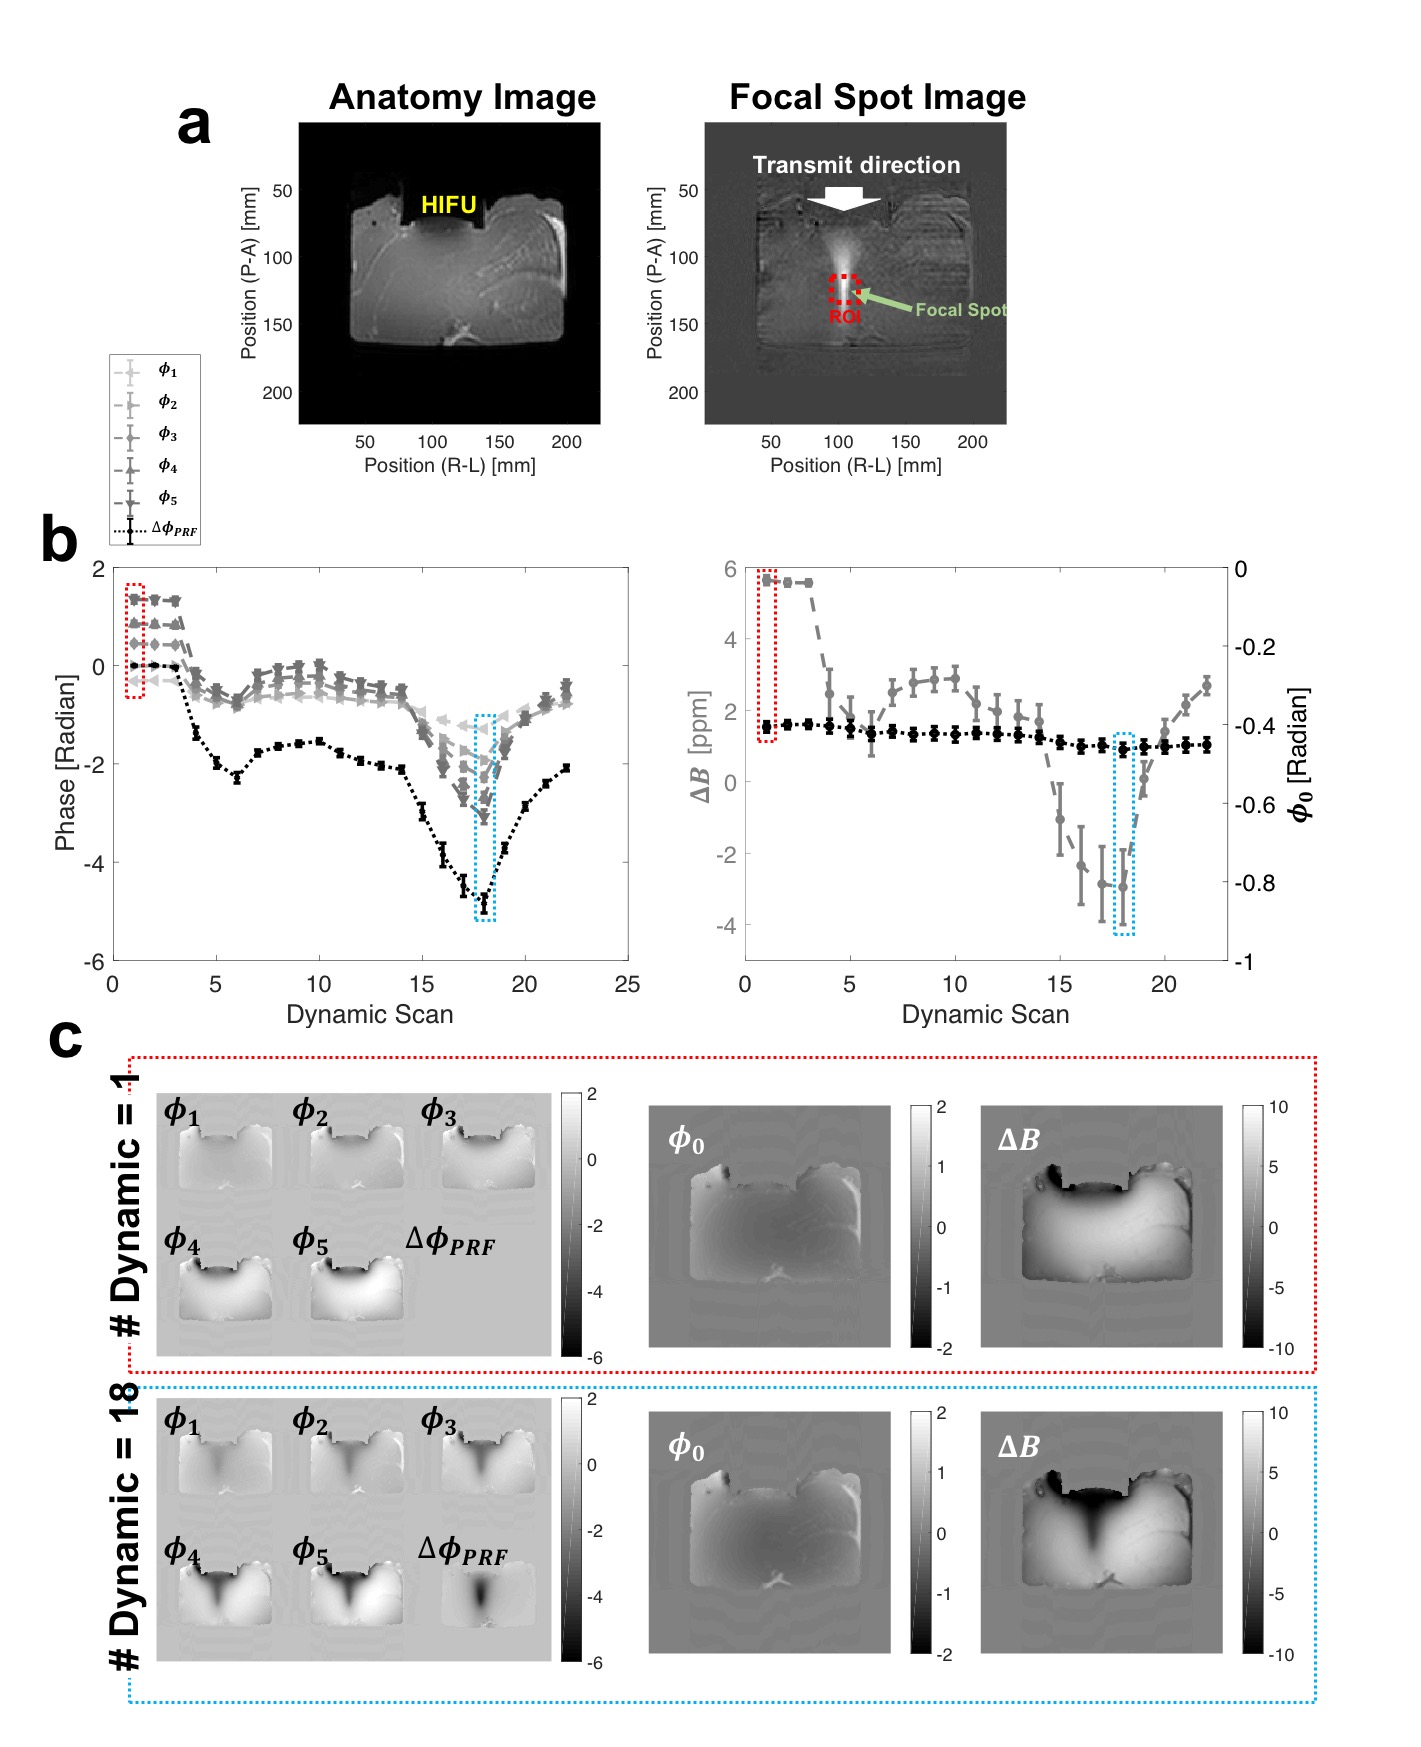
Figure 2a shows the structure and
focal spot images of an ex-vivo
swine tissue sample that can be
displayed at the position of HIFU and its focal spot. The mFFE phase maps at TE
= 2 (Φ1), 3.9
(Φ2),
5.8 (Φ3),
7.7 (Φ4), and 9.6 (Φ5) ms,
T1w-FFE phase-change map (ΔΦPRF), and the calculated Φ0 and ΔB within an ROI
versus the dynamic scan are plotted in Fig. 2(b). The
examples of the Φ1···Φ5, ΔΦPRF, and the calculated Φ0 and ΔB at 1st and 18th dynamic
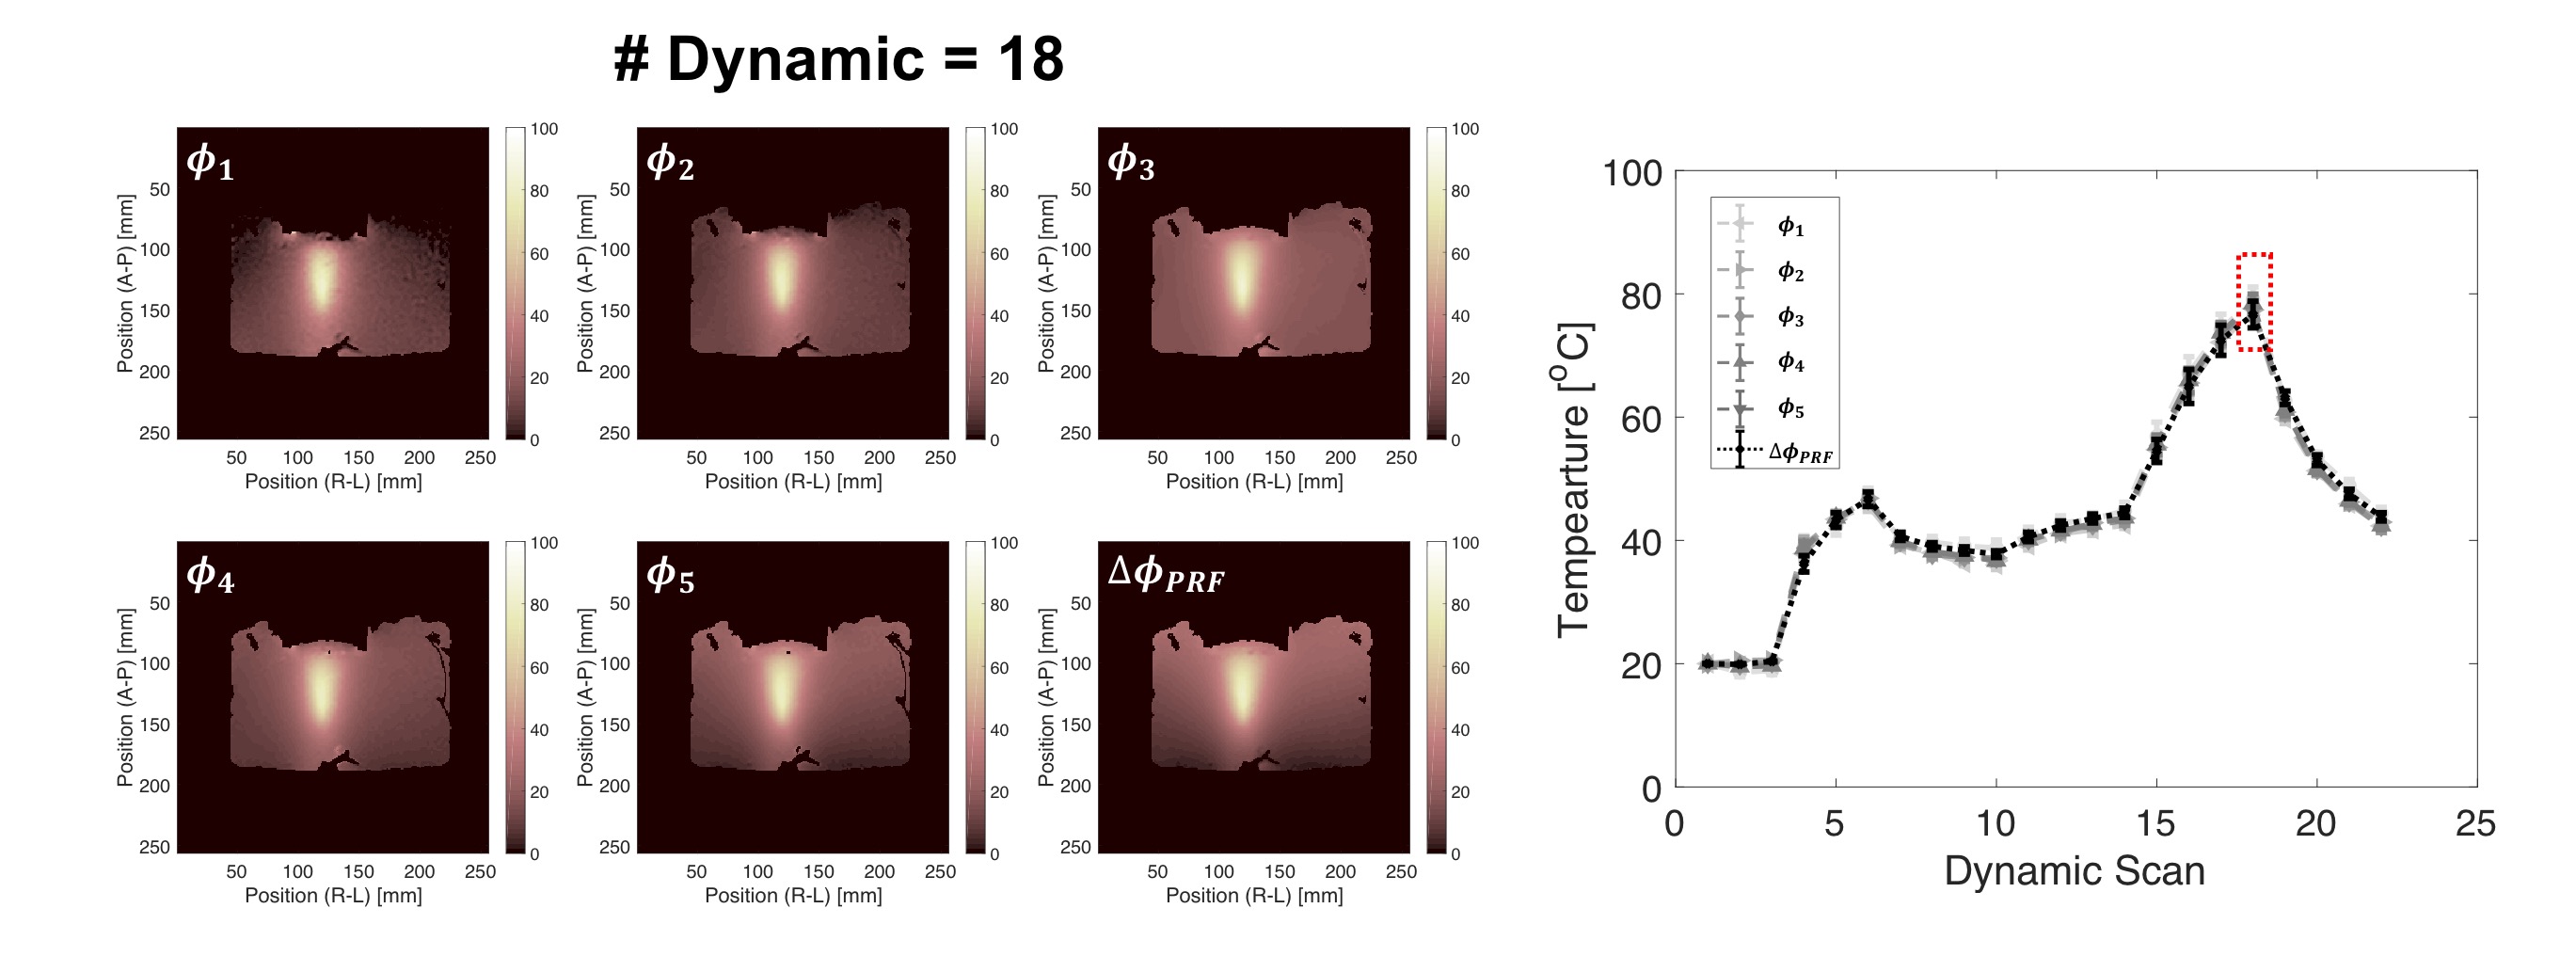
scans are shown in Fig. 2(c). The representative temperature
distributions and its values within an ROI versus the dynamic scan
estimated from Φ1···Φ5, and ΔΦPRF are shown in Fig 3. Root-mean-square-errors between
temperatures estimated from Φ1···Φ5, and ΔΦPRF are
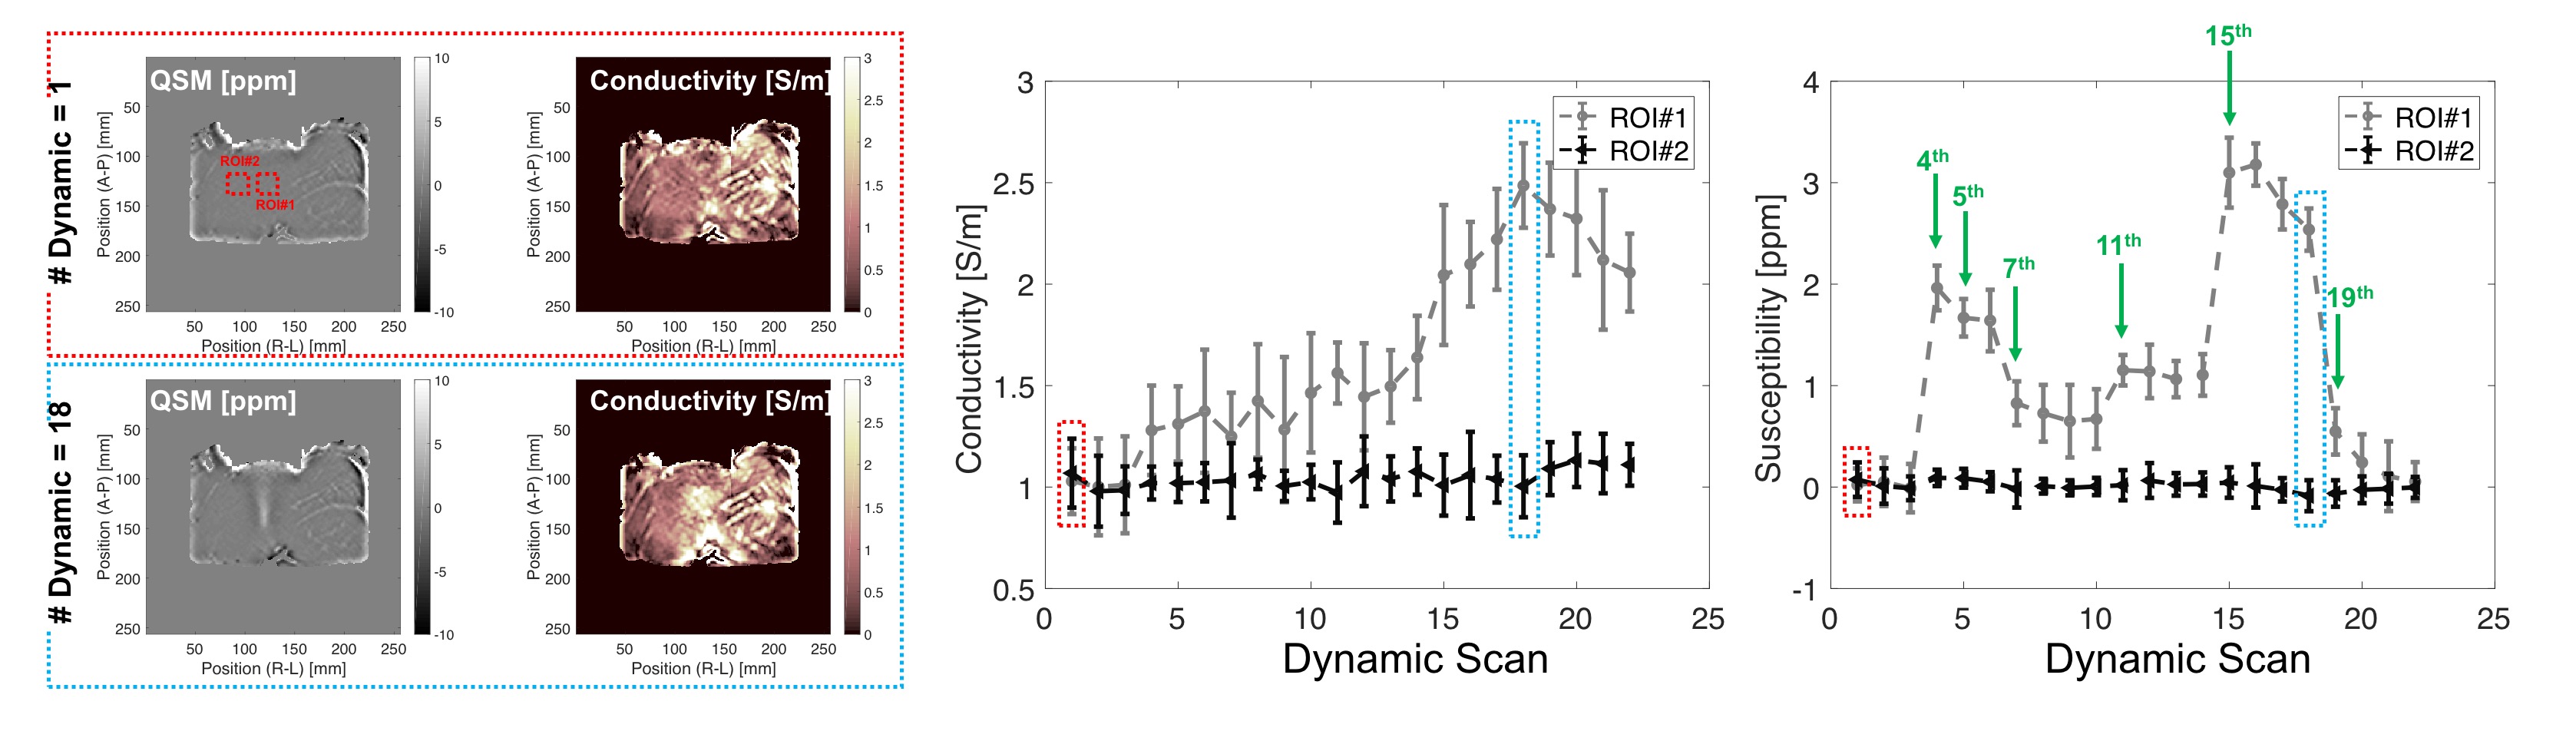
1.27, 1.44, 1.14, 1.17, and 1.14, respectively. Figure 4 shows that the
representative conductivity and susceptibility distributions and its values
within an ROI versus the dynamic scan. The conductivity and susceptibility
values at the focal spot increase with heating, but those not at the focal spot
are retained. Especially, at 4th, 7th,
11th, 15th, and 19th dynamic scans, the
susceptibility value changed rapidly. Before starting the 4th, 7th,
11th, 15th, and 19th dynamic scans, the HIFU
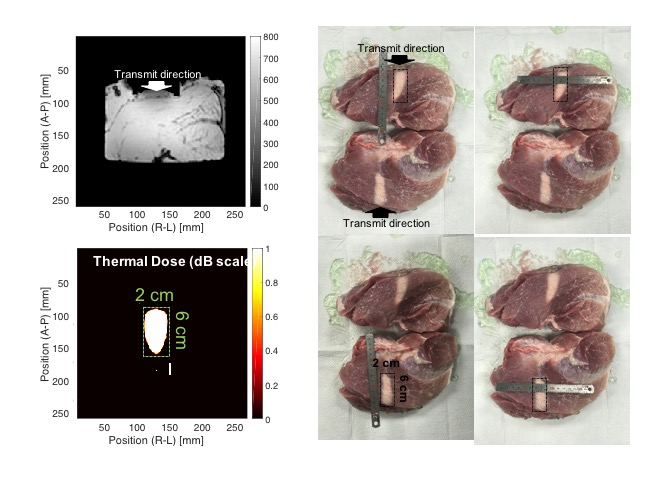
power or duty cycle was changed. Figure 5 shows the thermal dose map, which was
calculated by temperature map estimated from Φ511, and the pictures of swine
tissue after heating. The size and shape of heated area in both cases are very
similar. Discussion&Conclusions
We have shown that the mFFE is very useful for guidance and
monitoring the HIFU treatment and it has been demonstrated that the proposed method
is useful for simultaneous temperature, conductivity, and
susceptibility mapping. The contrasts and parameters extracted by the mFFE in
our research are the followings: (1) the temperature map obtained by using the
mFFE phase is useful and identical to those obtained by using T1w-FFE phase; (2)
in HIFU application, the Kalman filter can be successfully applied to extract
the parameters from the mFFE; (3) the susceptibility has changed during the
application of the HIFU power. Furthermore, with this approach, it has been
noted that a TE approximately equal to the tissue T2* value where we can achieve optimal temperature
sensitivity. Although the utilities of
most of the contrasts and parameters extracted by the mFFE have
yet to be demonstrated, we expect that this method can be incorporated into the
current clinical workflow of MR-HIFU therapies.Acknowledgements
This work was supported by the Technology Innovation Program(#10076675) funded by the Ministry of Trade, Industry & Energy (MOTIE, Korea). Authors thank Professor Jongho Lee in Seoul National University for lending the HIFU system.
References
1. Pauly KB, et al., MR-guidance of HIFU therapy. EMBC 2009;
141-144.
2. Kim J-M, et al. Comparison of temperature mapping methods
using proton resonance frequency shift and T1 in 3-T and 7-T MRI. ISMRM 2017;
2588.
3. Jintang T, et al., Feasibility of T2*-weighted (T2*W) in the
assessment of non-perfused volume (NPV) inside uterine fibroids response to
MR-guided high intensity focused ultrasound (HIFU) ablation. ISMRM 2015; 4031.
4. Mulken RV, et al., Tissue temperature monitoring with multiple gradient-echo
imaging sequence. J Magn Reson Imag. 1998; 8(2): 493-502.
5. Liu H-L, et al., Hemorrhage detection during focused-ultrasound
induced blood-brain-barrier opening by using susceptibility-weighted magnetic resonance
imaging. Ultrasound in Med & Biol. 2008;34(4): 598-606.
6. Hynynen K, et al., Temperature monitoring in fat with
MRI. Magn Reson Med. 2000; 43(6): 901-904.
7. Julier, SJ and Jeffrey KU. A new extension of the Kalman filter
to nonlinear systems. Int Symp Aerospace/Defense Sensing Simul and Controls.
1997; 3(26): 182-193.
8. Schweser F, et al. Quantitative imaging of intrinsic magnetic
tissue properties using MRI signal phase: An approach to in vivo brain iron metabolism.
Neuroimage 2011; 54(4): 2789-807.
9. Shmueli K, et al. Magnetic susceptibility mapping of brain
tissue in vivo using MRI phase data. Magn Reson Med. 2009; 62(6): 1510-1522.
10. Katscher U, et al. Recent progress and future challenges in MR
electric properties tomography. Comput Math Methods Med. 2013; 546-562.
11. McDannold N, et al. MRI evaluation of thermal ablation of tumors
with focused ultrasound. J Magn Reson Imag. 1998; 8(1): 91-100.