1482
Inertial Cavitation Induced Magnetic Resonance Signal Changes in a Rat Model1Department Of Biomedical Engineering And Environmental Sciences, National Tsing Hua University, Hsinchu City, Taiwan, 2Center for Advanced Molecular Imaging and Translation, Chang Gung Memorial Hospital, Taoyuan city, Taiwan, 3Department Of Electrical Engineering, Chang-gung University, Taoyuan city, Taiwan, 4Department Of Physical Medicine And Rehabilitation, National Taiwan University Hospital, Taipei city, Taiwan, 5Division Of Medical Engineering Research, National Health Research Institutes, Miaoli city, Taiwan
Synopsis
We aim to real-time monitor the inertial cavitation (IC)-induced signal intensity (SI) changes in the presence of microbubbles and explore the correlation between the extent of IC-induced SI changes and the location of blood–brain barrier opening in a rat model. The computed |slope| map illustrated the territory of tissue with substantial SI changes and was consistent with the difference map (calculated from T1WI with and without Gd) and Evens Blue dyed region. In conclusion, we verified the feasibility of using FLASH sequence to distinguish the location of BBB-opening through the computed |slope| map in a rat model.
Introduction
Blood–brain barrier (BBB) opening can be induced by microbubbles (MBs)-based cavitation.1,2 Previous studies demonstrated that the inertial cavitation (IC) would cause signal intensity (SI) changes in spin echo and gradient echo images in a phantom study3,4 for monitoring IC during FUS transmission. The aim of this study was to employ gradient echo sequence to explore the correlation between the extent of IC-induced SI changes and the location of BBB-opening in a rat model.Methods
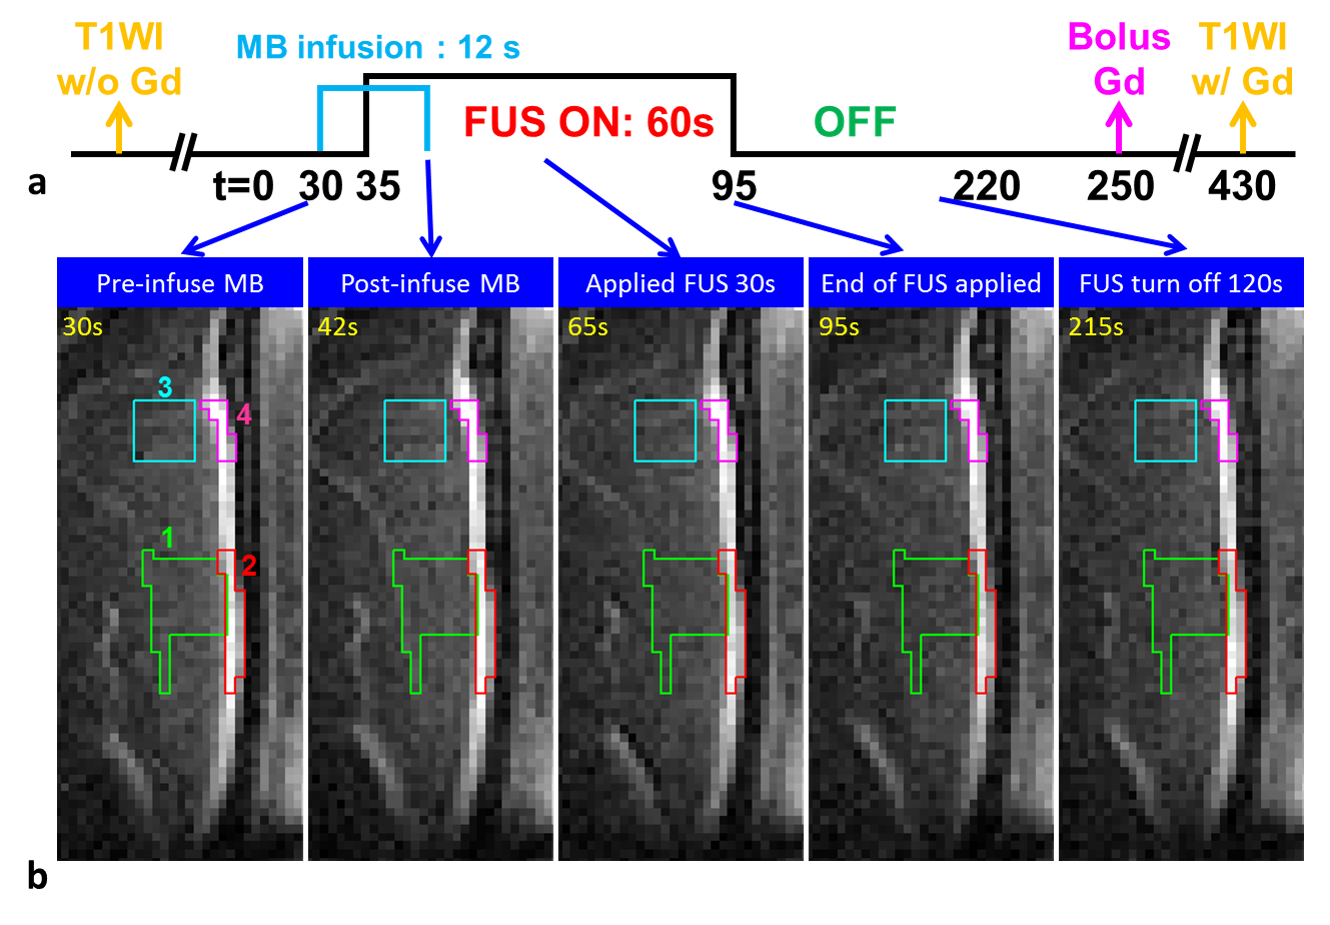
Eight normal adult male Sprague-Dawley rats (5 experimental rats with FUS pulses, 3 control rats without FUS pulses) were infused with 0.2 ml of 0.25% MBs solution (lipid shell with C3F8, mean diameter=1.25 μm, concentration=(4.36±0.32)×1010 droplets/mL, Trust Bio-sonics inc.)5 in infusion rate=1 mL/min . FUS pulses were transmitted by a single-element transducer (RK300, FUS Instruments) with pulse repetitive frequency=10 Hz, duty cycle=10%, and acoustic pressure=0.8 MPa. We performed fast low-angle shot (FLASH) sequence in a 7-Tesla MR scanner (ClinScan, Bruker) with parameters as follows: TR/TE=6.7/3.8 ms, voxel size=0.23x0.23x0.7 mm3, flip angle=20°, temporal resolution=0.7 s, measurements=316 (220 s). All images were acquired at the focal plane and perpendicular to ultrasound beams. The pixel-wise slope of SI changes between t=35~55 s was computed as a |slope|-map after performing a temporal median filter (window=20 frames) to reduce signal noise. Four regions-of-interest (ROI) were determined for analysis of normalized SI: tissue and central sinus ROIs around focus (ROI 1 and 2), tissue and sinus ROIs at 4.7 mm-off focus (ROI 3 and 4). The normalized SI was defined as (SI/SIpre-FUS)x100%. T1WI without and with Gd were also acquired.Results
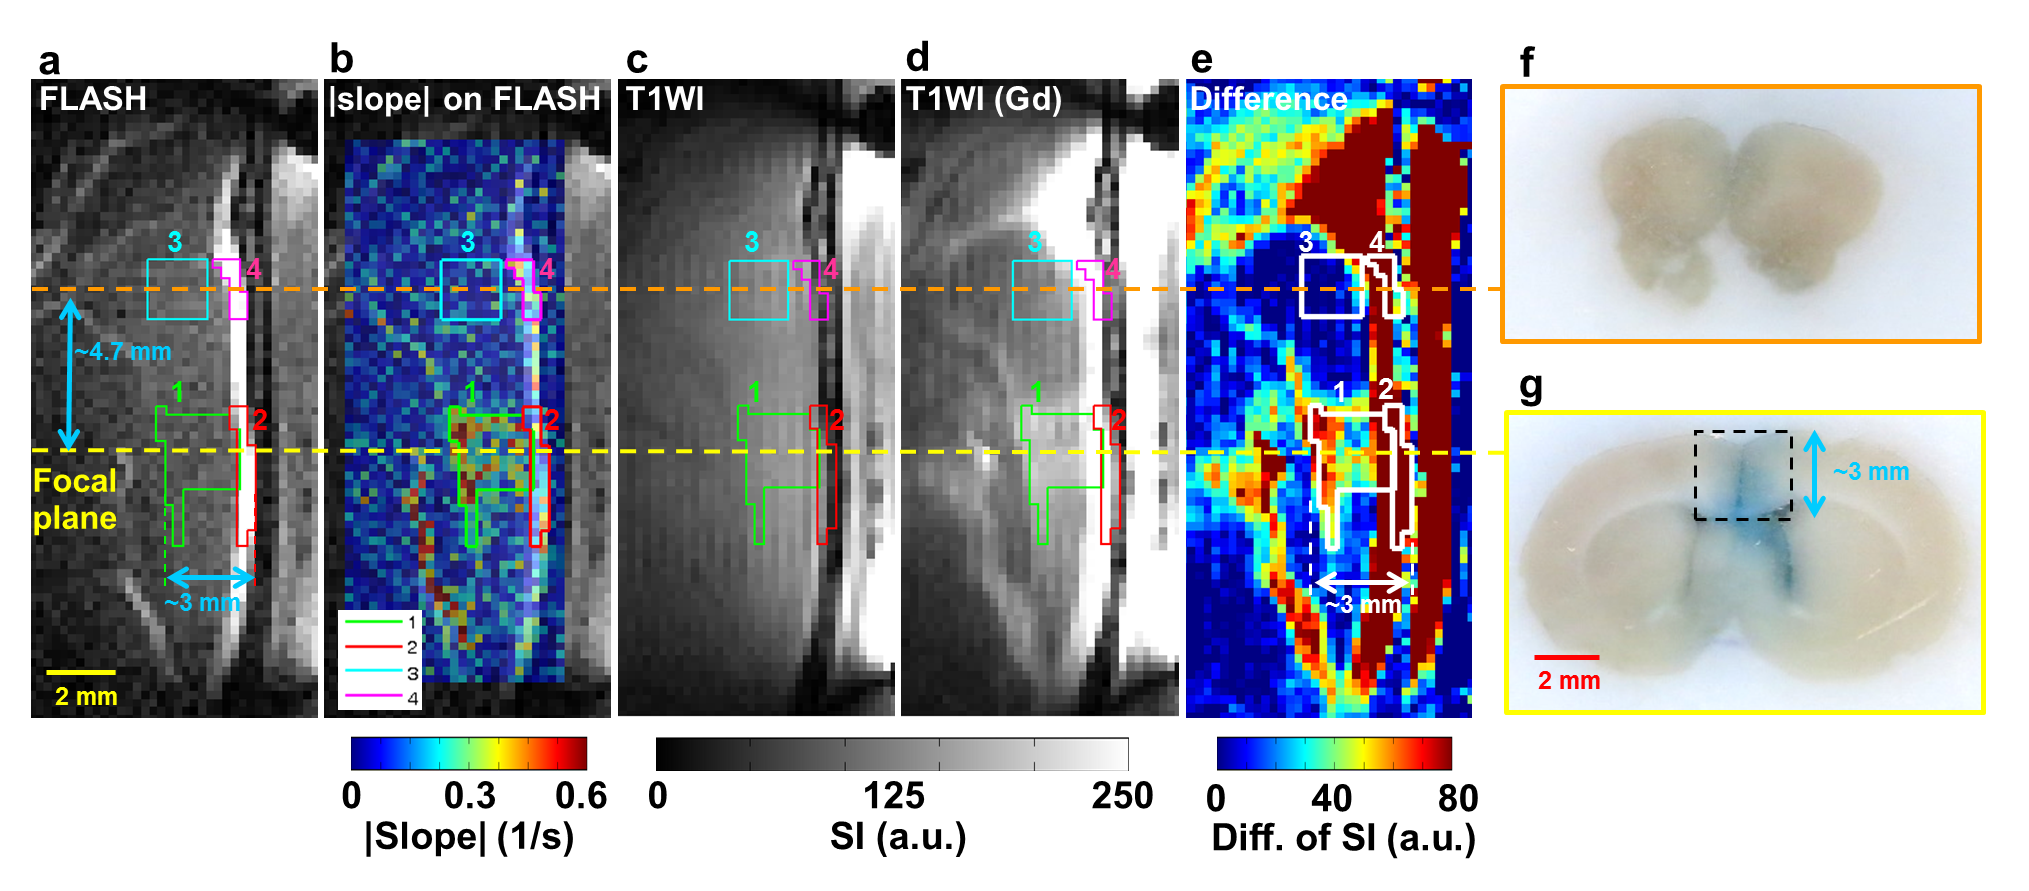
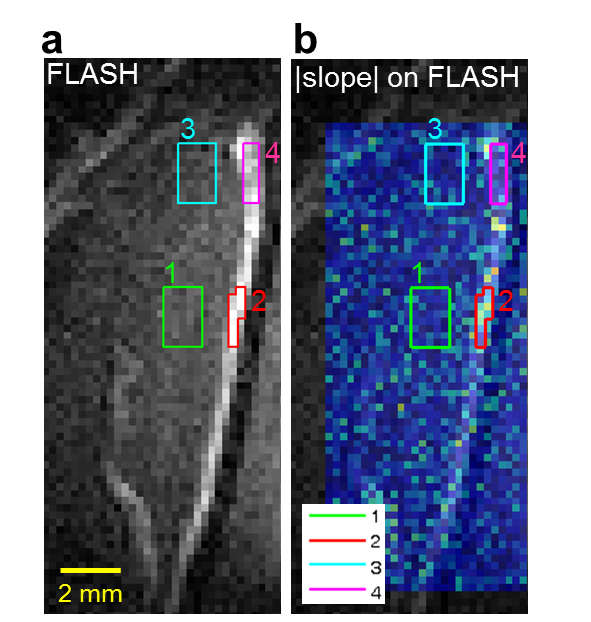
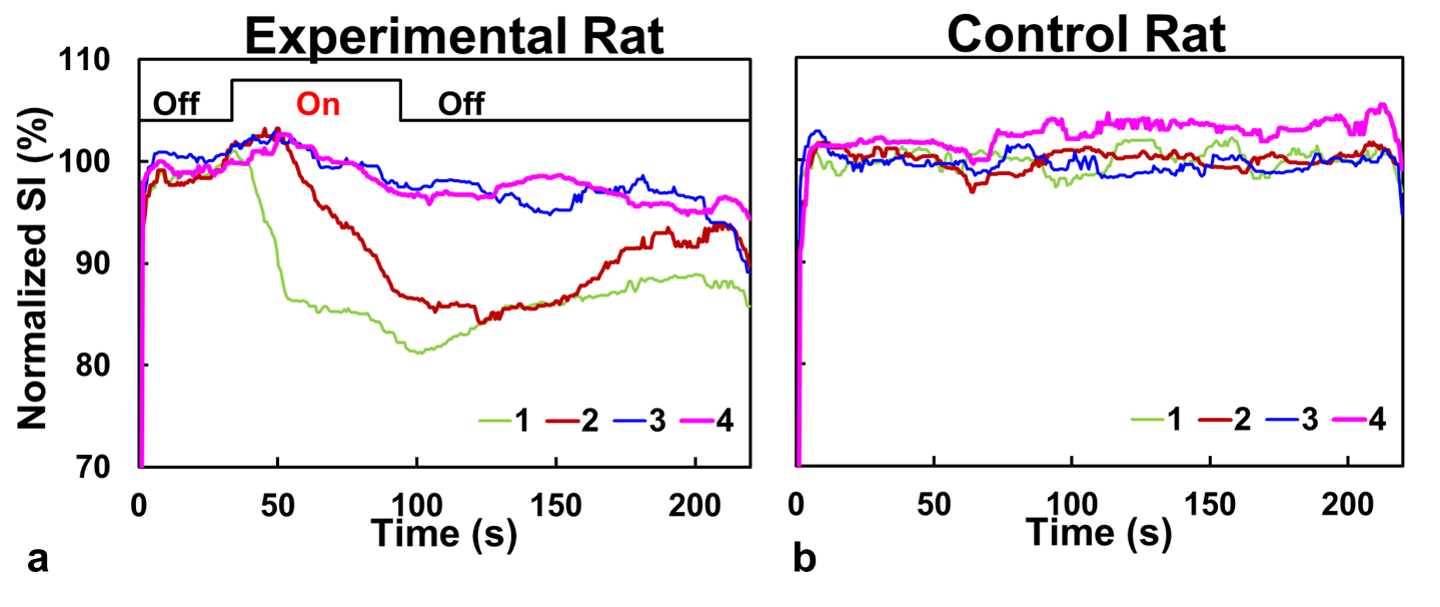
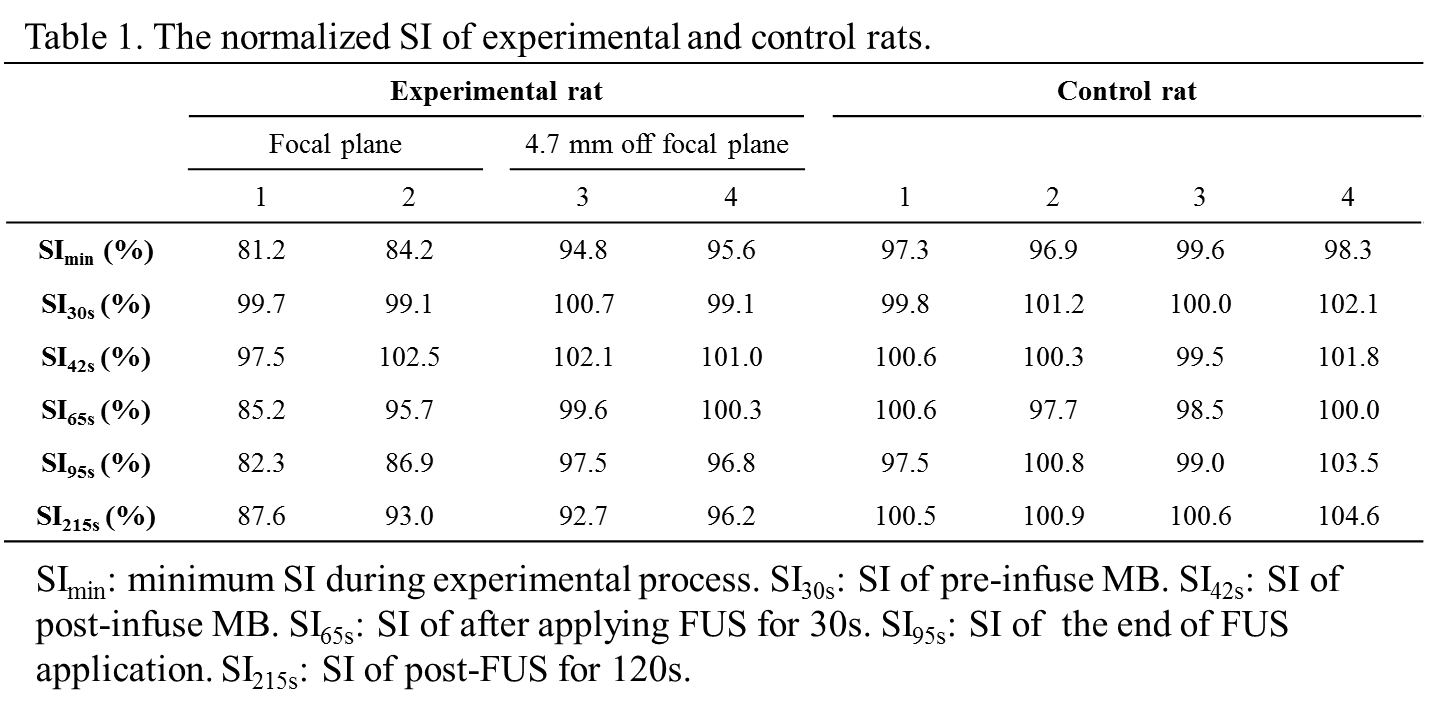
A series of FLASH images of one experimental rat were presented in Figure 1b and Figure 2a (at 55s). The computed |slope| map illustrated the territory of tissue with substantial SI changes (ROI 1, Figure 2b). The high |slope| region was consistent with the difference map (calculated from T1WI with and without Gd) (Figures 2c-2e). The region at 4.7 mm-off focus did not show distinct signal changes (ROI 3, Figures 2a-2e). Compared to the region without leakage of Evens Blue (EB) in the histology at off-focus (Figure 2f), the region at focal plane presented substantial leakage of EB, revealing the IC-induced BBB-opening (Figure 2g). Without exposure of FUS, the control rat presented no distinct signal changes on FLASH image and |slope| map (Figure 3). In Figure 4a, the time course of ROI 1 of an experimental rat decreased significantly upon FUS transmission, while ROI 2 demonstrated similar pattern of SI changes but with a time delay of around 15 s. As for ROIs 3 and 4, time courses showed no significant SI change. Figure 4b displays the SI of a control rat maintaining at approximately 100%. Table 1 summarizes the SI at several representative time points of 4 ROIs of all experiments.Discussion& Conclusion
In this study, FLASH sequence was employed to real-time monitor SI changes in a rat model. In experimental rat, distinct higher values in the |slope| map could be observed in brain tissue at focal plane. The consistency of the high slope region and the Gd-enhanced region as well as EB dyed region in histology implied that the computed |slope| map could properly indicate the territory of Gd-leakage and BBB-opening (dotted-line rectangle in Figure 2g). The SI changes upon FUS transmission could be attributed to two effects. First, the IC-induced flow disturbance led to intra-voxel dephasing. Second, transient vasoconstriction induced by FUS6-8 would result in increased flow velocity and transient blood-supply shortage on capillaries.9-11 In central sinus, if the flow velocity becomes higher than 0.5*slice thickness/echo time, the excited spins might flow out of imaging plane during echo time. Consequently, signal loss could occur because of the absence of excited spins during data sampling. As for brain tissue, vasoconstriction-induced intravoxel dephasing and the decreased blood volume due to transient blood-supply shortage might together lead to reduced SI. It was also worthy to note that because the vasoconstriction effect might persist 120 s after FUS sonication6, we observed the reduced SI did not recover to 100% till the end of MR acquisition. Compared to the Gd-enhanced T1WI, the computed |slope| map need no subtraction procedure and therefore could avoid position inconsistency due to motion. In conclusion, we verified the feasibility of using FLASH sequence to distinguish the location of BBB-opening through the computed |slope| map in a rat model. In the future, the influence of different FUS conditions on the computed |slope| map shall be clarified.
Acknowledgements
Center for Advanced Molecular Imaging and Translation, Chang Gung Memorial Hospital, Taoyuan, TaiwanReferences
1. Pouliopoulos AN, Bonaccorsi S, Choi JJ. Exploiting flow to control the in vitro spatiotemporal distribution of microbubble-seeded acoustic cavitation activity in ultrasound therapy. Physics in medicine and biology. 2014;59(22):6941.
2. Liu H-L, Fan C-H, Ting C-Y, Yeh C-K. Combining microbubbles and ultrasound for drug delivery to brain tumors: current progress and overview. Theranostics. 2014;4(4):432.
3. Lin SC CC, Wu CH, Wang CH, Kang ST, Yeh CK, Chen ES, Peng HH. Real-time monitoring of inertial cavitation effect on diluted microbubbles by MRI. In Proceedings of the 21st Annual Meeting of ISMRM, Salt Lake City, Utah, 2013. 2013:Abstract 1825.
4. Peng HH, Wu CH, Kang ST, Zhang JW, Liu HL, Chen WS, et al. Real‐time monitoring of inertial cavitation effects of microbubbles by using MRI: In vitro experiments. Magnetic resonance in medicine. 2017;77(1):102-11.
5. Fan C-H, Liu H-L, Ting C-Y, Lee Y-H, Huang C-Y, Ma Y-J, et al. Submicron-bubble-enhanced focused ultrasound for blood–brain barrier disruption and improved CNS drug delivery. PloS one. 2014;9(5):e96327.
6. Fan C-H, Lin W-H, Ting C-Y, Chai W-Y, Yen T-C, Liu H-L, et al. Contrast-enhanced ultrasound imaging for the detection of focused ultrasound-induced blood-brain barrier opening. Theranostics. 2014;4(10):1014.
7. Raymond SB, Skoch J, Hynynen K, Bacskai BJ. Multiphoton imaging of ultrasound/Optison mediated cerebrovascular effects in vivo. Journal of Cerebral Blood Flow & Metabolism. 2007;27(2):393-403.
8. Sheikov N, McDannold N, Sharma S, Hynynen K. Effect of focused ultrasound applied with an ultrasound contrast agent on the tight junctional integrity of the brain microvascular endothelium. Ultrasound in medicine & biology. 2008;34(7):1093-104.
9. Fan C-H, Liu H-L, Huang C-Y, Ma Y-J, Yen T-C, Yeh C-K. Detection of intracerebral hemorrhage and transient blood-supply shortage in focused-ultrasound-induced blood–brain barrier disruption by ultrasound imaging. Ultrasound in medicine & biology. 2012;38(8):1372-82.
10. Yang G-Y, Betz AL, Chenevert TL, Brunberg JA, Hoff JT. Experimental intracerebral hemorrhage: relationship between brain edema, blood flow, and blood-brain barrier permeability in rats. Journal of neurosurgery. 1994;81(1):93-102.
11. Orakcioglu B, Becker K, Sakowitz O, Unterberg A, Schellinger P. Serial diffusion and perfusion MRI analysis of the perihemorrhagic zone in a rat ICH model. Changing Aspects in Stroke Surgery: Aneurysms, Dissections, Moyamoya Angiopathy and EC-IC Bypass. 2008:15-8.
Figures