1480
Correction of Motion-Induced Artifacts in PRFS MR Thermometry During Mild Hyperthermia in the Pelvis1Munich School of Bioengineering, Garching bei München, Germany, 2Erasmus Medical Center, Rotterdam, Netherlands, 3GE Research Center, Garching bei München, Germany
Synopsis
Digestive motion including gas is the predominant source of artifacts for PRFS MR Thermometry monitored RF hyperthermia inside the pelvis. Gastrointestinal motion of gas introduces large field variations inside the pelvis, thus significantly hampers PRFS based MR temperature reading. The estimation of these dipolar field disturbances from a changing susceptibility distribution is very exact in case we know the mask of Δχ, as shown with a phantom experiment. But using the PDF method, which allows a heterogeneous distribution of Δχ-values in the background, the temperature error could be reduced to noise level for in-vivo data in presence of susceptibility artefacts as well.
Introduction
The most widespread method for MR-based temperature monitoring during mild hyperthermia (HT) (40-44°C) of cancer in the pelvis1,2 is based on the linear change of the proton resonance frequency (PRFS) of water molecules with temperature3. Motion within the pelvis can originate from bulk motion, breathing and digestion. Especially the displacement of paramagnetic digestive gasses within diamagnetic tissues causes large errors in temperature maps4. Here, we first disentangle the different potential motion induced phase error sources in the pelvis and then correct for the phase bias by applying the projection onto dipole fields (PDF) method5,6 in vivo. PDF has been successfully applied to correct for susceptibility artefacts in PRFS-MR thermometry data7, also during liver ablation of a pig8.Methods
In-vivo measurements were
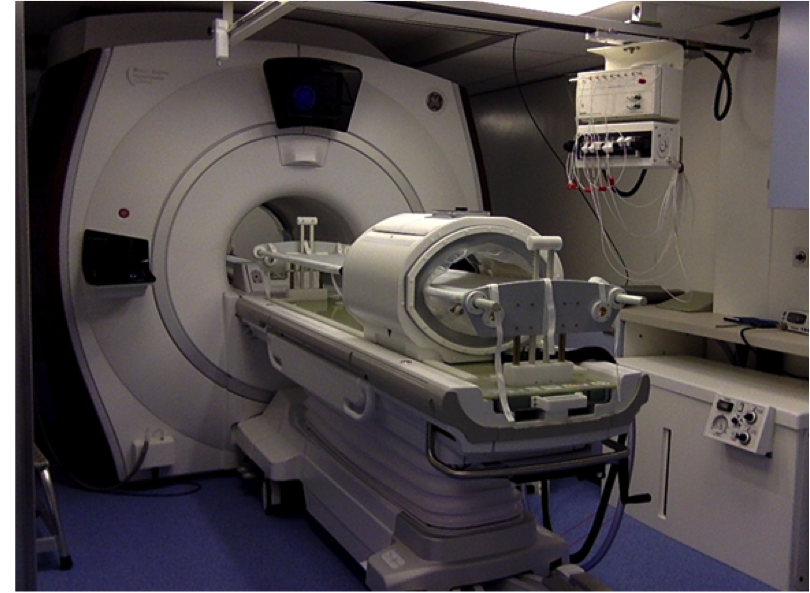
conducted on a 1.5T GE system (GE-Discovery;MR450w,General Electric,Milwaukee,USA) combined with the BSD-2000 Sigma Eye applicator (PYRESAR Medical,Salt
Lake City,USA) (Fig.1). The phantom data was acquired with a 3T GE system (GE-Discovery;MR750w,General Electric,Milwaukee,USA). In all cases, only the body coil was
used. Image reconstruction and processing was done in MATLAB (MathWorks,Natick,USA).
Motion source
To disentangle the potential motion sources during mild HT, we have investigated the phase evolution within the pelvis of volunteers, within and outside the filled water bolus. In addition, the recorded signal of a respiratory belt is compared to the phase signal evolution within a ROI inside the pelvis.
Phantom experiment
We mimic digestive motion with the filling of a small spherical glass holder at constant temperature, that is placed in a spherical bowl filled with Dotarem-doped water. The reference scan is acquired with an empty glass holder and the second scan after filling the glass holder. Using a high-resolution 3D image of the phantom in both positions we generated two precise masks. The magnetic field change due to susceptibility change is calculated via convolution of the Δχ-mask with a magnetic dipole in Fourier-domain9 and then finding the optimal Δχ-value for which the residual phase in the image was minimum.
PDF for in vivo measurement
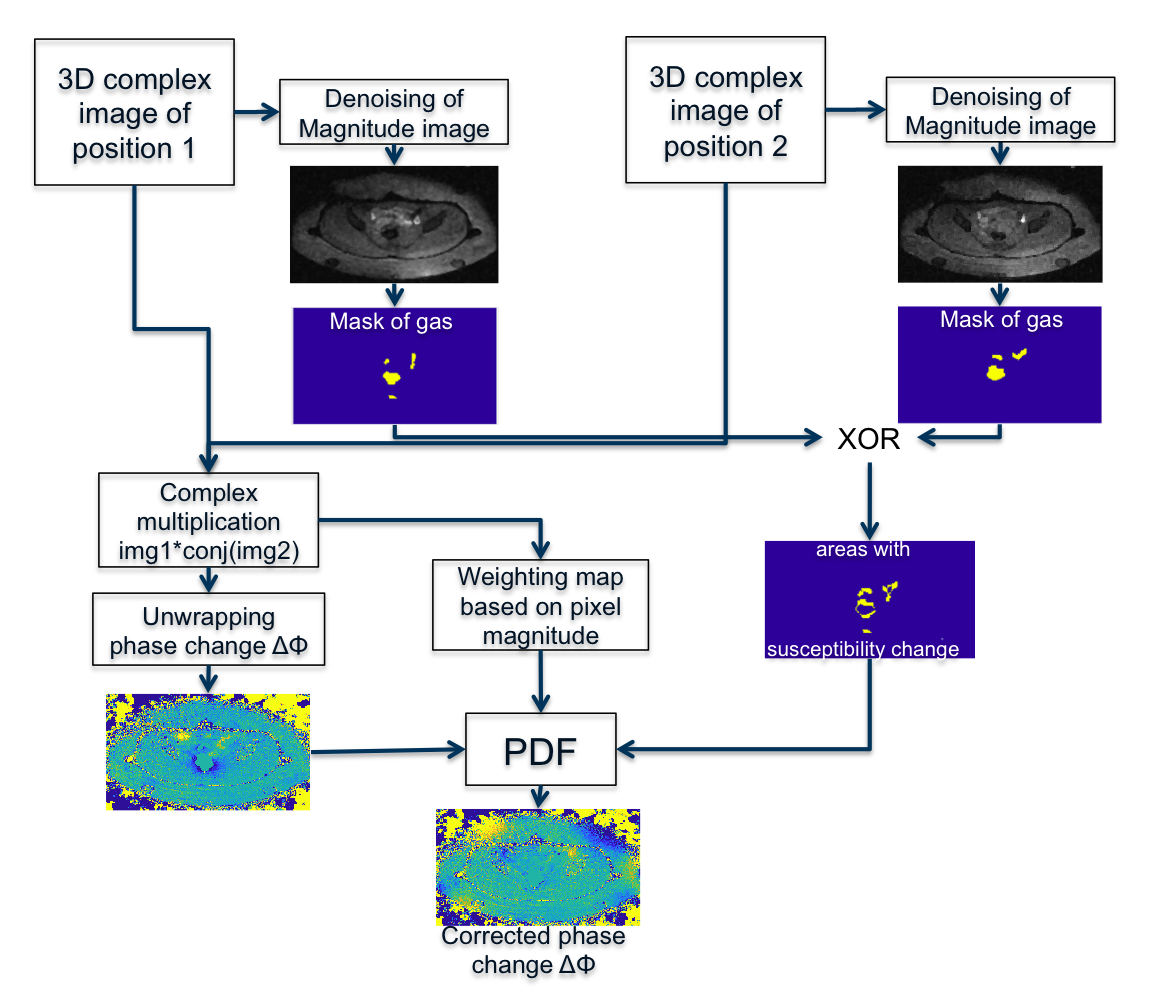
A high temporal resolution is needed to resolve the effect of digestive motion on phase. Since moving gas in neighbouring slices affect the current slice, we acquire the area from the anus up to the transverse colon in a sequential manner. A volunteer was placed inside the RF applicator and no heating was applied. To avoid artefacts from muscle relaxation, we waited 15min until acquiring the reference scan. The second scan was acquired approximately 30min thereafter. In our implementation, the PDF algorithm minimizes the field change in the foreground by searching for a Δχ-distribution in the background, which is defined by our mask. The details are illustrated in the flow chart in Fig.4.
Results
Motion source
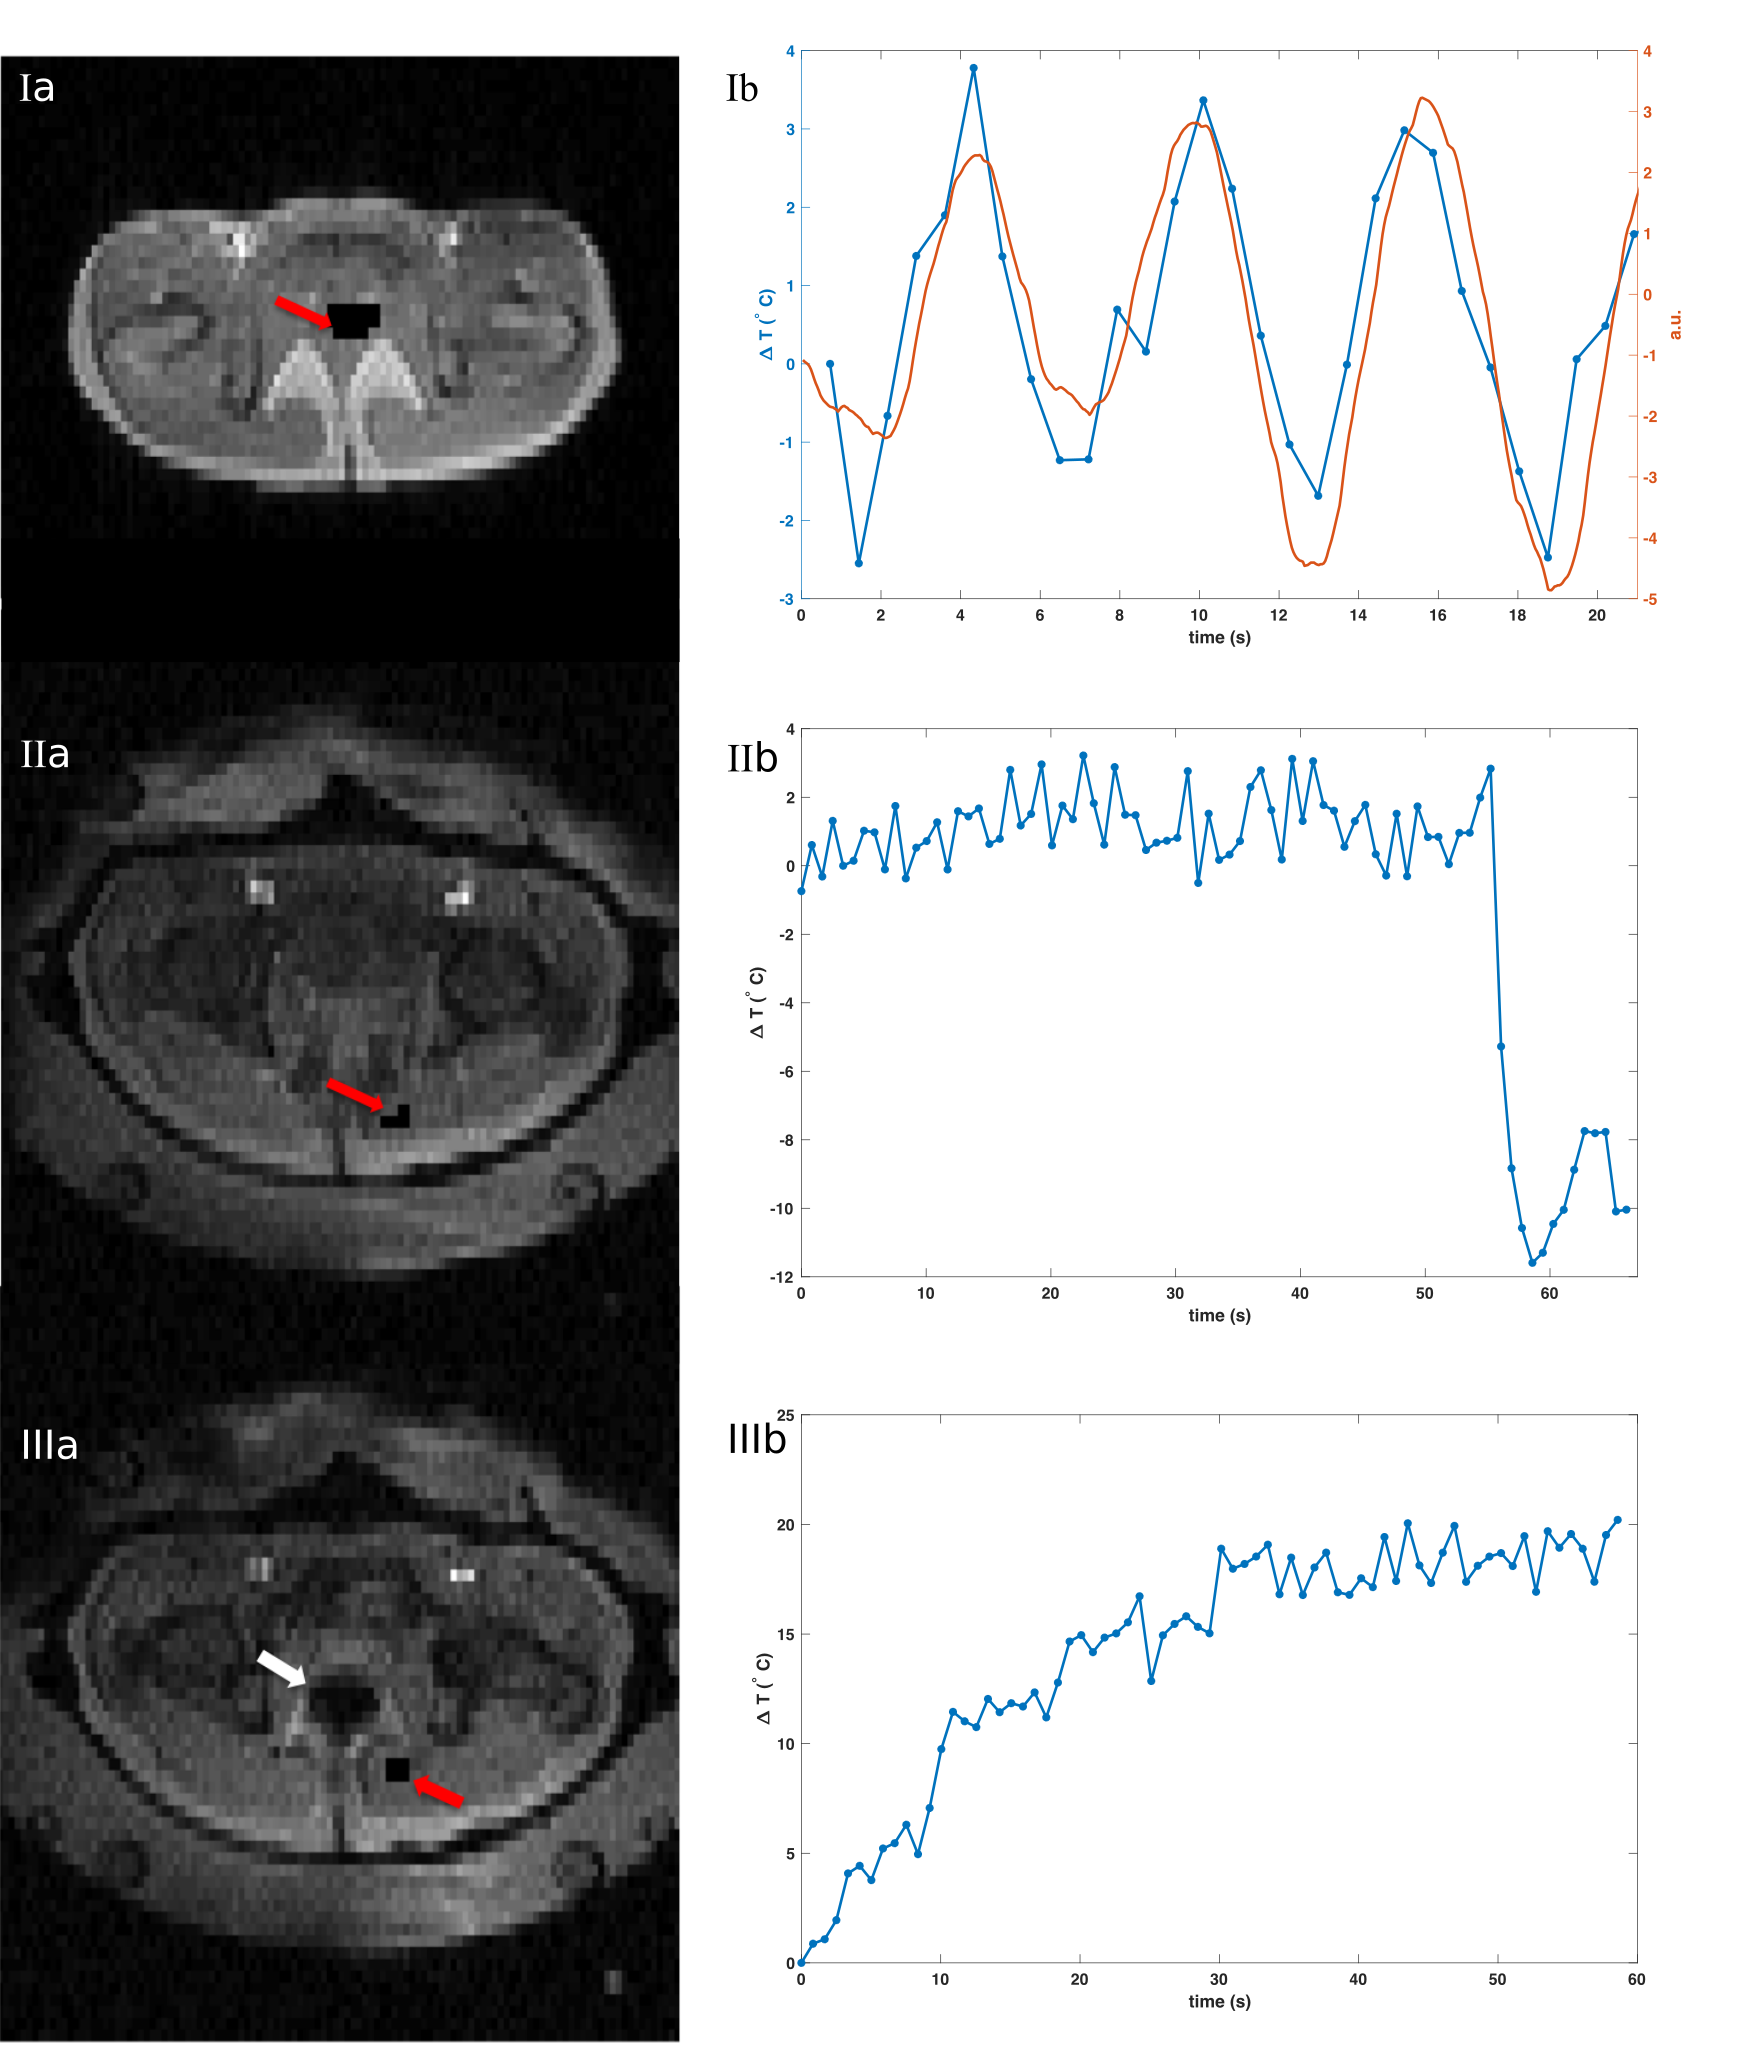
In
the left column of Fig.2, the magnitude images are plotted respectively. Without a filled water
bolus surrounding the pelvis, we clearly see respiratory motion induced phase
shifts evolving along the respiratory belt signal, which would lead to temperature errors of up to 6°C.
The
periodic phase fluctuations disappear when the subject is placed within the
applicator with a full water bolus. Instead, gastrointestinal gas motion dominate the phase changes and cause phase shifts corresponding to 20°C within one minute (Fig.2(IIIb))or a sudden phase jump corresponding to 12°C within 3s.
Phantom experiment
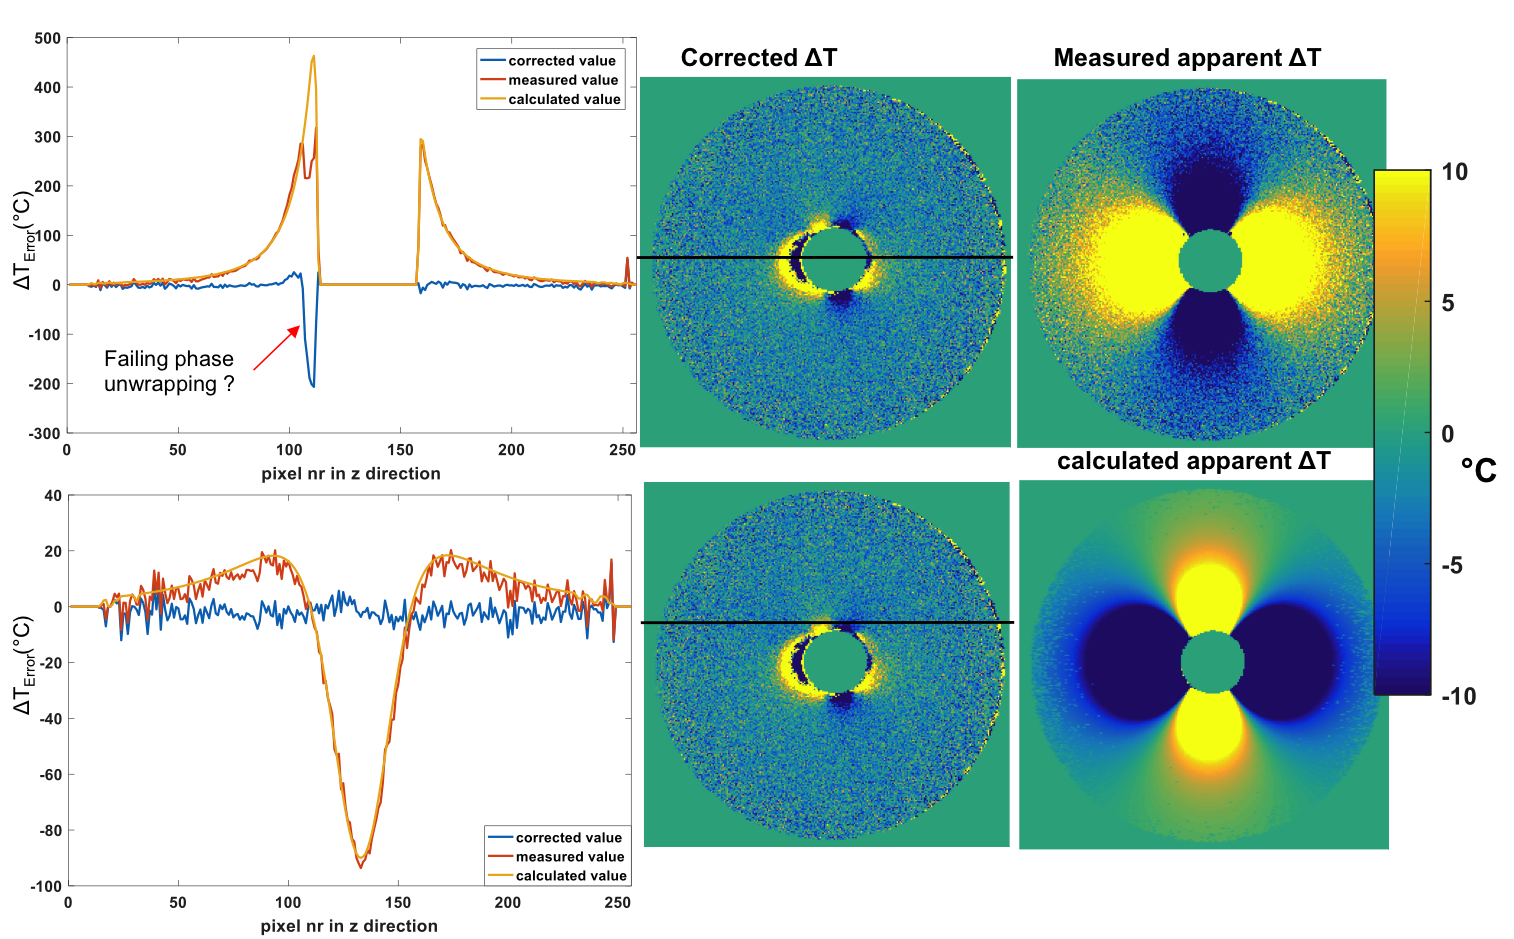
By iteratively fitting the optimal dX value to Fourier-based magnetic field calculation we could reduce the dipolar artefact down to noise level (Fig.3). We notice some residual errors in the proximity to the mask as well as one area with phase unwrapping failure.
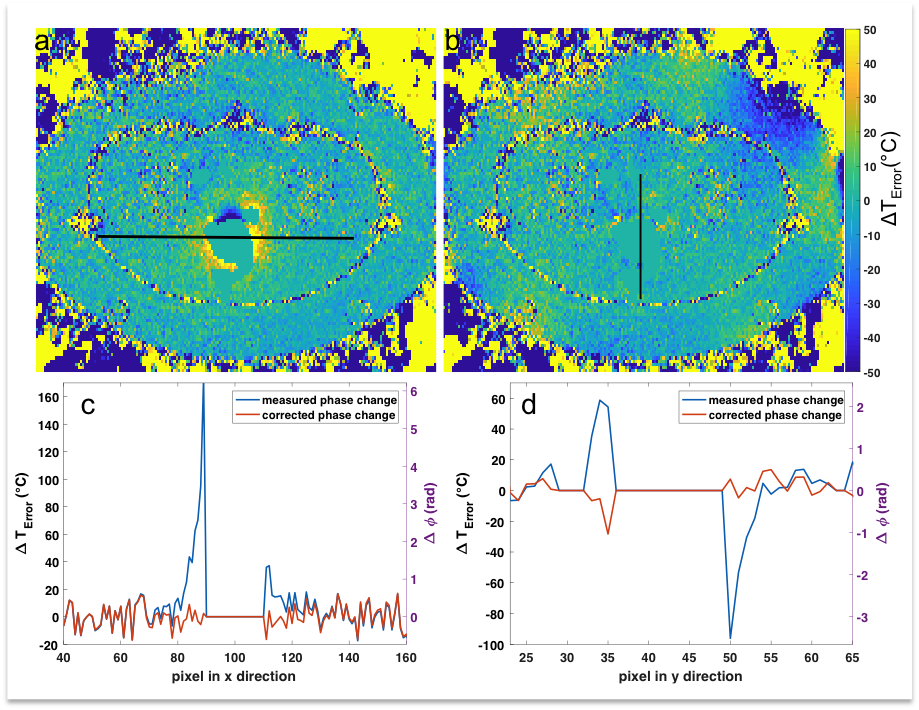
In vivo PDF correction
A representative temperature error map as well as the corrected temperature map at the level of the rectum are shown in Fig.5. The large phase changes of up to 6rad (170°C) in proximity of the rectum could be reduced to the initial noise floor. We notice that dipoles are also erroneously fitted in the background area of the corrected temperature map, where we do not expect susceptibility changes. This could be avoided in future implementations.
Discussion and Conclusion
The main motion artifact for
PRFS MR Thermometry within the pelvis originates from motion of intestinal gas,
since the water bolus restricts respiratory motion. The in-vivo images suffer from a low phase-to-noise ratio, and thus have a low temperature-to-noise ratio, since we needed to accommodate for a high temporal and spatial resolution. Nevertheless, the magnetic dipoles created by a shift of susceptibility distribution could be reliably found by the PDF algorithm, leaving behind only the noise floor.
Acknowledgements
This project was funded by the European Commission under Grant Agreement Number 605162.References
1. Kampinga HH. Cell biological effects of hyperthermia alone or combined with radiation or drugs: a short introduction to newcomers in the field. Int J Hyperthermia 2006;22(3):191-196.
2. Gellermann J, Wlodarczyk W, Hildebrandt B, et al. Noninvasive magnetic resonance thermography of recurrent rectal carcinoma in a 1.5 tesla hybrid system. Cancer Res 2005;65(13):5872-5880.
3. McDannold N. Quantitative MRI-based temperature mapping based on the proton resonant frequency shift: review of validation studies. Int J Hyperthermia 2005;21(6):533-546.
4. Dadakova T., Gellermann J., Voigt O., et al. Fast PRF-based MR thermometry using double-echo EPI: in vivo comparison in a clinical hyperthermia setting. Mag Reson Mater Phy 2015;28:305-314.
5. Liu T., Khalidov I., de Rochefort L., et al. A novel background field removal method for MRI using projection onto dipole fields (PDF). NMR Biomed 2011;24:1129-1136.
6. de Rochefort L., Liu T., Kressler B., et al. Quantitative susceptibility
map reconstruction from MR phase data using bayesian regularization:
Validation and application to brain imaging. Magn Reson Med 2010;63(1):194-206.
7. He M., Zou C., Tie C., et al. Improving the temperature accuracy of referenceless MR thermometry in the presense of susceptibility artifact. Proc. Intl. Soc. Mag. Reson. Med. 21 (2013) #4292.
8. Tan J., Waspe A.C., Mougenot C., et al. Motion Compensation using Principal Component Analysis and Projection onto Dipole Fields for Abdominal Magnetic Resonance Thermometry during High-Intensity Focused Ultrasound. Proc. Intl. Soc. Magn. Reson. Med. 25 (2016) #0818.
9. Bouwman JG., Bakker CJG. Alias Subtraction More Efficient Than Conventional Zero-Padding in the Fourier-Based Calculation of the Susceptibility Induced Perturbation of the Magnetic Field in MR. Magn Reson Med 2012;68:621-630.
Figures