1478
Proton resonance frequency based MR thermometry using shifted-echo bSSFP1School of Electrical Engineering, Korea Advanced Institute of Science and Technology, Daejeon, Republic of Korea
Synopsis
Magnetic resonance thermometry provides noninvasive temperature measurements for thermal therapy. In this abstract, we exploit linear phase relation generated by echo shifting in the bSSFP acquisition to measure PRF change. Echo-shifting from TE=TR/2 in bSSFP provides a linear relation between phase of transverse magnetization and phase evolution in TR. This linearity enables frequency prediction from the phase information, which makes temperature measurement with PRF shift possible. The performed simulations show shifted-echo bSSFP of TE=TR/4 well estimates frequency change.
Introduction
Magnetic resonance thermometry provides noninvasive temperature measurements for thermal therapy. Several temperature-sensitive parameters in MRI, such as proton resonance frequency1, T12-4 and T25 relaxation times, diffusion coefficient6, etc., are used for temperature monitoring. The resonance frequency of a nucleus is affected by external magnetic field and shielding effect of surrounding chemical environment. As temperature changes, state of hydrogen bond between water proton and neighbor molecules changes. This results in a small PRF change of -0.01ppm/℃ for water. Gradient-echo based sequences, in which phase accumulation represents off-resonance frequency, are commonly used for measuring PRF change in MR thermometry7-9. The balanced steady-state free precession (bSSFP) acquisition is advantageous in terms of signal-to-noise ratio (SNR) and fast imaging time. Despite this characteristics of SSFP, non-linear relation between phase and frequency and vulnerability to field inhomogeneity are problematic to its application10-13. In this study, we exploit linear phase relation generated by echo shifting in the bSSFP acquisition to measure PRF change.Method
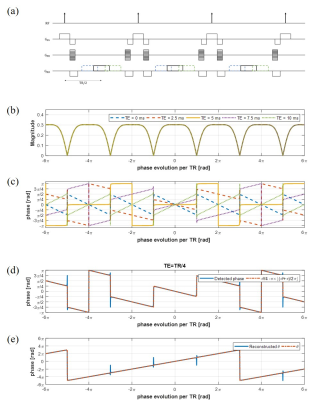
The MR signal from the balanced SSFP is usually acquired at the half of repetition time, i.e., TE=TR/2. When TE=TR/2, there is no linear relation between phase of transverse magnetization and off-resonance frequency as shown in figure 1(b). In the simulation, we use TR=10ms, flip angle=60°, and T1/T2=3800/1400ms for water. If TE is shifted from the half of the TR, linear phase with respect to off-resonance frequency is generated. Magnitude and phase of bSSFP signal are formulated as follows :
$$\left| M_{xy} \right| = \left| \frac{M_{0}\left(l-E_{1}\right) \sin\alpha E_{2}^{'}}{\left(1-E_{1}\cos\alpha\right)\left(1-E_{2}\cos\left(-\theta+\psi \right)\right) -E_{2}\left(E_{1}-\cos\alpha\right)\left(E_{2}-\cos\left(-\theta+\psi \right)\right)} \right|\sqrt{\left(1-E_{2}\cos\left(-\theta+\psi \right)\right)^{2}+E_{2}^{2}\sin^{2}\left(-\theta+\psi \right)}$$
$$\angle M_{xy} = \tan^{-1} \frac{-\sin\delta -E_{2}\sin\left(-\theta+\psi+\delta \right)}{-\cos\delta -E_{2}\cos\left(-\theta+\psi+\delta \right)} \approx -\theta\left(\frac{1}{2}-\frac{TE}{TR}\right)+\frac{\psi}{2}-\frac{\pi}{2}\left(2\times\lfloor \frac{-\theta+\psi}{2\pi} \rfloor +1\right) ~~~~~~~~~~~~~~~~~~~~~~~~~~~~~~~~~~~~~~~~~~~~ \tt eq.(1)$$
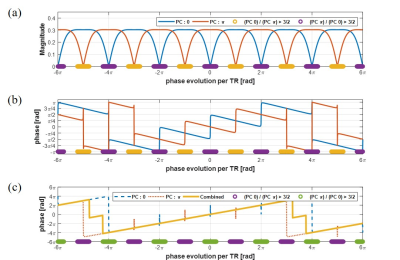
where $$$M_{0}$$$ is the net magnetization, α is a flip angle, ψ is a phase cycling angle, $$$E_{1}$$$ is $$$e^{-TR/T_{1}}$$$, $$$E_{2}$$$ is $$$e^{-TR/T_{2}}$$$, $$$E_{2}^{'}$$$ is $$$e^{-TR/T_{1}}$$$, θ represents phase evolution in TR, and δ represents phase evolution in TE after excitation. Phase of transverse magnetization could be approximately proportional to θ with assumption $$$E_{2} \approx1$$$. This assumption is quite reasonable when –θ+ψ is a multiple of 2π and $$$T_{2}$$$ is long as shown in figure 1(c). For the shifted echo of $$$TE \neq TR/2$$$, the phase of transverse magnetization is proportional to θ. At TE=TR/4, phases and θ have one-to-one correspondence with maximum slope in 4 cycles corresponding to 8π as shown in figure 1(d). θ could be estimated from phase information easily and it is shown in figure 1(e). Nonlinearity near banding points induces prediction error. To correct this error, one more bSSFP acquisition whose phase cycling angle is different from the first acquisition could be used. We use phase cycling angle 0 and π radian. Near banding region, signal magnitude drops drastically. Comparing magnitude of the two acquisitions, the phase is selectively assigned as follows:
$$\left(phase, \theta \right) = \begin{cases}\theta_{PC 0} & |M_{xy\_PC0}|>\frac{3}{2}\times|M_{xy\_PC\pi}| \\\theta_{PC \pi} & |M_{xy\_PC\pi}|>\frac{3}{2}\times|M_{xy\_PC0}| \\ \frac{1}{2}\times(\theta_{PC 0}+\theta_{PC \pi}) & otherwise \end{cases} ~~~~~~~~~~~~~~~~~~~~ \tt eq.(2)$$
Combined phase appropriately compensates prediction error as shown in figure 2.
Result
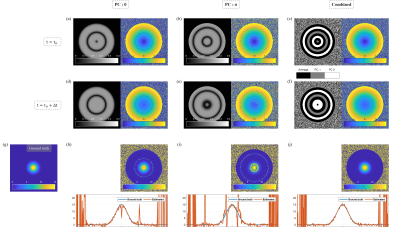
We performed computer simulation firstly to validate the proposed MR thermometry using the shifted-echo bSSFP. Figure 3 shows the simulation results. A homogeneous circular object is placed and the frequency at the center of the object has been changed with 15Hz. Then, frequency distribution follows bioheat equation14 explaining heat dissipation, which is exponentially decaying proportional to the square of distance. Field inhomogeneity is assumed to increase as the distance from the center increases up to 1 ppm (127Hz). Complex noise whose standard deviation is about 2% of the maximum intensity is added. Figure 3(g)-(j) show true frequency change and estimated frequency change extracted from bSSFP without phase cycling, with phase cycling of π, and combination of with and without phase cycling, respectively. Combination of two different phase-cycled bSSFP effectively compensates nonlinearity near banding and gives well estimated frequency change.Discussion
Echo-shifting from TE=TR/2 in bSSFP provides a linear relation between phase of transverse magnetization and phase evolution in TR. This linearity enables frequency prediction from the phase information, which makes temperature measurement with PRF shift possible. Linearization of phase to measure temperature change has been attempted using multi-echo linear fitting10 and multiple-acquisition of phase-cycled SSFP12. Compared to these methods, the proposed method has the merit of using only one echo acquisition with high linearity. This makes chance to utilize the remaining time in TR for multi-slice imaging, etc. and guarantees the linear relation with small number of acquisitions regardless of tissue properties. To evaluate performance of the proposed method, further experiments with phantom and biological tissue will be performed, and further parameter optimization is also required.Acknowledgements
This research was partly supported by a grant of the Korea Health Technology R&D Project through the Korea Health Industry Development Institute (KHIDI), funded by the Ministry of Health & Welfare, Republic of Korea (grant number : HI14C1135) and the Brain Research Program through the National Research Foundation of Korea (NRF) funded by the Ministry of Science, ICT & Future Planning (2014M3C7033999).References
1. Hindman JC. Proton resonance shift of water in the gas and liquid states. The Journal of Chemical Physics. 1966 Jun 15;44(12):4582-92.
2. Bloembergen N, Purcell EM, Pound RV. Relaxation effects in nuclear magnetic resonance absorption. Physical review. 1948 Apr 1;73(7):679.
3. Parker DL. Applications of NMR imaging in hyperthermia: an evaluation of the potential for localized tissue heating and noninvasive temperature monitoring. IEEE transactions on biomedical engineering. 1984 Jan(1):161-7.
4. Parker DL, Smith V, Sheldon P, Crooks LE, Fussell L. Temperature distribution measurements in two‐dimensional NMR imaging. Medical physics. 1983 May 1;10(3):321-5.
5. Graham SJ, Bronskill MJ, Henkelman RM. Time and temperature dependence of MR parameters during thermal coagulation of ex vivo rabbit muscle. Magnetic resonance in medicine. 1998 Feb 1;39(2):198-203.
6. Le Bihan D, Delannoy J, Levin RL. Temperature mapping with MR imaging of molecular diffusion: application to hyperthermia. Radiology. 1989 Jun;171(3):853-7.
7. Weidensteiner C, Quesson B, Caire‐Gana B, Kerioui N, Rullier A, Trillaud H, Moonen CT. Real‐time MR temperature mapping of rabbit liver in vivo during thermal ablation. Magnetic resonance in Medicine. 2003 Aug 1;50(2):322-30.
8. de Zwart JA, Vimeux FC, Delalande C, Canioni P, Moonen CT. Fast lipid‐suppressed MR temperature mapping with echo‐shifted gradient‐echo imaging and spectral‐spatial excitation. Magnetic resonance in medicine. 1999 Jul 1;42(1):53-9.
9. Stafford RJ, Price DV, Roger E, Diederich CJ, Kangasniemi M, Olsson LE, Hazle JD. Interleaved echo‐planar imaging for fast multiplanar magnetic resonance temperature imaging of ultrasound thermal ablation therapy. Journal of Magnetic Resonance Imaging. 2004 Oct 1;20(4):706-14.
10. Scheffler K. Fast frequency mapping with balanced SSFP: Theory and application to proton‐resonance frequency shift thermometry. Magnetic resonance in medicine. 2004 Jun 1;51(6):1205-11.
11. Paliwal V, El‐Sharkawy AM, Du X, Yang X, Atalar E. SSFP‐based MR thermometry. Magnetic resonance in medicine. 2004 Oct 1;52(4):704-8.
12. Rieke V, Hargreaves B, Butts Pauly K. PRF shift thermometry using multiple-acquisition phase-cycled SSFP. InConf Proc 6th Interventional MRI Symposium 2006 (Vol. 39).
13. Madore B, Panych LP, Mei CS, Yuan J, Chu R. Multipathway sequences for MR thermometry. Magnetic resonance in medicine. 2011 Sep 1;66(3):658-68.
14. Pennes HH. Analysis of tissue and arterial blood temperatures in the resting human forearm. Journal of applied physiology. 1948 Aug 1;1(2):93-122.
Figures


