1474
Electro-Optic E-field Mapping of Medical Implants with High Spatial Resolution: Resonant Excitation of Metallic Stents1Dept. of Radiology, Medical Physics, Medical Center University of Freiburg, Faculty of Medicine, University of Freiburg, Freiburg, Germany, 2BIOLAB Technolgy AG, Zürich, Switzerland
Synopsis
Electrically conducting implants with small and complex geometrical structures such as stents require electric field measurements with high spatial resolution to assess local MRI safety. So far, E-fields have been measured with dipole antennae that are limited in spatial resolution to several millimeters. In this study, we present an optical setup for 2D spatially resolved E-field measurements of medical implants with high spatial resolution. Resonant excitation of metallic NiTi stents with varying lengths is assessed and the sub-millimeter spatial resolution of the setup is demonstrated.
Introduction
Electrically conducting implants with small and complex geometrical structures such as stents or pacemaker leads require electric field measurements with high spatial resolution to assess local MRI safety. So far, the E-fields have been measured with dipole antennae that are limited in spatial resolution to several millimeters. Recently, the concept of electro-optic E-field probes has been applied for E-field measurements in the MRI environment, which may help to overcome these spatial limitations1,2. However, due to limited access and the need for non-magnetic equipment, systematic high-resolution measurements of the E-fields within the MR bore are difficult to perform. In this study, we present a setup for 2D spatially resolved E-field measurements of medical implants outside the MR bore and demonstrate the capabilities of near-field imaging at MHz-frequencies.Methods
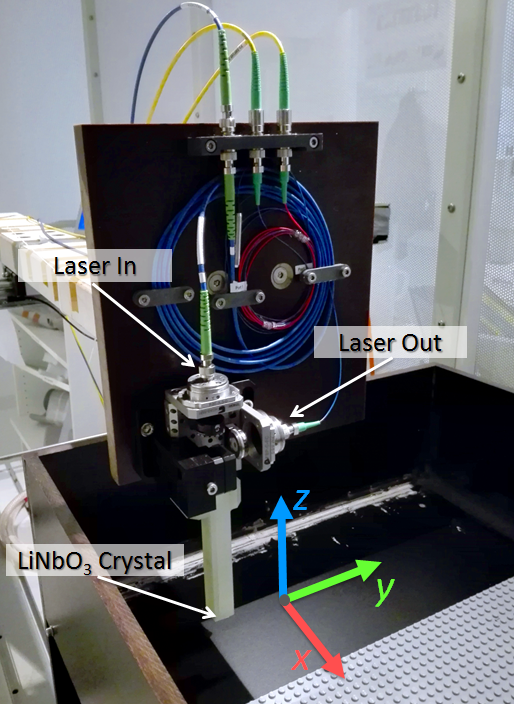
The E-field probe is based on a LiNbO3 electro-optical crystal (1x1x1 mm3). Due to the Pockels-Effect the polarization of an optical laser becomes linearly modulated by an external E-field within the crystal. Evaluation of the laser polarization allows for reconstruction of the amplitude, phase and polarization of the E-field at the location of the crystal. The spatial resolution is determined by the illuminated volume of the crystal and is on a sub-millimeter scale.
Figure 1 shows the non-metallic near-field probe. Spatially resolved field scans are performed by scanning the probe stepwise along the sample surface. In order to mimic the dielectrical environment of a human body, the measurements are performed in water (ε = 81). The sensor is chosen to be sensitive to the out-of plane component Ez of the E-field. Thus, the non-disturbed near-field pattern of a sample can be observed solely without any overlay of interfering excitation fields.
Our study comprises a set of 8 NiTi metal stents with different lengths (length: 4-20 cm, diameter: 5 mm). Ez maps were measured in a tangential plane at a distance of about 1 mm. The relative amplitude of Ez and its phase were recorded in steps of 0.75 mm along the x- and y-direction. For RF excitation, a 123 MHz dipole antenna was used and the signal was generated and readout by a lock-in amplifier. In a first approximation, electromagnetic phenomena such as resonances are scalable relative to the wavelength of the applied field. For a dipole, resonances are observed whenever the dipole length corresponds to integer multiples of half the wavelength.
From the FWHM of the first order resonance the quality-factor (Q) was determined which corresponds to the ratio between energy stored in the near-field and loss per oscillation cycle. Thus, Q describes the amplification of the energy absorbed from the incident field at resonance and is an important characteristic of an implant in particular for evaluating its worst-case potential.
Results
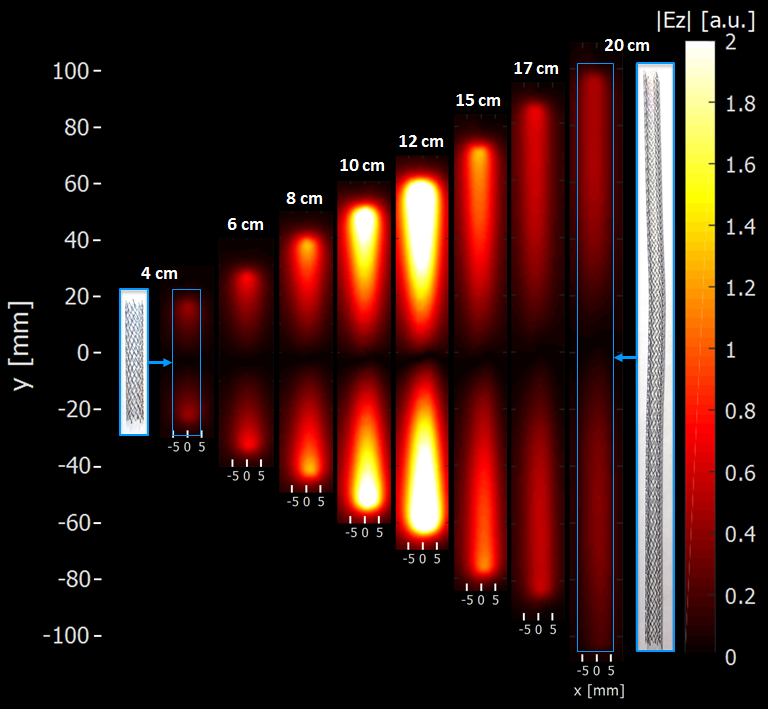
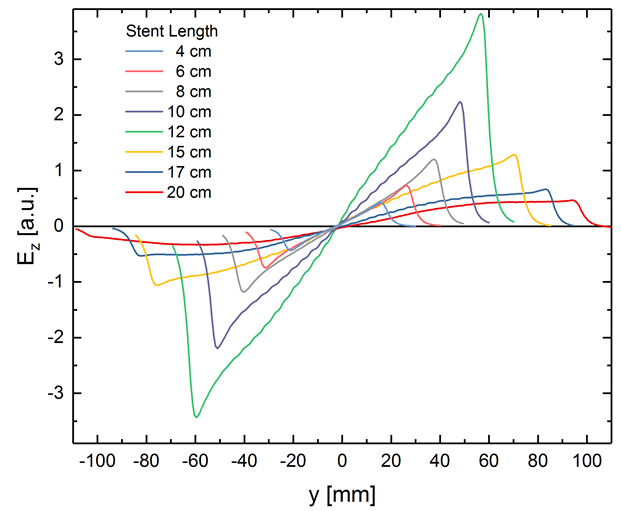
Figure 2 shows the measured magnitude maps of Ez for each stent. As expected, E-field amplitudes are maximal at the structure tips. Highest E-fields are observed for a length of 12 cm which corresponds to half of the wavelength (~ 13 cm) at 123 MHz in water (cf. Fig. 4).
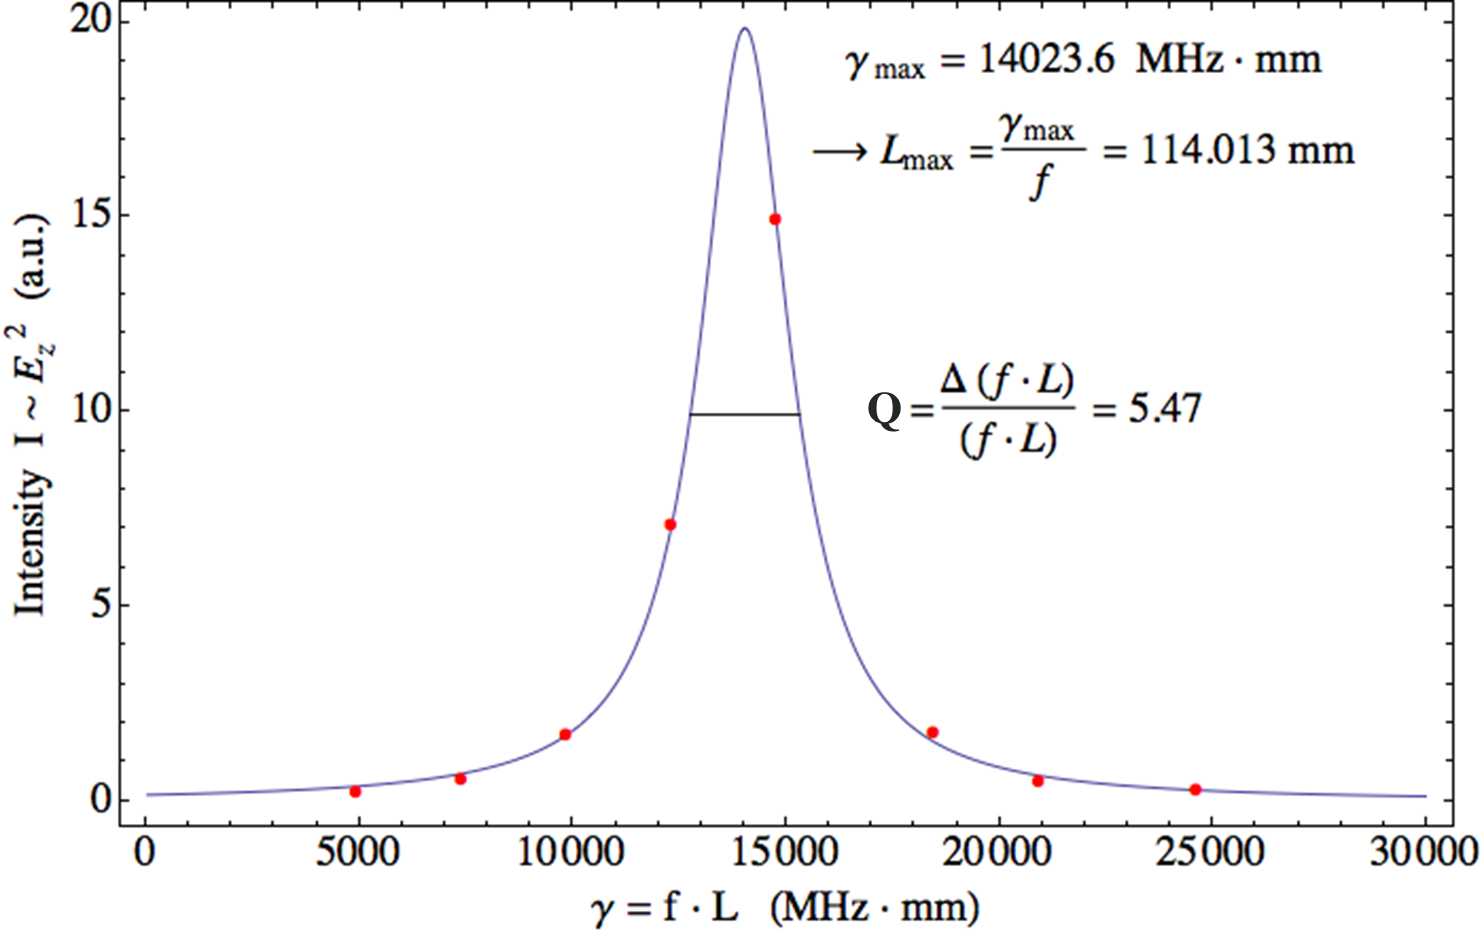
Figure 3 shows s plot of the intensity profile as a function of the frequency multiplied with sample length. Each data point of the graph shows the intensity maximum of one specific sample length. The applied frequency was constant at f = 123 MHz. From the FWHM a Q of 5.47 was calculated.
Figure 4 shows line plots of Ez along the centerline of the sample. A clear dipole behavior is seen with a node at the center of the stents. Note, that the high spatial resolution of the measurements allows for the detection of the small oscillations of Ez which correspond to the distance of the rods of the stents. The maximum SNR was up to 103 and scan times ranged from 10 minutes for the 4 cm long stent to 38 minutes for the 20 cm long stent.
Conclusion
The proposed electro-optic near-field approach enables low-noise E-field measurements of amplitude, phase and polarization in direct proximity to a sample. The sub-millimeter spatial resolution of the setup is demonstrated by the detection of small E-field variations that arise at the grid of metallic stents. On the example of metallic NiTi stents the spectral position as well as the corresponding linewidth and quality factor of the first order resonance were assessed. In conclusion, electro-optical near-field measurements provide insight into the electromagnetic properties of conducting implants and allow for detailed MRI-Safety inspections of structures, even with small and complex geometries.Acknowledgements
No acknowledgement found.References
1. Reiss S, Bitzer B, Bock M. An optical setup for electric field measurements in MRI with high spatial resolution. Phys. Med. Biol. 2015;60(11):4355
2. Saniour I, Gaborit G, Duvillaret L, et al. Optical-based probe for real time assessment of RF electrical field during MRI exam. Proc. Intl. Soc. Mag. Reson. Med. 25 (2017)
Figures