1464
The impact of altering MRI equipment and scanning parameters on phantom signal intensity ratio measurements – possible implications for interpreting Gadolinium signal changes within the brain1Division of Molecular and Clinical Medicine, University of Dundee, Ninewells Hospital and Medical School, Dundee, United Kingdom, 2Medical Physics, NHS Tayside, Ninewells Hospital and Medical School, Dundee, United Kingdom, 3Clinical Radiology, NHS Tayside, Ninewells Hospital and Medical School, Dundee, United Kingdom
Synopsis
Signal hyper-intensities within brain regions have been attributed to the deposition of gadolinium following repeat administrations of MR contrast agents. These have been mainly investigated retrospectively, but acquisition parameters may have varied. We investigated the impact of altering imaging parameters when measuring phantom signal intensity ratios (SIR). By changing parameters from a baseline, it was established that the application of filters, number of coil receiver channels, and changes to TR and TE resulted in percentage signal fluctuations of similar magnitude to hyper-intensities. It is recommended that imaging parameters are standardised where possible when interpreting SIR data in longitudinal brain studies.
Introduction
Since 2014 a plethora of studies have described a T1 shortening effect observed predominantly in the dentate nucleus (DN) and globus pallidus (GP) on non-contrast magnetic resonance (MR) images1. Through both animal and human autopsy studies, this has been correlated with the deposition of gadolinium from the administration of contrast agents (GdCAs)2. The research predominantly involves retrospective analysis from which the presence of gadolinium is inferred when increases in signal intensity ratios (SIR) are seen. Commonly these are the DN-to-pons (DN/P) and GP-to-thalamus (GP/Th). Through combined qualitative and quantitative analysis, signal hyper-intensities are observed at SIR percentage increases of about 2% from baseline3. Although the differences in image parameters, sequences and equipment used have been discussed4 and whilst most studies have attempted to minimise variation, its effect has never been thoroughly investigated. The aim of this study therefore, was to obtain and compare phantom signal intensity ratio (SIR) measurements acquired on MR images in which scanning parameters and equipment were systematically altered.Methods
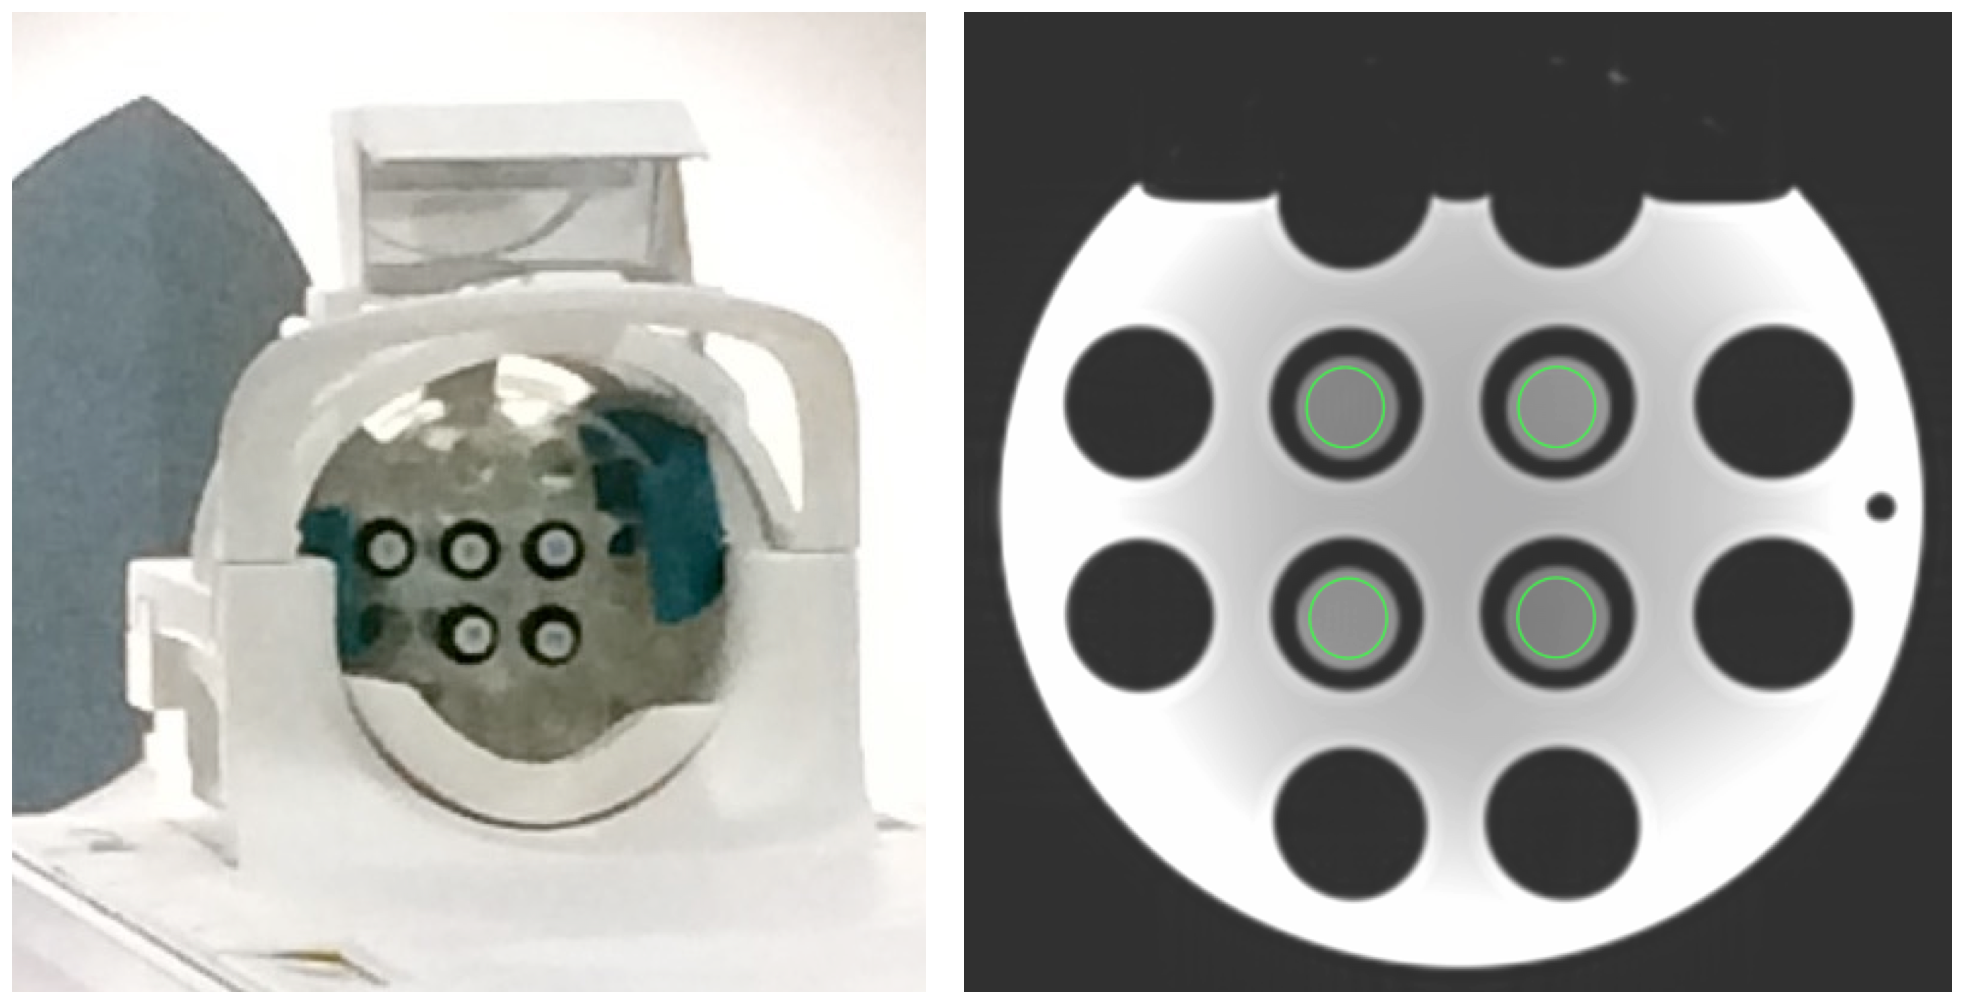
Phantom: A Eurospin gel ‘TO5’ phantom (Diagnostic Sonar Ltd, Livingston, UK - Fig 1.a) was centrally loaded with 4 gel-filled tubes of closely-matching intrinsic T1 values to the DN, P, GP and Th. The phantom was placed into the centre of an 18-channel head/neck phased array coil, and scanned on a 3.0T PrismaFIT machine (Siemens, Erlangen, Germany). Signal T1 measurements of the gels were established using an inversion recovery sequence.
Scanning: For phantom SIR measurements, the baseline protocol was a T1-weighted 2D spin echo sequence (TR, 700ms; TE, 12ms; FA, 90°; slice thickness, 5mm; field-of-view (FoV) 250mm; bandwidth, 130Hz/pixel; no. of slices, 1; no. of averages, 1; 18-channel head/neck phased array coil; no image filters or partial Fourier techniques). The baseline protocol was systematically varied by one parameter at a time. Alterations included TR, TE, filters and number of RF receiver channels (table 1). Baseline images were acquired periodically throughout each experiment. This was repeated on ten occasions, and the protocol was then transferred and repeated three times on a 1.5T MRI scanner (GE Signa HDxt, GE Healthcare, Milwaukee (WI), USA).
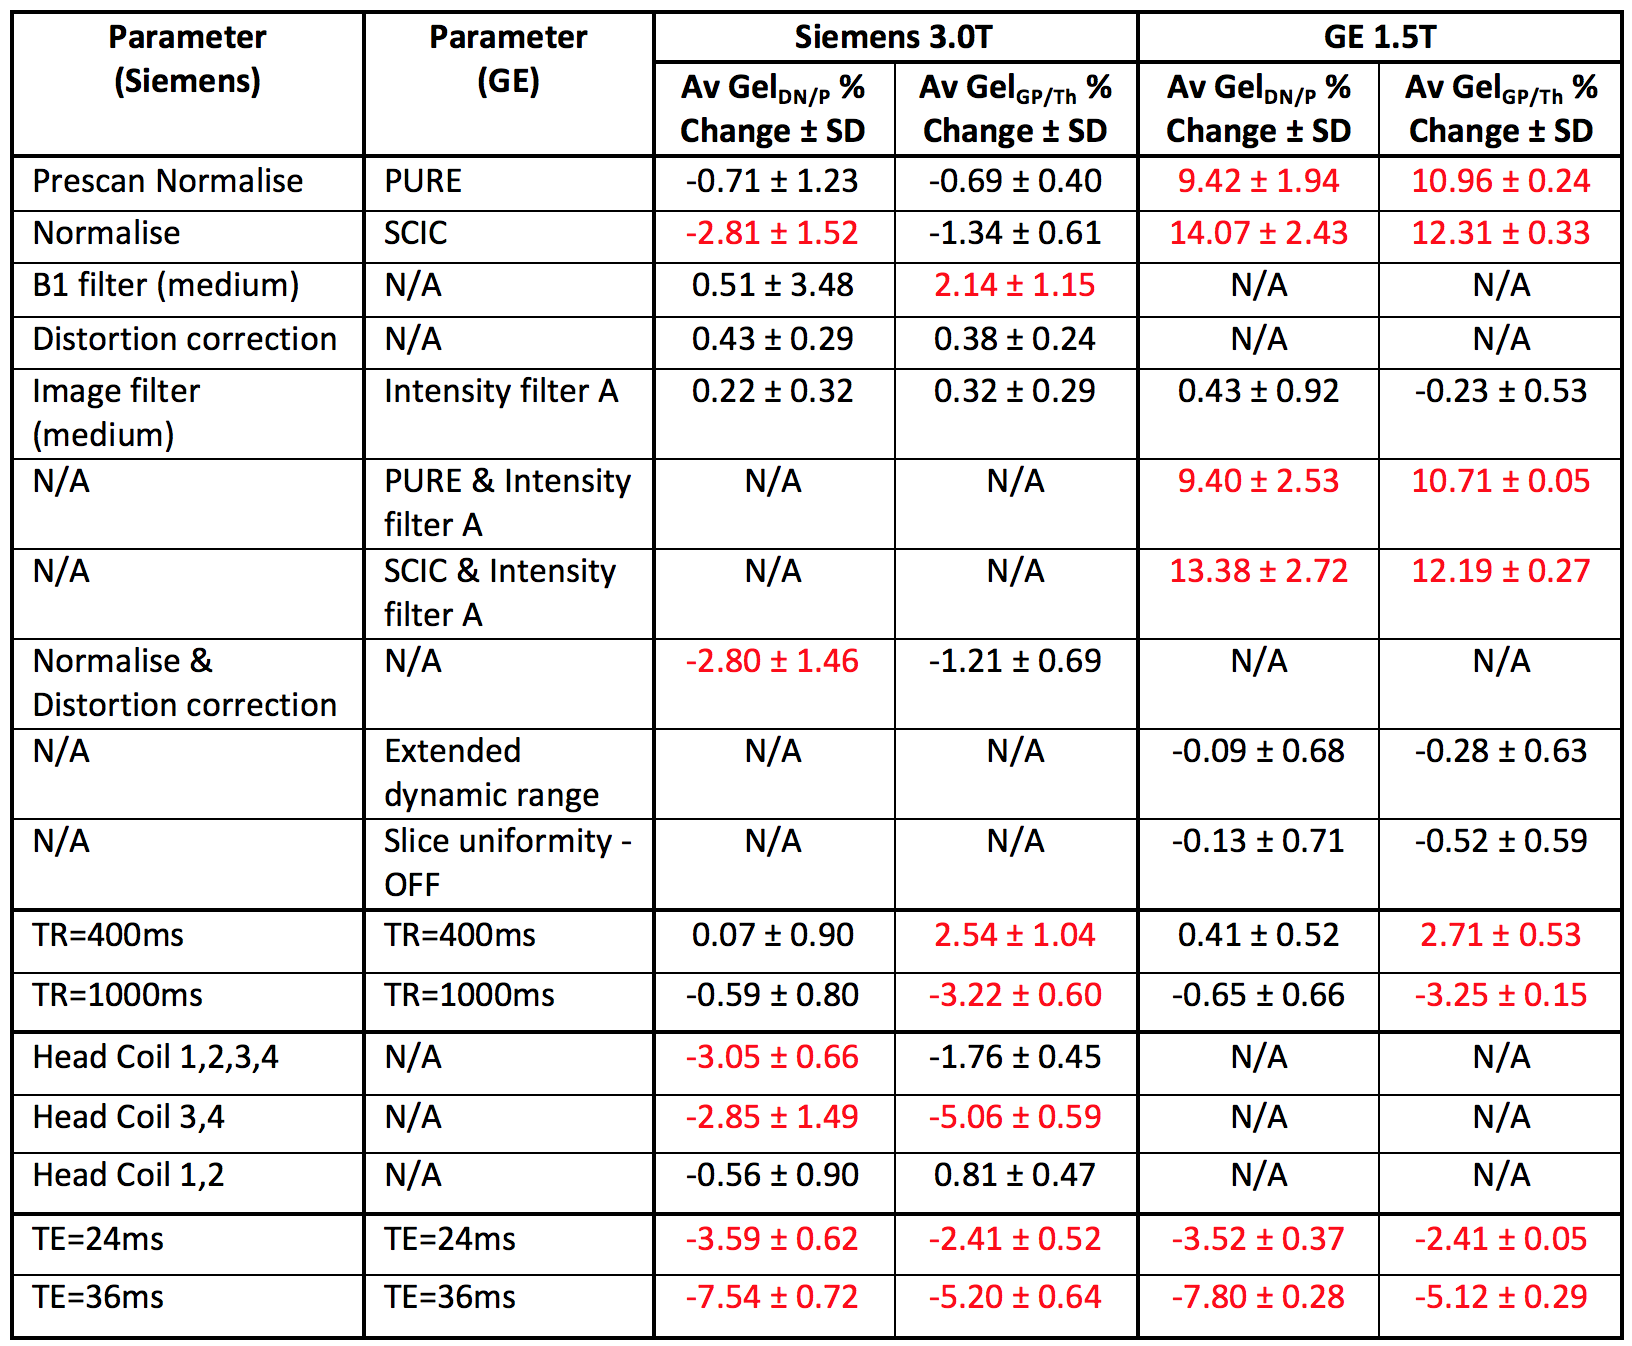
Quantification: The SIR and percentage change from baseline were calculated, and changes of greater than ±2% were highlighted.
Results
The measured T1 values of each gel (at 3.0T) were: 988ms (GelDN), 1060ms (GelP), 815ms (GelGP) and 822ms (GelTh). The baseline GelDN/P SIR was 1.04 ± 0.02 and the baseline GelGP/Th SIR was 1.21 ± 0.01. The average of each SIR change from baseline is given in Table 1. For GelDN/P, the largest variations were noted by the application of normalisation filters (normalise, -2.81%; phased-array uniformity enhancement, 9.42%; and surface coil intensity correction, 14.07%), change in TE, -7.80%; and change in number of receiver channels, -3.05%. For GelGP/Th, largest variations were observed following similar parameter changes to normalisation filters (phased-array uniformity enhancement, 10.96%; and surface coil intensity correction, 12.31%), change in TE, -5.20%; and change in number of receiver channels, -5.06%. Additionally, changes to the TR also affected GelGP/Th (-3.25%).Discussion
This study demonstrates that percentage changes similar to those previously quoted as brain hyper-intensities can be replicated in a phantom by changing common MR imaging parameters. The application of filters assists with signal intensity standardisation across the FoV, while coil element selection affects signal collection across the FoV. However, these can both affect the quantitative measurement of SIRs. These sequence parameters are difficult to identify from image meta-data describing longitudinal patient studies, and are rarely, if ever, quoted in published studies. A limitation of this study however, is that in practice these sequence parameters are often altered in a combination such that SIR changes cannot be attributable to one specific variable.
In conclusion, this work has demonstrated that commonly used MR imaging parameters can have a large effect on phantom SIR measurements. It is therefore recommended that for future brain MR studies involving GdCA’s the effects of different MR sequence parameters are carefully considered when drawing conclusions about the significance of signal hyper-intensities.
Acknowledgements
No acknowledgement found.References
1. Kanda, T., Ishii, K., Kawaguchi, H., Kitajima, K. & Takenaka, D. High Signal Intensity in Dentate Nucleus and Globus Pallidus on Unenhanced T1-weighted MR Images: Relationship with Increasing Cumulative Dose of a Gadolinium-based Contrast Material. Radiology 270, 834–841 (2014).
2. McDonald, R. J. et al. Intracranial Gadolinium Deposition after Contrast-enhanced MR Imaging. Radiology 275, 772–782 (2015).
3. Ramalho, J. et al. T1 signal-intensity increase in the dentate nucleus after multiple exposures to Gadodiamide: Intraindividual comparison between 2 commonly used sequences. Am. J. Neuroradiol. 37, 1427–1431 (2016).
4. Adin, M. E. et al. Hyperintense Dentate Nuclei on T1-Weighted MRI: Relation to Repeat Gadolinium Administration. Am. J. Neuroradiol. 36, 1859–65 (2015).
Figures