1461
T2 Relaxation in Evaluating Gd deposition: comparison between MultiHance and Magnevist1Boston University, Boston, MA, United States, 2Boston Medical Center, Boston, MA, United States
Synopsis
Purpose: To evaluation quantitative T2 mapping in exploring the effects of prior Gd exposure. Methods: Dual-echo MRI was performed in three groups of subjects; 1) without prior Gd exposure history, 2) only with prior exposure to MultiHance®, and 3) only with prior exposure to Magnevist®. T2 relaxation times were measured in pons, dentate nuclei, globus pallidi and thalami. Results: T2 relaxation time decrease was observed for both contrast agents in dentate nuclei and globus pallidi. Conclusion: Quantitative T2 mapping is a valuable tool in the investigation of Gd deposition in the brain.
Introduction
Gadolinium-based contrast agents (GBCAs) are widely used in magnetic resonance (MR) imaging in the clinical setting. However, recent evidences have suggested that exposure to GBCAs may result in long-term Gd deposition in the brain and other organs 1-3, which raises safety concerns. Quantitative MRI provides valuable means to explore Gd deposition in vivo. In this study, we focused on using quantitative T2 maps in evaluating the effect of prior exposure to two linear GBCAs, MultiHance® and Magnevist®.Methods and Materials
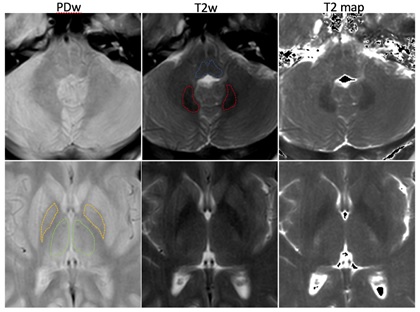
Subjects who underwent brain MRI at our institution from August to October 2017, were retrospectively recruited. The study was approved by the institutional review board (IRB). Three groups: subjects with no prior GBCA exposure (the controls), with prior exposure to and only to MultiHance® (gadobenate dimeglumine, Bracco Diagnostics Inc.), and with exposure to and only to Magnevist® (Gadopentetate Dimeglumine, Bayer Healthcare Pharmaceuticals). Exclusion criteria were: abnormal brain radiological findings, prior exposure to other or unknown GBCAs, age less than 18 years old, and bad data quality. Dual-echo turbo spin echo (TSE) MRI was acquired for each subject at a 3T scanner (Ingenia, Philips Healthcare, Best, Netherlands). Key parameters were: TR=3,440ms, TE=7.2/90ms, MTX=512x512, FOV=230x230mm2, slice thickness=5mm, NEX=1. T2 mapping algorithm was programmed in Matlab (Mathworks, MA). The directly acquired proton density-weighted (PDw) and T2-weighted (T2w) images were used for the delineation of the following structures: pons, dentate nuclei (DN), globus pallidi (GP), and thalami (Figure 1). Then the mean T2 values of the corresponding regions were obtained using ROI (region-of-interest) analysis. Student t-test was used to compare the inter-group differences and P<0.05 was considered statistical significant.Results
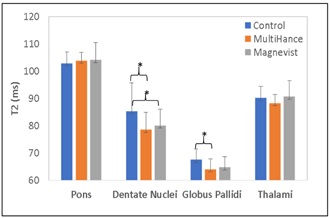
Forty-two subjects fulfilled the inclusion and exclusion criteria, and were analyzed in this study: 14 controls (male=1, female=13, age= 49.7±14.6 yrs), 12 subjects (male=3, female=9, age= 38.9±12.3 yrs) in the MultiHance® group (accumulative injection volume=55.3±55.2 ml, range 15~213 ml; duration since the last Gd exposure=17.2±9.7mons, range 0.5~32 mos), and 12 subjects (male=2, female=10, age= 53.3±14.5 yrs) in the Magnevist® group (accumulative injection volume=24.7±12.0ml, range 12~51 ml; duration since the last Gd exposure=101.9±36.1 mons, range 24~149 mos). There are no significant T2 differences were observed in pons and thalami (all P>0.05). For pons, T2 were: control=102.9±4.1ms, MultiHance®=103.9±2.9ms, Magnevist®=104.1±6.3ms. For thalami, T2 were: control=90.3±4.2ms, MultiHance®=88.3±3.2ms, Magnevist®=90.7±5.9ms. Compared to the controls (DN=85.3±10.4ms, GP=67.6±3.9ms), significant T2 decreases in were found in dentate nuclei and globus pallidi for subjects with previous exposure to the MultiHance® (DN=78.5±6.3ms, P=0.03; GP=64.0±3.9ms, P=0.01); whereas for the Magnevist® group, significant T2 decrease was found in globus pallidi (64.7±3.9ms, P=0.02), and borderline significant T2 decrease was found in DN (80.0±6.0ms, P=0.08). However, between the two GBCA groups, there are no significant T2 differences were observed in DN or GP (all P>0.05). (Figure 2).Discussion
GBCAs deposition in the brain was first postulated on the basis of hyperintensity on T1-weighted images 1-2. However, GBCAs can induce not only T1 shortening effect, but also could increase the T2 relaxation rate. Both quantitative T1 and T2 maps provide valuable means for cross-sectional comparison that less dependent on the imaging platform. Yet, there are some unique advantages when using T2 mapping to investigate GBCA deposition: dual-echo TSE is a routine clinical sequence; decrease of T2 is independent of other T1 confounders, such as myelination status. In this cohort, we observed significant or borderline significant decreases of T2 in DN nuclei and GP for both investigated GBCAs. The decreases of T2 values in DN and GP are slightly more in the MultiHance group as compared to the Magnevist® group, yet the difference are not statistically significant. However, there is significant difference between these two groups regarding accumulative dose (55.3±55.2 ml for MultiHance® vs. 24.7±12.0ml for Magnevist®) and duration since the last Gd exposure (17.2±9.7mons for MultiHance® vs. 101.9±36.1 mons for Magnevist®) because our institution switched GBCAs from Magnevist® to MultiHance® in 2012. Both MultiHance® and Magnevist® are ionic linear GBCAs, further studies will be needed to compare other types of GBCAs.Conclusion
Subjects with prior exposure to MultiHance® or Magnevist® showed decreased T2 in dentate nuclei and globus pallidi, even about 10 years after of GBCAs administration in subjects who received Magnevist®. Quantitative T2 mapping is a valuable tool for exploring Gd deposition in the brain, possibly indicating that the Gd deposits in pure un-chelated form.Acknowledgements
No acknowledgement found.References
1. Robert P, Lehericy S, Grand S,et.al. T1-Weighted Hypersignal in the Deep Cerebellar Nuclei After Repeated Administrations of Gadolinium-Based Contrast Agents in Healthy Rats. Investigative Radiology. 2015;50(8), 473–480.
2. McDonald RJ, McDonald JS, Kallmes DF, et.al. Intracranial Gadolinium Deposition after Contrast-enhanced MR Imaging. Radiology. 2015 Jun;275(3):772-82.
3. Kuno H, Jara H, Buch K, et. al. Global and Regional Brain Assessment with Quantitative MR Imaging in Patients with Prior Exposure to Linear Gadolinium-based Contrast Agents. Radiology. 2017; 283(1):195-204.
Figures