1450
Macromolecular and water pools distribution maps in bovine cortical bone using ultrashort echo time (UTE) MRI combined with magnetization transfer (MT) modeling1Radiology, University of California, San Diego, San Diego, CA, United States, 2GE Healthcare, San Diego, CA, United States, 3Radiology Service, VA San Diego Healthcare System, San Diego, CA, United States
Synopsis
Collagenous matrix, bound and pore water pools are main responsible components for viscoelastic properties of the cortical bone. Quantitative ultrashort echo time MR imaging (UTE-MRI) has been shown to be able to assess bound and pore water components as indexes for bone microstructure. UTE magnetization transfer (UTE-MT) modelling can evaluate the macromolecular (MM) components of the bone (collagen). Pixel mapping of MR properties of collagen and water components in cortical bone helps to localize pathologic or traumatic bone defects. This study focused on deriving the pixel maps of MR properties of these key bone components on seven bovine bone specimens.
Introduction
Cortical bone is the main element of the internal support of the body and plays a major role in load bearing 1. Collagenous matrix and water may comprise up to 45 and 35% of the cortical bone volume, respectively 2. Water exists as bound to the collagenous matrix and free water in pores (pore water). The composite of the collagenous matrix, bound and pore water is the main responsible for viscoelastic behavior of the cortical bone. MRI-based assessment of bone microstructure and biomechanics has become of great interests to many bone imaging research groups 2–9. Specifically, ultrashort echo time MRI (UTE-MRI) sequences have been employed widely to assess water components in cortical bone 2–9. Bi-component exponential T2* decay analysis is one of the most common methods for distinguishing between bound and pore water in the cortical bone 7–9. Recently, the magnetization transfer phenomena from collagenous matrix to water pools of the bone has been modeled in combination with UTE-MRI sequences, which is called UTE-MT modelling 10,11. UTE-MT modeling is hypothesized to measure the macromolecular protons (collagen protons) in the cortical bone with respect to the water protons. Assessing the macromolecular, bound and pore water protons altogether is assumed to reveal the bone mechanical and microstructural conditions comprehensively. Mapping the MR properties of these key bone components is hypothesized to highlight and localize probable bone injuries. Specifically, bone injuries normally happen in a localized and nonhomogeneous pattern. This study was aimed to derive the pixel mapping of the macromolecular MR properties combined with the bound and pore water properties of bovine cortical bone specimens.Methods
Sample preparation:
Seven fresh bovine cortical bone specimens were purchased from a local grocery store. After removing the bone marrow, 30 mm long samples were sectioned using a low-speed diamond saw (Isomet 1000, Buehler) with constant saline irrigation. Bone samples were stored in phosphate buffered saline (PBS) solution for 2 hours prior to imaging.
UTE-MRI sequences: Each bone specimen was placed in a plastic container filled with Fomblin to minimize dehydration during MRI scanning. The specimens were scanned on a 3T clinical MRI scanner (Signa HDx, GE healthcare system) using a transmit/receive quadrature coil (BC-10, Medspira, Minneapolis, Minnesota, USA). Three quantitative imaging protocols were performed: 1) a dual-echo 3D-UTE sequence (TR = 100 ms, five dual TEs = 0.032/2.2, 0.2/4.4, 0.4/6.6, 0.6/8.8, 0.8/11 ms, flip angle (FA) = 10˚) for bi-component T2* analysis; 2) a UTE dual TR actual flip angle imaging (UTE-AFI) for B1 mapping (TR = 10, 100 ms) and UTE variable TR (UTE-VTR) method for accurate T1 mapping (TRs = 10, 20, 30, 50, 100 ms, FA = 45˚); and 3) a 3D-UTE-MT sequence (MT saturation power = 500°, 1000°, and 1500°, frequency offset = 2, 5, 10, 20, and 50 kHz, TR=100 ms, FA = 10˚) MT modeling of water and collagen proton fractions. Other imaging parameters include: field of view (FOV) = 12 cm, matrix = 128×128, slice thickness = 3 mm, 20 slices, and sampling bandwidth = 166 kHz.
Data analysis: MATLAB software (The Mathworks Inc., Natick, MA, USA) was used for T1 measurements after B1 correction, MT-modeling and bi-component T2* analyses and eventually for pixel maps generation.
Results
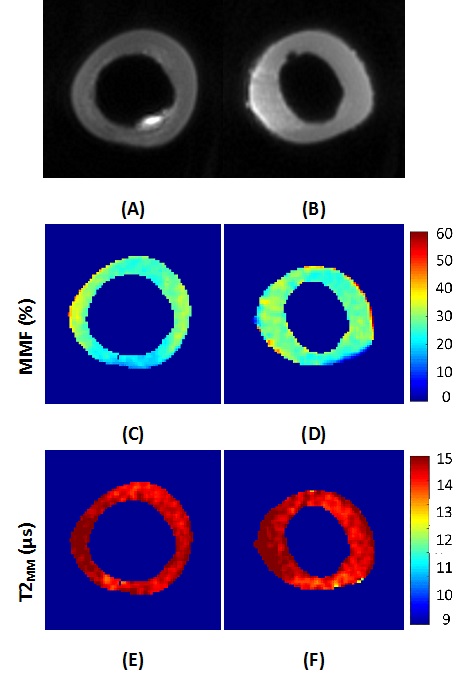
Figure 1 shows the UTE image at TE=0.032 ms for two representative
bone specimens in addition to their corresponding pixel maps of macromolecular
fraction (MMF) and T2 (T2MM).
MMF ranges between 40 to 60% of water and collagen composite. A denser region
of macromolecular matrix was observed in the thicker bone specimen (Fig.1 C D).
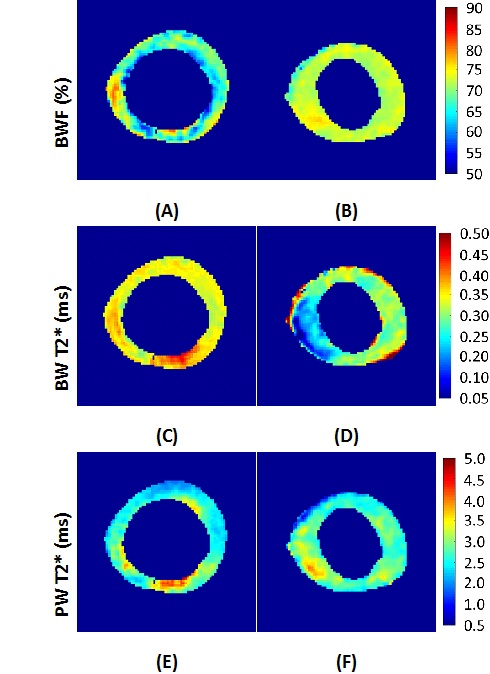
The bound and pore water (BW and PW) pixel maps are presented in Figure 2. The
bound water ranges from 60 to 80% of the total water. The thinner specimen
revealed a lower average fraction of bound water with higher T2* (Fig2. A, C).
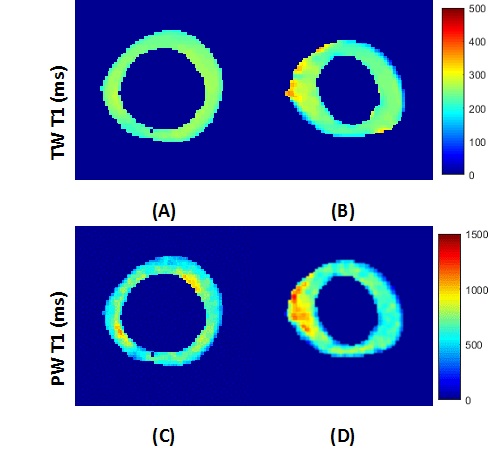
Figure 3 illustrated the T1 pixel maps of the total and pore water for both representative
specimens.Discussion
The application of this comprehensive pixel mapping package of macromolecular, bound and pore water pools in the cortical bone were reproducible for all seven scanned samples. The presented pixel maps revealed the probable locations with altered microstructural and mechanical properties. Such a mapping package is hypothesized to be sensitive to bone defects in cortical bone. Future steps of this study involve validating microstructural alterations with µCT and mechanical indentation tests.Conclusion
This study showed the feasibility of deriving comprehensive pixel maps of the collagenous matrix and water pools of cortical bone. These maps are hypothesized to help with localizing focal bone injuries and estimating bone viscoelastic properties.Acknowledgements
The authors acknowledge grant support from NIH (1R01 AR062581-01A1, 1 R01 AR068987-01) and the VA Clinical Science R&D Service (Merit Award I01CX001388).References
1.Chang, E. Y., Du, J. & Chung, C. B. UTE imaging in the musculoskeletal system. J. Magn. Reson. Imaging 41, 870–883 (2015).
2.Granke, M., Does, M. D. & Nyman, J. S. The Role of Water Compartments in the Material Properties of Cortical Bone. Calcif. Tissue Int. 97, 292–307 (2015).
3.Du, J. et al. Assessment of cortical bone with clinical and ultrashort echo time sequences. Magn. Reson. Med. 70, 697–704 (2013).
4.Seifert, A. C. & Wehrli, F. W. Solid-State Quantitative 1H and 31P MRI of Cortical Bone in Humans. Curr. Osteoporos. Rep. 1–10 (2016). doi:10.1007/s11914-016-0307-2
5.Manhard, M. K. et al. Validation of quantitative bound- and pore-water imaging in cortical bone. Magn. Reson. Med. 71, 2166–2171 (2014). 6. Li, S. et al. Ultrashort echo time bi-component analysis of cortical bone - A field dependence study. Magn. Reson. Med. 71, 1075–1081 (2014).
7.Biswas, R. et al. Ultrashort echo time (UTE) imaging with bi-component analysis: Bound and free water evaluation of bovine cortical bone subject to sequential drying. Bone 50, 749–755 (2012).
8.Nyman, J. S., Ni, Q., Nicolella, D. P. & Wang, X. Measurements of mobile and bound water by nuclear magnetic resonance correlate with mechanical properties of bone. Bone 42, 193–199 (2008).
9.Bae, W. C. et al. Quantitative ultrashort echo time (UTE) MRI of human cortical bone: Correlation with porosity and biomechanical properties. J. Bone Miner. Res. 27, 848–857 (2012).
10.Ma, Y.-J., Chang, E. Y., Carl, M. & Du, J. Quantitative magnetization transfer ultrashort echo time imaging using a time-efficient 3D multispoke Cones sequence. Magn. Reson. Med. 0, 1–9 (2017).
11.Ma, Y.-J. J., Shao, H., Du, J. & Chang, E. Y. Ultrashort echo time magnetization transfer (UTE-MT) imaging and modeling: magic angle independent biomarkers of tissue properties. NMR Biomed. 29, 1546–1552 (2016).
Figures