1449
Analysis of the relationship between mandibular joint motion trajectory and masticatory muscle properties (volume, shape, T1&T2 value) with MR dynamic imaging1Kokoro Research Center, Kyoto University, Kyoto, Japan, 2Institute for Frontier Life and Medical Sciences, Kyoto University, Kyoto, Japan, 3The Graduate School of Engineering, Kyoto University, Kyoto, Japan, 4Osaka Dental University, Osaka, Japan
Synopsis
For the diagnosis of temporomandibular joint disease, it is important to analyze with complete accuracy the range of mandibular motion and the tissue properties of the masticatory muscle in individual patients. In this study, we explored the parameters for accurate imaging of the mandibular motion trajectory using MR dynamic imaging, and then analyzed the relationship between the range of mandibular motion and the tissue properties of the masticatory muscle. As a result, we successfully identified the optimal imaging parameters and clarified that the range of side-to-side motion of the mandibular joint correlated with the tissue properties of the masticatory muscle.
Purpose
At present, temporomandibular joint disease is one of the therapeutic challenges in dentistry, but no methods to identify the causes and appropriate treatment have been established. This problem is likely because temporomandibular joint disease develops due to multiple factors, such as joint abnormality, muscle tone, and malocclusion. These factors are related to both the complex structure and extremely complex motion of the mandibular joint. In particular, the articular disk moves easily, causing many disk failures during motion. In addition, some muscle conditions may cause a deterioration in joint motion. These abnormal joint motions, which vary with each individual, result in complex problems. It is important to comprehensively identify muscle abnormalities and problems with mandibular joint motion by exploring and clarifying joint disease in individual patients, and to establish both an evaluation and treatment method for individual patients. We have continuously performed measurements of the mandibular joint motion trajectory, imaging of the articular disk, and evaluation of the muscles, using MRI1. In this study, we have analyzed the relationship between the mandibular motion trajectory and individual tissue properties of the masticatory muscle (volume, shape, and T1&T2 value) by identifying imaging parameters that are useful for obtaining the mandibular motion trajectory using MRI.Materials and Methods
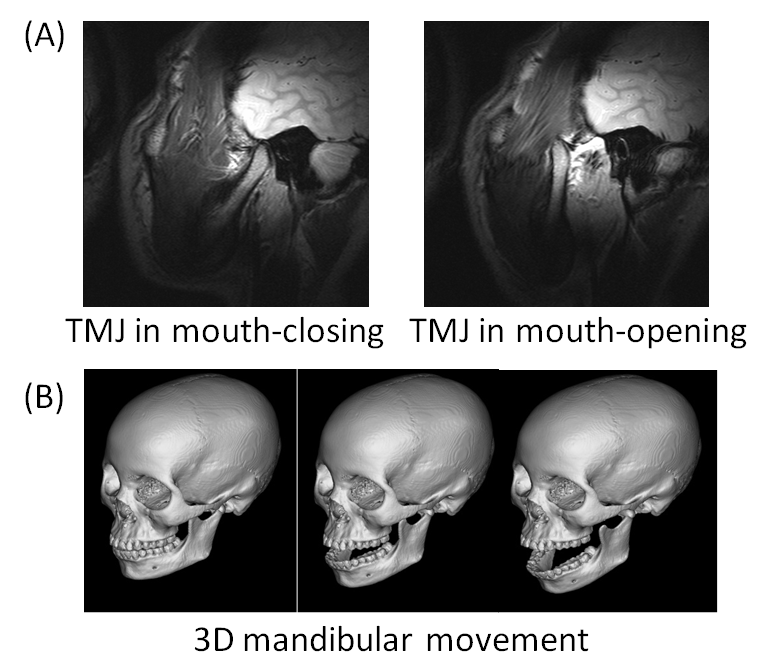
Ten subjects participated in this study and were evaluated with, a 1.5T whole body scanner (MAGNETOM Sonata, Siemens A.G., Erlangen, Germany). and a head/double-loop coil for signal reception. In the imaging sequence, the human mandibular joint was imaged while changing TR:BandWidth(BW) and Flip Angle(FA) in a True FISP sequence (pixel size:0.55x0.55mm, thickness:3.0mm) for dynamic imaging of mandibular motion2. In addition, the subjects were requested to perform opening and closing movements of the mouth during the MRI (Figure 1). Our original automatic extraction method3 for mandibular motion was used to obtain the mandibular motion trajectory from the images. In addition, the 3D-MPRAGE sequence(TR:2200ms, TE:3.54ms, TI:1100ms, pixel size:0.58×0.58mm, flip angle:15deg., thickness:1.1mm) was used for imaging of the head to obtain the structure of the masticatory muscle at high resolution. Based on the obtained images, we extracted each VOI on both the right and left sides of the masticatory muscle (temporal muscle, masseter muscle, and internal/external medial pterygoid muscle) using our specified software. In addition, for measurements of the T1 and T2 values, both the spin echo sequence (TR:100, 500, 2000ms, TE:152ms, pixel size:1.56×1.56mm, FA:90deg., thickness:5mm) and turbo spin echo sequence (TR:3000ms, TE:13.1, 26.2, ..., 419.2ms, pixel size:1.56×1.56mm, FA:90deg., thickness:5mm) were used for imaging, respectively, to calculate the characteristic values of the masticatory muscle using our specified software. Then, we analyzed the relationship between the individual parameters and the mandibular motion trajectory.Results and Discussion
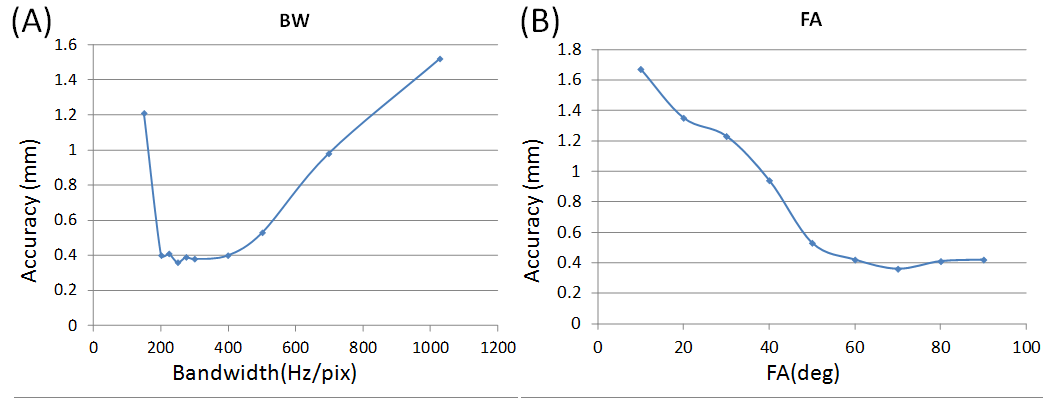
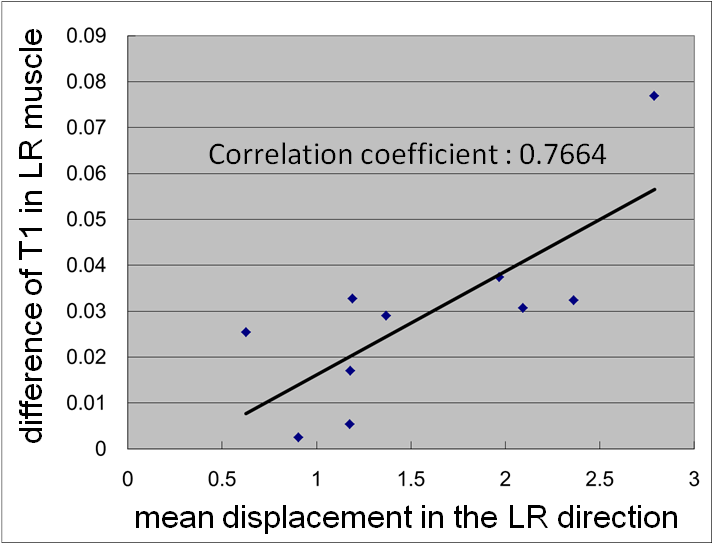
Regarding optimization of imaging parameters, we found that the SNR of the mandibular bone head was maximal when the BW = 250 and the FA = 70. In addition, as a result of comparing automatic extraction with manual extraction, it was determined that extraction with the highest accuracy was confirmed when the BW = 250 and the FA = 70 (Figure 2). Next, in the analysis of the relationship between the mandibular motion trajectory and tissue properties of the masticatory muscle, it was determined that the quantity of the side-to-side motion of the mandibular joint correlated with the bilateral difference of the masseter and internal/external pterygoid muscle volumes. In addition, the internal and external pterygoid muscles showed a T1 value, which had a high correlation with the quantity of mandibular side-to-side motion (Figure 3). This finding suggested that abnormal mandibular joint motion (mild temporomandibular arthrosis) might be correlated with abnormal masticatory muscle properties, especially involving the internal/external pterygoid muscle. Although the relationship between the internal/external pterygoid muscle and temporomandibular arthrosis had been suggested in the past, the relationship is now confirmed by MRI measurements.Conclusion
In this study, we investigated imaging parameters using dynamic imaging of mandibular joint motion, and successfully obtained optimal imaging parameters. In the analysis of the relationship between the mandibular motion trajectory and masticatory muscle properties, it was found that the range of side-to-side motion of the mandibular joint was related to the masticatory muscle. It was also suggested that especially the internal/external pterygoid muscle might be correlated with joint motion problems. These findings will be useful for resolution of pathological conditions related to temporomandibular joint disease in the future.Acknowledgements
no acknowledgement found.
References
1.Azuma T et al., Magn. Reson. Imaging, 2009; 27(3): 423-33.
2.Nakai R et al., Proc. ISMRM, 2013; 21: 3520.
3.Nakai R et al., Proc. ISMRM, 2014; 22: 5356.
Figures