1445
Clinical value of semi-quantitative and quantitative MR perfusion imaging in distinguishing malignant from benign bone tumors1The First Affiliated Hospital of Zhengzhou University, Zhengzhou, China, 2Philips Healthcare, Beijing, China
Synopsis
The dynamic contrast-enhanced magnetic resonance imaging(DCE-MRI) is a common scanning technology which contains semi-quantitative and quantitative perfusion information. This work investigated and evaluated the ability of semi-quantitative and quantitative perfusion information in characterizing the bone tumors, and furtherly evaluate the ability of semi-quantitative and quantitative parameters to differentiate benign and malignant tumors.
Purpose
Methods
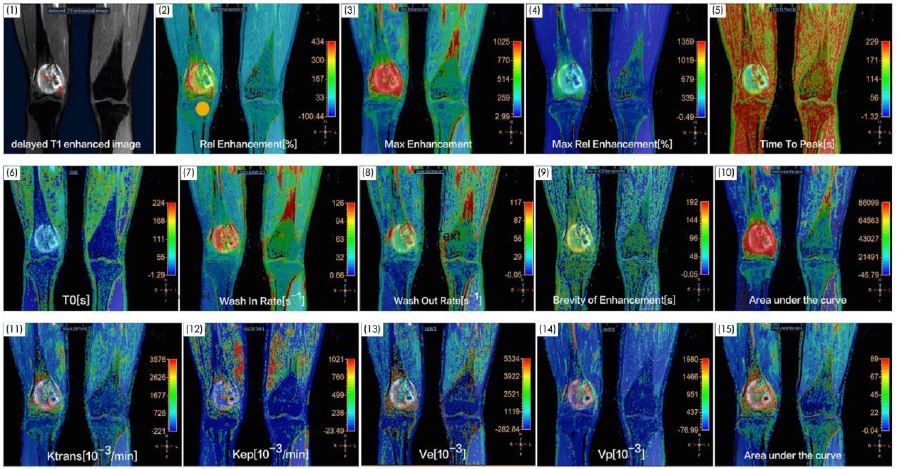
Sixty-five patients (38males and 27females aged 34.2±19.0 years old) with bone tumors (all have been diagnosis as bone tumor according to pathological biopsy) were included in this study. And based on the WHO Classification of Tumors of Soft Tissue and Bone (2012) criteria, 65 patients were divided into two groups:32 for benign tumors and 33 for malignancies. Each subject underwent a MR scanning by using a 3T MR scanner (Ingenia, Philips Healthcare, Best, the Netherlands).All the patients were scanned by DCE (time-resolved 3D TFE) sequence with following parameters: TR/TE=4.5ms/2.1ms, FA=10 degree, voxel size=2mm×2mm×2mm,various field of view and matrix size according to the anatomy size, 50 dynamics within scan time of 4min-6min, and imaging with multiple FAs of 5and 15 degrees before the Gadolinium contrast agent injection for calculating T1 maps. Semi-quantitative parameters including Relative Enhancement, Max Enhancement, Max Relative Enhancement,T0 ,Time To Peak, Wash In Rate, Wash Out Rate, Brevity of Enhancement, Area under the curve(AUC) were calculated by using the Philips-developed ISP Post-processing Workstation. Toft’s model was used for quantitative calculation of Ktrans (volume transfer constant),Kep (micro-vascular permeability reflux constant),Ve(extra-vascular extracellular space distribute volume per unit tissue volume),Vp (fractional plasma volume) and AUC(area under curve).All the above parameters were measured by drawing ROIs (Region of Interest) located at the edge and the center of the lesions. The measured parameters in benign and malignant lesions were compared by using the two sample T-test with SPSS software (version 16.0). A P value of less than 0.05 was considered statistically significant. And receiver operating characteristic (ROC) analysis was performed to assess the sensitivity and specificity of the parameter which showed significant differences between benign and malignant bone lesions. A support vector machine(SVM) was applied to identify malignant from benign bone tumors with the parameters selected by using fisher score which indicated the importance of a specific feature.Results
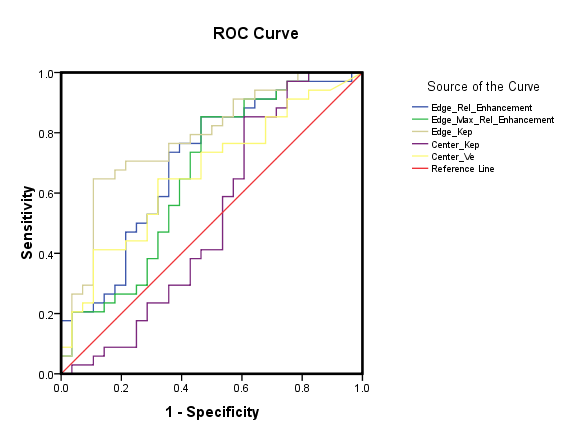
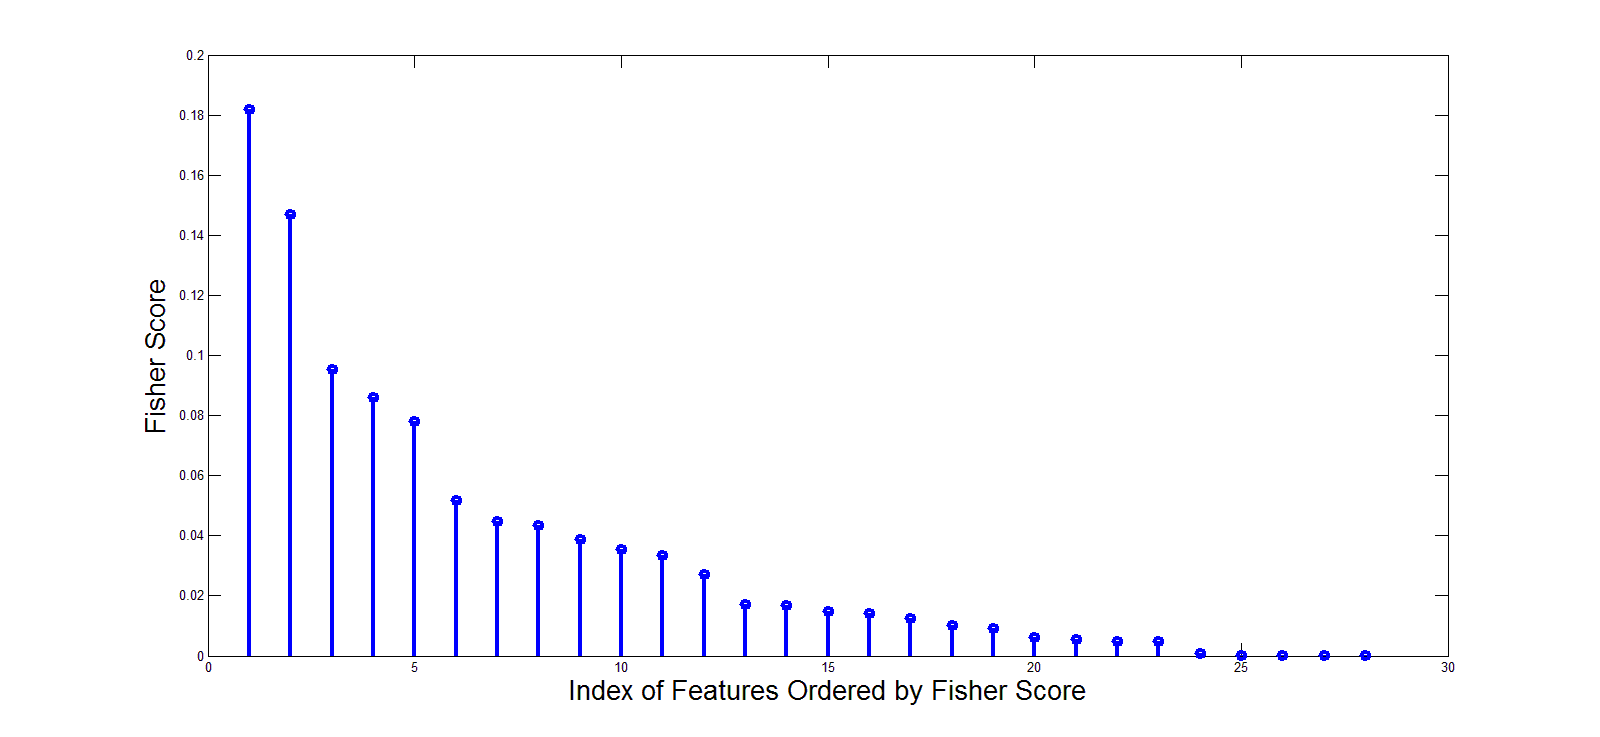
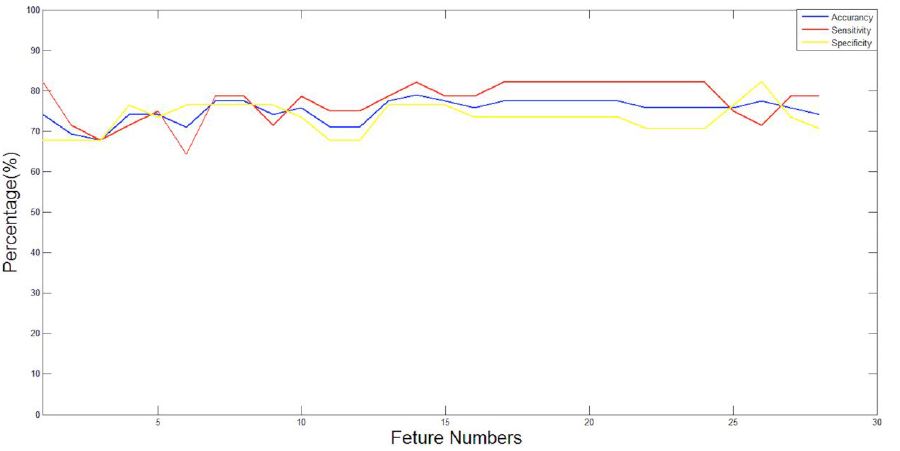
The results revealed that Edge_Rel Enhancement, Edge_Max Rel Enhancement, Edge_ Kep, Center_Kep and Center_Ve values is significantly different(P<0.05) between benign and malignant lesions. The ROC analysis results were shown in Figure 2, which showed the ability of the above parameters to differentiate benign and malignant lesions. And furtherly with different combinations of features ordered by fisher score (Figure 3), the SVM showed a high classification accuracy (about68%-78%), sensitivity (about 67%-81%) and specificity (about 68%-80%) for differentiating malignant from the benign lesions (Figure 4).Discussion
Semi-quantitative DCE cannot directly reflect the hemodynamic information of tumors, which was easily affected by scanning sequence parameters. Most studies suggested that only Max Rel Enhancement value can reveal density of micro-vessels of the bone tumor3.However, quantitative perfusion related parameters provide the information of vascular permeability and density of micro-vessels in characterizing the bone tumors directly, which can reflect the kind of the mass and further the malignant degree.Massive pathological micro-vessels around bone tumor would generate, which have an incomplete structure with a high permeability.The SVM was effective to distinguish malignant from the benign lesions with DCE perfusion features which would be helpful for the clinical diagnosis of the tumor.Conclusions
Both the semi-quantitative and quantitative DCE-MRI parameters are helpful for distinguishing malignant from benign bone tumors.Acknowledgements
No acknowledgement found.References
1.Alonzai R, Padhani AR, Allen C. Dynamic contrast enhanced MRI in prostate cancer[J].Eur J Radiol,2007,63(3):335-350.
2.Pickles MD, Lowry M, Manton DJ, et al. Role of dynamic contrast enhanced MRI in monitoring early response of locally advanced breast cancer to neoadjuvant chemotherapy[J].Breast Cancer Res Treat,2005,91(1):1-10.
3.Koyama H, Ohno Y, Seki S, et al. Magenetic resonance imaging for lung cancer[J]. J Thrrac Imaging,2013,28(3):138-150.
Figures