1443
Chemical Shift Quantitative Magnetic Susceptibility Study of Ex-vivo Human Cortical Bone Specimen with three-dimensional Cones ultra-short echo time (UTE) imaging1Department of Radiology, University of California, San Diego, San Diego, CA, United States, 2Institute of Electrical Engineering, Chinese Academy of Science, Beijing, China, 3GE Healthcare, San Diego, CA, United States, 4Department of Medicine, Division of Hematology/Oncology, University of California, San Diego, San Diego, CA, United States, 5Radiology Service, VA San Diego Healthcare System, San Diego, CA, United States
Synopsis
Bone mineral density (BMD) evaluation is crucial for the diagnosis of osteoporosis and related fractures. The purpose of this pilot study was to use a chemical-shift QSM method based on a 3D UTE-Cones sequence to assess the susceptibility values of human cortical bone specimens with consideration of gender and donor age, ranging over 5 decades. Significant differences between QSM values were observed for the different genders. A decaying trend between the minus QSM value and advancing age exists, which suggests a relationship between QSM values and BMD.
Introduction
Bone mineral density (BMD) evaluation is crucial for the diagnosis of osteoporosis and related fractures1. Quantitative susceptibility mapping (QSM) using a three-dimensional (3D) projection reconstruction ultra-short echo time (UTE)- based magnetic resonance imaging (MRI) sequence has been shown to be a non-x ray alternative for quantitative evaluation of BMD2. The purpose of this pilot study was to use a chemical-shift QSM method2,3 based on a 3D UTE-Cones sequence4 to assess the susceptibility values of human cortical bone specimens with consideration of gender and donor age, ranging over 5 decades.Methods
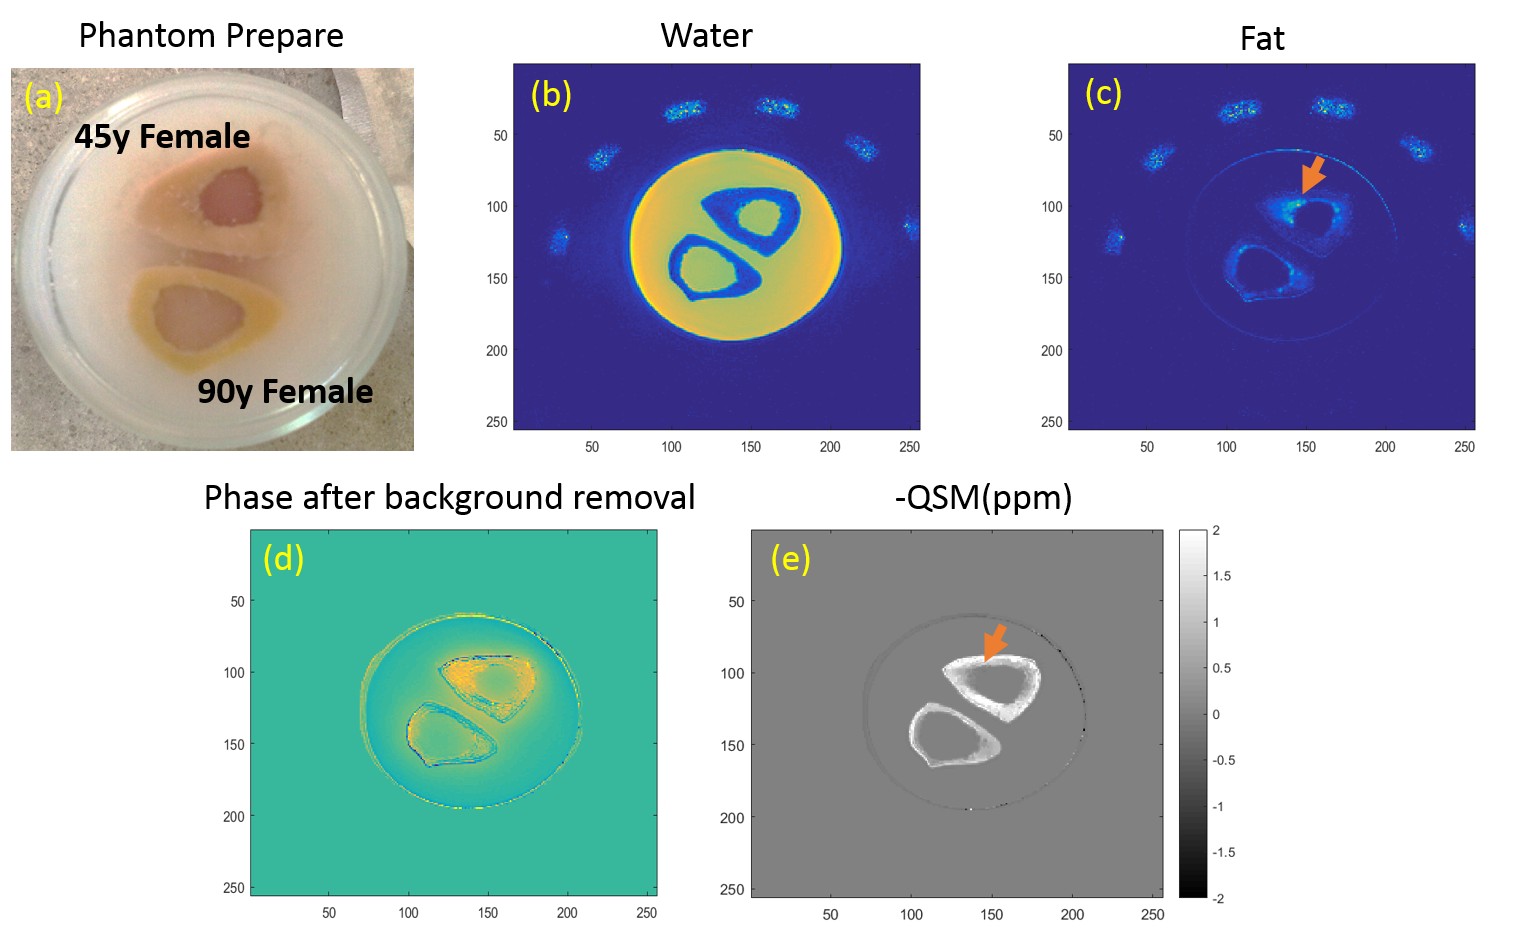
Sample Preparation: Cadaveric human cortical bone samples (n = 9) (6 females, 3 males, 38-95 years old) were obtained from tissue banks, as approved by our Institutional Review Board. These samples were sectioned and stored in a phosphate buffered saline (PBS) solution for 24 hours prior to imaging.
MRI Scan: During MRI scanning, the specimens were embedded in 1% agarose gel. MRI of the bone samples was performed on a 3T Signa HDxt scanner (GE Healthcare Technologies, Milwaukee, Wisconsin, USA) using a previously reported three-dimensional UTE Cones (3D UTE-Cones) sequence4. A transmit/receive quadrature coil (BC-10, Medspira, Minneapolis, Minnesota, USA) with a diameter of 22 cm was used for signal excitation and reception. Scan parameters included: sampling bandwidth (BW) = 83.3 kHz, flip angle = 10°, TR = 30 ms, matrix size = 256 × 256× 40, pixel size = 0.5 × 0.5 × 2 mm3. UTE images were acquired with a series of 6 TE delays (TE = 0.032, 0.2, 0.4, 1.2, 1.8, 2.4 ms).
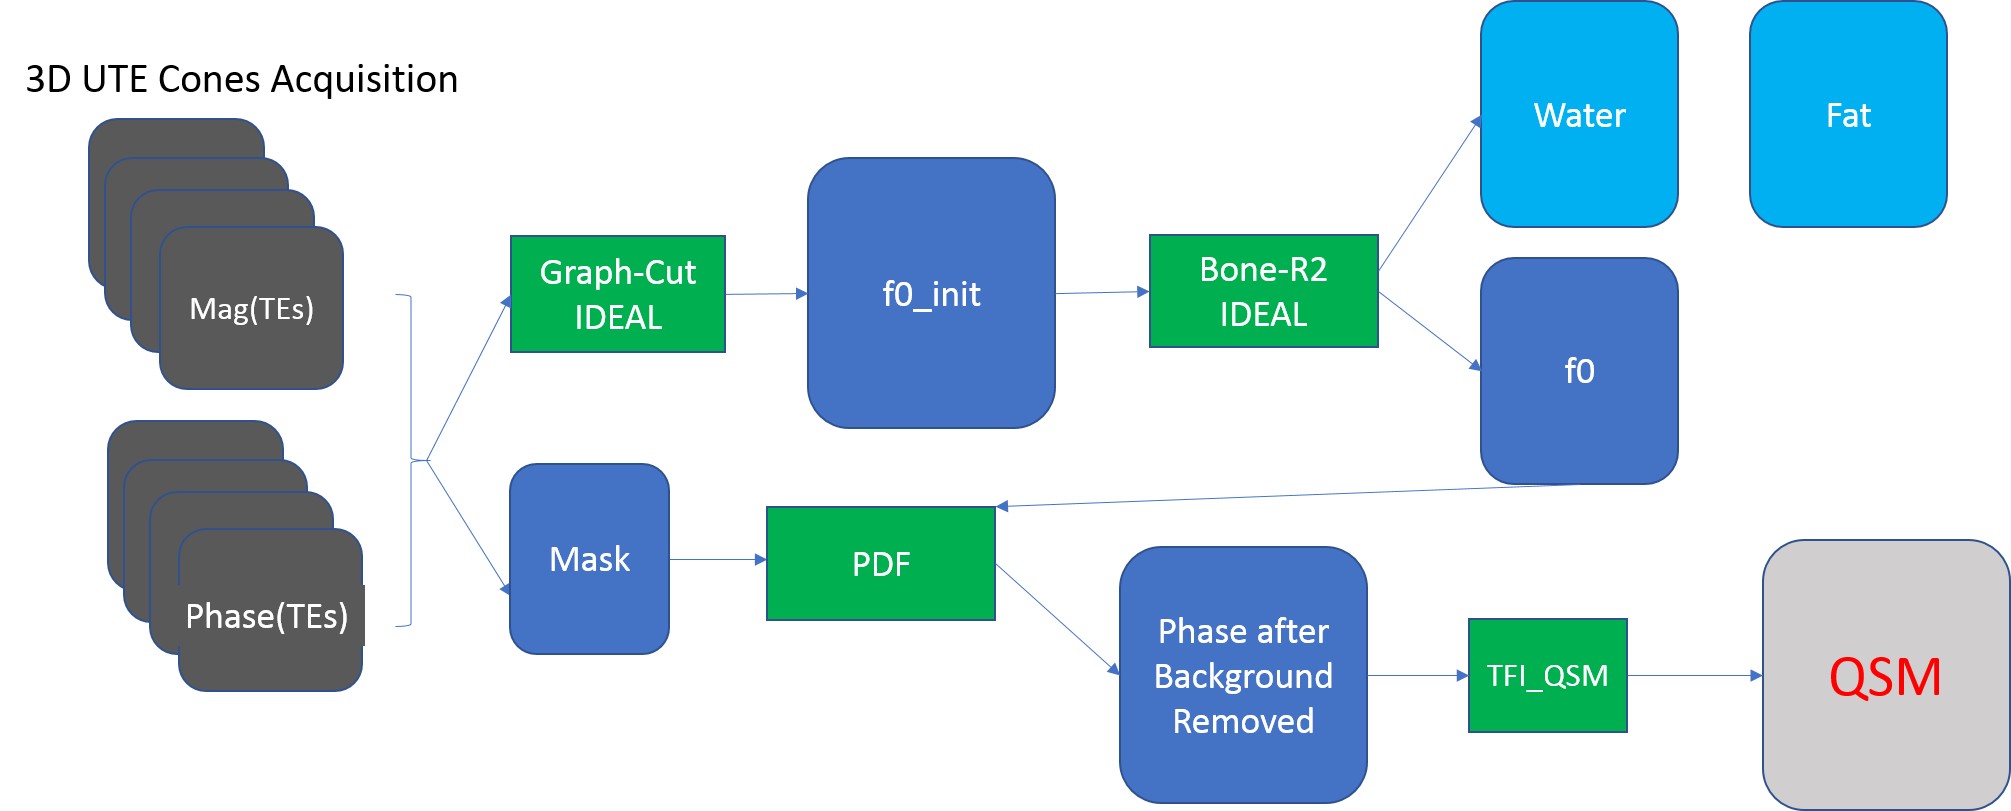
Chemical Shift QSM: Each UTE-Cones MRI data set was reconstructed using regridding, which interpolates the measured signal from the cones spokes onto a Cartesian grid. A field map estimation (f0_ini) was carried out using simultaneous phase unwrapping and removal of chemical shift using a graph cut algorithm5. Using an IDEAL processing algorithm, bone R2* with multipeak fat modeling2 was calculated and used to obtain the final field map estimation (f0). Then the f0 and mask were obtained to remove the background field with a projection onto dipole fields (PDF) method6. Finally, QSM values were calculated using the total field inversion (TFI) pipeline7.
Statistical Analysis: Regions of interests (ROIs) for QSM of each specimen were carefully selected to cover the bone area. The Student’s t-test for the difference between means QSM values of female and male donors were carried out, and correlation analysis was performed with age of the female bone specimens using Excel (Microsoft Inc. Redmond, Washington, USA).
Results
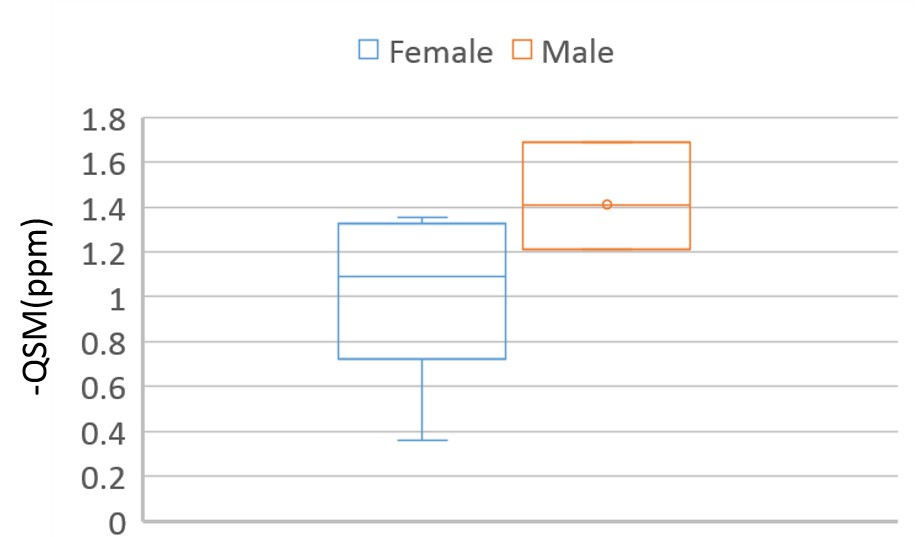
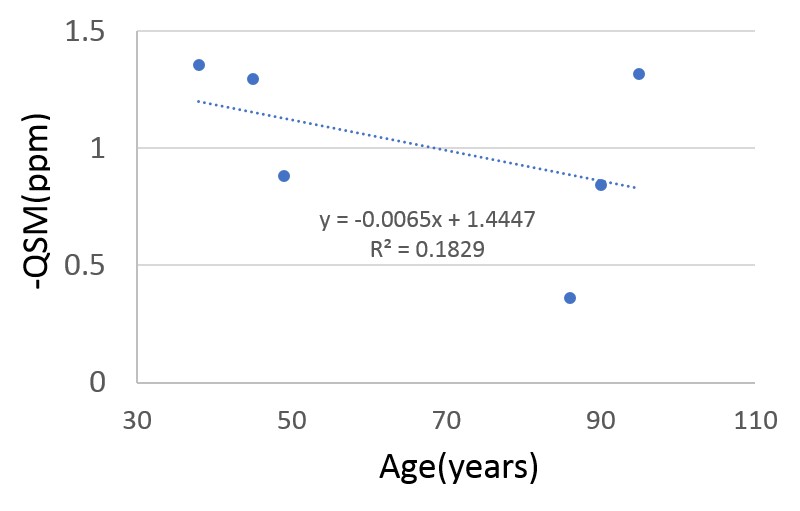
Figure 2 shows typical results (water, fat, phase and QSM) for two specimens (45-year-old female and 90-year-old female). From (c) and (e), it is demonstrated that fat regions have a lower QSM value, indicated with arrows. Figure 3 shows the box-plot of median QSM ROI values for 6 female bone specimens versus 3 male bone specimens. The QSM value of the male group is significantly bigger than the female group (-1.01 ppm for female, -1.47 ppm for male, p < 0.05). Figure 4 shows the -QSM values of the female bones as plotted against advancing age, with a decreasing trend observed.Discussion and Conclusion
Based on 3D UTE-Cones sequences, chemical shift QSM were evaluated for 9 human cortical bone specimens. Significant differences between QSM values were observed for the different genders. A decaying trend between the minus QSM value and advancing age exists, which suggests a relationship between QSM values and BMD. Further validation studies will be performed to build on these results, including studies employing more specimens (n >20) , micro computed tomography (CT) and histological correlation.Acknowledgements
The authors acknowledge grant support from NIH (1R01 AR062581 and 1R01 AR068987), VA Clinical Science Research and Development Service (Merit Award I01CX001388), National Natural Science Foundation of China (NSFC 51607169) and GE Healthcare.References
1. Kanis JA. Diagnosis of osteoporosis and assessment of fracture risk. Lancet 2002; 359:1929–1936.
2. Dimov A V., Liu Z, Spincemaille P, Prince MR, Du J, Wang Y. Bone quantitative susceptibility mapping using a chemical species-specific R2* signal model with ultrashort and conventional echo data. Magnetic Resonance in Medicine 2017
3. Xing Lu, Annette von Drygalski, Alexey Dimov, Lena Volland, Zhe Liu, Yi Wang, Jiang Du, and Eric Y Chang. Ultrashort Echo Time Chemical Shift Quantitative Susceptibility Mapping (UTE-CS-QSM) for Hemosiderin Assessment in Hemophilic Arthropathy. Proc. Intl. Soc. Mag. Reson. Med. 25 (2017)
4. Carl M, Bydder GM, Du J. UTE imaging with simultaneous water and fat signal suppression using a time-efficient multispoke inversion recovery pulse sequence. Magnetic Resonance in Medicine 2016;76:577–582.
5. Hernando D, Kellman P, Haldar JP, Liang ZP. Robust water/fat separation in the presence of large field inhomogeneities using a graph cut algorithm. Magn Reson Med. 2010 Jan;63(1):79-90.
6.Liu T, Khalidov I, de Rochefort L, et al. A novel background field removal method for MRI using projection onto dipole fields (PDF). NMR in biomedicine. 2011;24(9):1129-1136. doi:10.1002/nbm.1670.
7. Liu, Z., Kee, Y., Zhou, D., Wang, Y. and Spincemaille, P. , Preconditioned total field inversion (TFI) method for quantitative susceptibility mapping. Magn. Reson. Med.2017, 78: 303–315.
Figures