1440
Fat Fraction Thresholds for Defining Bone Marrow Edema and Fat Metaplasia in Spondyloarthritis: More Objective than ‘A Tiny Bit of White’1Centre for Medical Imaging, University College London, London, United Kingdom, 2Arthritis Research UK Centre for Adolescent Rheumatology, University College London, London, United Kingdom, 3Department of Medical Physics, University College London Hospitals, London, United Kingdom
Synopsis
MRI is now widely used to diagnose spondyloarthritis, but existing methods for image analysis rely on qualitative visual analysis by radiologists, and suffer from poor reproducibility between observers. Here, we show that proton density fat fraction (PDFF) measurements can be used as an objective, quantitative alternative to visual analysis. Using receiver operating characteristic (ROC) analysis, we find that PDFF measurements enable accurate separation of bone marrow edema (active inflammation) and fat metaplasia (structural damage) from normal marrow. The described approach is more objective than looking for 'a tiny bit of white' on fat-suppressed images, which is the current clinical standard.
Purpose
The spondyloarthritides are a group of diseases characterised by spinal inflammation and new bone formation (causing joint fusion), with a substantial burden of morbidity and disability. MRI is now widely used to diagnose spondyloarthritis, and has been recommended in recent clinical guidelines [1]. However, existing methods for image analysis rely on qualitatitive interpretation by a radiologist, which is subjective and depends heavily on the expertise and opinion of the reader. Recently, clinical guidelines have been criticised on the basis that the observer needs to identify ‘a tiny bit of white’ on two consecutive slices, which is a subjective and nonspecific finding [2]. Therefore, there is an unmet need for an objective, quantitative method for identifying inflammation which is reproducible across sites and does not vary depending on the radiologist or rheumatologist reading the scans. Recent work has shown that proton density fat fraction (PDFF), as measured using chemical shift-encoded MRI (CSE-MRI), can be used to as a quantitative marker of both active inflammation – edema - and also structural damage in the form of fat metaplasia [3]. We aimed to extend this work using receiver-operating characteristic (ROC) analysis to obtain PDFF thresholds which could be used to separate edema and fat metaplasia from normal marrow in an objective fashion.Methods
Eight patients with spondyloarthritis and ten controls were scanned on a 3T system (Ingenia, Philips, Amsterdam, Netherlands) with integrated posterior and anterior surface coils using a vendor-supplied 3D spoiled gradient echo acquisition using bipolar readout gradients (first echo time 1.17ms, echo spacing 1.6ms, TR 25ms, flip angle 3°, matrix size 320 x 320, resolution 1.76 x 1.76 x 2mm), as described previously [3]. Images were acquired in a tilted coronal plane parallel to the long axis of the sacrum. PDFF and R2* maps were generated inline, assuming a 10-peak model of human adipose tissue [4,5]. Areas of bone marrow edema and fat metaplasia were identified using conventional short tau inversion recovery (STIR) and T1-weighted sequences; regions-of-interest (ROIs) were placed on those areas and transferred to PDFF maps. Mean PDFF and R2* values were recorded for each ROI. ROC analyses were then used to determine the optimal PDFF cut-off values for differentiating bone marrow edema from normal marrow (or fat metaplasia), and fat metaplasia from normal marrow (or edema). The optimal operating point on the curve was defined as that which was intersected by a 45° line from the top left corner of the ROC plot.Results
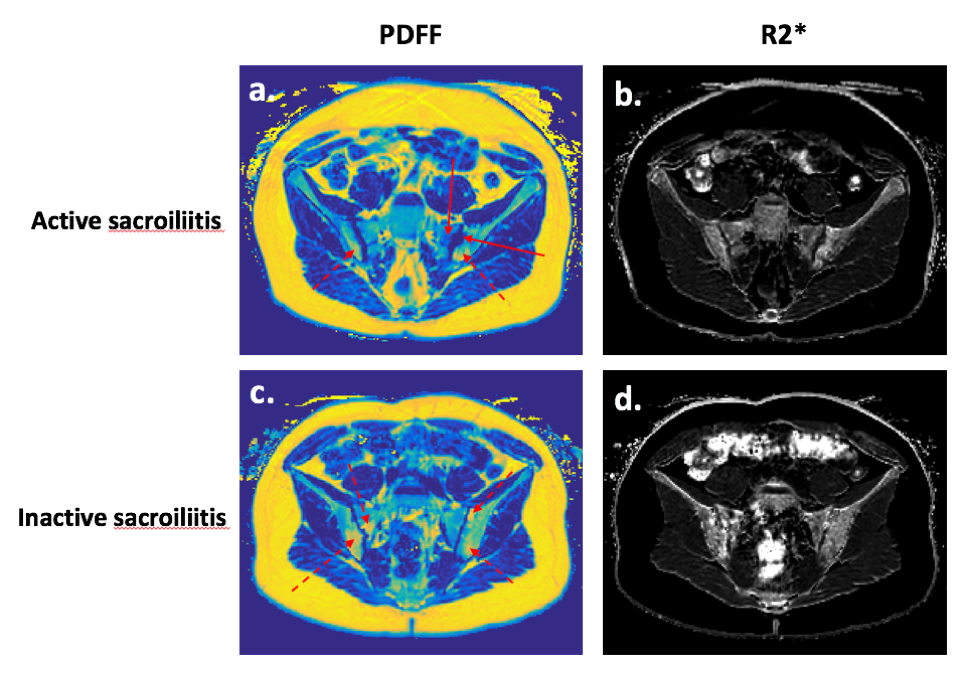
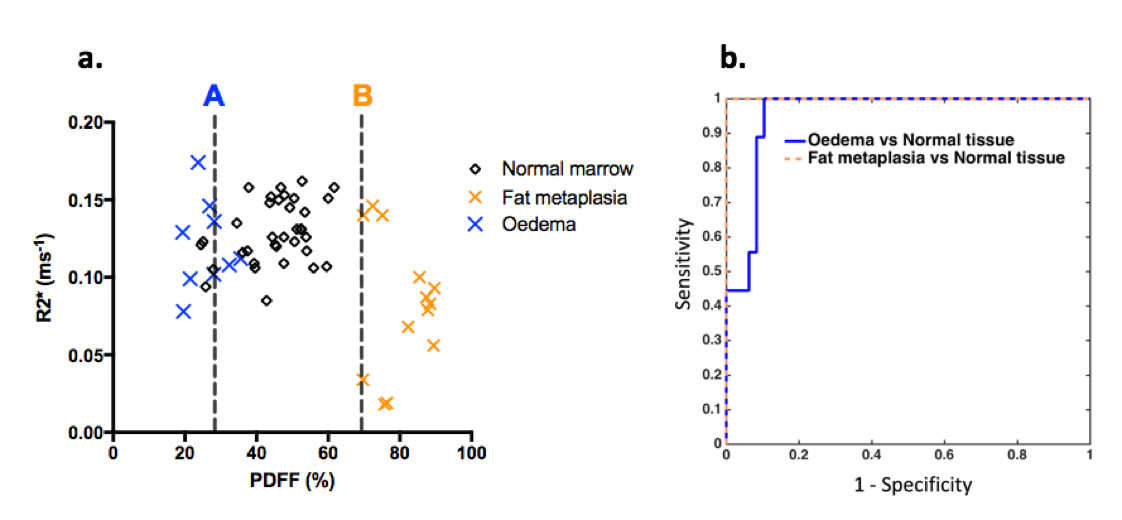
Examples of PDFF and R2* maps from patients with areas of active sacroiliitis (a,b) and inactive sacroiliitis (c,d) are shown in Fig 1. Note that the PDFF of normal marrow is approximately 50%; PDFF measurements are reduced in areas of edema (a,b) and increased in areas of fat metaplasia (c,d). Fig 2a shows a grouped scatterplot of PDFF and R2* measurements in areas of bone marrow edema, fat metaplasia and normal marrow. Optimal PDFF cut-off values, derived from the ROC analysis, for differentiating oedema (A) and fat metaplasia (B) from normal marrow are superimposed as dotted lines. Fig 2b shows the results of the ROC analysis itself. The optimal PDFF cut-off for differentiating oedema from normal marrow or fat metaplasia was 28.2%, giving a sensitivity of 89% and a specificity of 92% (AUC=0.95). The optimal PDFF cut-off for differentiating fat metaplasia from normal marrow or oedema was 69.7%, giving a sensitivitity of 100% and a specificity of 100% (AUC=1).Discussion
Our data indicate that PDFF measurements can be used to differentiate between bone marrow edema, fat metaplasia and normal marrow with a high degree of accuracy. PDFF mapping could therefore be used as an objective, quantitative alternative to current qualitative systems for diagnosis and assessment of disease severity. This approach is more objective than looking for ‘a tiny bit of white’ on two consecutive slices, which represents the existing clinical standard [2]. Importantly, and in stark contrast to visual analysis, PDFF measurements are both accurate and reproducible, even when measurements are performed at multiple sites [3,6,7].
The proposed thresholds enable the identification of both active inflammation and structural damage in a single, volumetric acquisition, with a potentially dramatic reduction in acquisition times compared to conventional spin echo sequences [1]. Furthermore, the thresholds could potentially be applied on a pixel-by-pixel basis, enabling separate quantification of active and chronic inflammation in individual patients.
In the future, methods for separating edema/fat from normal marrow could be extended using more complex analyses such as logistic regression or deep learning, potentially incorporating additional parameters such as R2*, T1, T2 and susceptibility. All of these methods can be rigorously tested and validated, avoiding the subjectivity that is currently inherent to clinical MRI.
Acknowledgements
This work was undertaken at UCLH/UCL, which receives funding from the Department of Health’s NIHR Biomedical Research Centre funding scheme. The views expressed in this publication are those of the authors and not necessarily those of the UK Department of Health.
TJPB is funded by Arthritis Research UK Grant 21369. CF is also funded by Arthritis Research UK.
References
1. Sieper J, Rudwaleit M, Baraliakos X, Brandt J, Braun J, Burgos-Vargas R, et al. The Assessment of SpondyloArthritis international Society (ASAS) handbook: a guide to assess spondyloarthritis. Ann Rheum Dis. 2009;68 Suppl 2(May):ii1-44.
2. Deodhar A. Editorial: Sacroiliac Joint Magnetic Resonance Imaging in the Diagnosis of Axial Spondyloarthritis: ‘A Tiny Bit of White on Two Consecutive Slices’ May Be Objective, but Not Specific. Arthritis Rheumatol. 2016;68(4):775-8. doi: 10.1002/art.39549.
3. Bray TJP, Bainbridge A, Punwani S, Ioannou Y, Hall-Craggs M. Simultaneous Quantification of Bone Edema/Adiposity and Structure in Inflamed Bone Using Chemical Shift-Encoded MRI in Spondyloarthritis. Magn Reson Med. 2017; doi: 10.1002/mrm.26729.
4. Kukuk GM, Hittatiya K, Sprinkart AM, Eggers H, Gieseke J, Block W, et al. Comparison between modified Dixon MRI techniques, MR spectroscopic relaxometry, and different histologic quantification methods in the assessment of hepatic steatosis. Eur Radiol. 2015;25(10):2869–79.
5. Ren J, Dimitrov I, Sherry AD, Malloy CR. Composition of adipose tissue and marrow fat in humans by 1H NMR at 7 Tesla. J Lipid Res. 2008;49(9):2055–62.
6. Hernando D, Sharma SD, Aliyari Ghasabeh M, Alvis BD, Arora SS, Hamilton G, et al. Multisite, multivendor validation of the accuracy and reproducibility of proton-density fat-fraction quantification at 1.5T and 3T using a fat-water phantom. Magn Reson Med. 2017;77(4):1516-1524. doi: 10.1002/mrm.26228.
7. Lukas C, Braun J, Van Der Heijde D, Hermann KGA, Rudwaleit M, Østergaard M, et al. Scoring inflammatory activity of the spine by magnetic resonance imaging in ankylosing spondylitis: A multireader experiment. J Rheumatol. 2007;34(4):862-70.
Figures