1438
Does chemical shift imaging offer a biomarker for the diagnosis and assessment of disease severity in multiple myeloma?1Department of Diagnostic Radiology, Hiroshima University Hospital, Hiroshima, Japan
Synopsis
We investigated whether chemical shift imaging (CSI) is useful for differentiating multiple myeloma infiltration from hematopoietic bone marrow and for quantitatively assessing disease severity. For those myeloma patients with relatively high cellularity in the bone marrow, a lower signal drop on oppose phase images indicated a higher tumor burden. For bone marrow with relatively low cellularity, disease severity was not reflected on CSI. CSI did not prove useful for differentiating myeloma infiltration from hematopoietic bone marrow, which implies that differentiation between regrowth of hematopoietic bone marrow and minimal residual disease or relapse after chemotherapy might be difficult with CSI.
INTRODUCTION
Multiple myeloma (MM) is a hematological malignancy characterized by the clonal expansion of plasma cells within the bone marrow (BM). Although the diffuse infiltration pattern on MRI has proved to be a reliable biomarker for worse prognosis1,2, it has not been included in any MM diagnostic criteria because assessment of non-focal tumor infiltration on MRI can be subjective. Chemical shift imaging (CSI) has an additive effect on in-phase (IP) signal images with at least a 20% loss of signal on opposed phase (OP) images3 when a voxel contains fat and water, and has been reported to be useful for differentiating marrow-replacing tumor from hematopoietic BM4. The purpose of this study was to investigate whether CSI is useful for differentiating myeloma infiltration from hematopoietic BM and for quantitatively assessing disease severity.METHODS:
Seventy-one newly diagnosed myeloma patients (35 men, 67.0±12.2 years; 36 women, 66.5±10.5 years) were included in the study. Age-matched control subjects (n=30; 61.0±11.0 years) without history of malignancy were randomly selected from our radiology information system. Spinal imaging was performed using a 3.0-T MRI unit (Signa HDxt 3T; GE Healthcare) with the following sequences: sagittal T1 fast spin echo (FSE); sagittal fat suppressed-T2 FSE; and a sagittal CSI IDEAL T2 FSE sequence (TR, 4000ms; TE, 112.4ms; number of signal averages, 3). Co-registered water, fat, IP, and OP images were generated using the IDEAL software. Mean signal intensity was calculated from operator-determined regions of interest (ROIs) within the BM of L1-L3 vertebral bodies without a focal lesion. If one of the three vertebrae was fractured or had a focal lesion with a long axis larger than 0.5 cm, the patient was excluded from the analysis. The fat-signal fraction (FF) from IDEAL images was calculated from the ratio of the signal intensity in the fat image divided by the signal intensity of the IP image. Mean signal dropout ratio (DR) was calculated as the ratio of the SNR difference between IP and OP images to the SNR of IP images. The BM plasma cell percentage (%BMPC) in biopsy specimens was obtained from the iliac crest. Serological data, including serum monoclonal protein (M protein), albumin, β2-microglobulin, κ/λ ratio and blood counts were obtained for myeloma patients, and blood counts were obtained for the control subjects. Patients were divided into two groups: a water-dominant group (FF<50%, n=22) and a fat-dominant group (FF>50%, n=49), since the DR is highest when FF=50%. Spearman correlation coefficients between the DR and each clinical parameter were calculated. Values of P<0.05 were considered significant.RESULTS
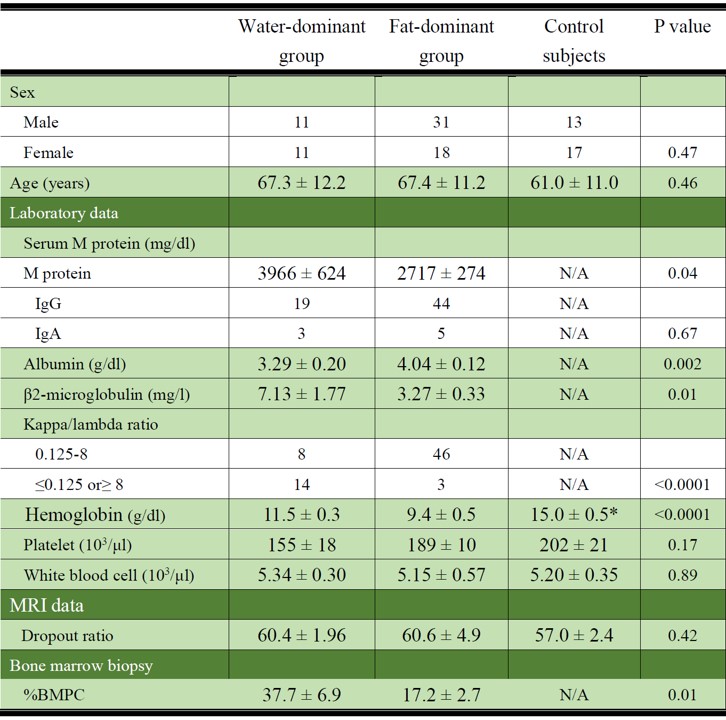
Age and DR did not differ significantly among the three groups: water-dominant, fat-dominant, and control (Table 1). For the water-dominant group, serum M protein, β2-microglobulin, and %BMPC were significantly greater and albumin was significantly smaller than those for the fat-dominant group (P=0.04, P=0.01, P=0.01, P=0.002, respectively). For the water-dominant group, DR was significantly correlated with %BMPC (ρ=-0.662, P=0.003) and serum M protein (ρ=-0.586, P=0.008, Table 2, Figure 1). For the fat-dominant group, no significant correlations were found between DR and any of the clinical parameters. For the control group, DR showed a weak correlation with age (ρ=-0.409, P=0.03) but no correlation with other clinical factors.DISCUSSION
In the present study, DR showed no significant difference between myeloma patients and controls. This result is concordant with a previous report5 that showed a potential pitfall of CSI of the hematopoietic BM includes infiltrative myeloma as signal dropout on opposed phase images due to the presence of both fat and water protons in the same voxels occurs in both conditions. For patients with MM, uneven proportions of fat and water protons in the BM had clinical significance. For patients with BM with relatively high cellularity, clinical indices such as serum M protein and %BMPC, which are considered to be related to tumor mass, were significantly correlated with DR whereas for fatty marrow, no significant correlation between DR and clinical factors was observed. It is possible that tumor cells and hematopoietic BM might coexist in the BM of patients with mild to moderate myeloma, which results in tumor masses not being reflected on CSI.CONCLUSION
For those MM patients with relatively high cellularity in the BM, a lower signal drop on OP images indicated a higher tumor burden. For BM with relatively low cellularity, disease severity was not reflected on CSI. CSI did not prove useful for differentiating myeloma infiltration from hematopoietic BM, which implies that differentiation between regrowth of hematopoietic BM and minimal residual disease or relapse after chemotherapy might be difficult with CSI.Acknowledgements
No acknowledgement found.References
1. Moulopoulos LA, Gika D, Anagnostopoulos A, et al. Prognostic significance of magnetic resonance imaging of bone marrow in previously untreated patients with multiple myeloma. Ann Oncol. 2005:16:1824-1828.
2. Moulopoulos LA, Dimopoulos MA, Kastritis E, et al. Diffuse pattern of bone marrow involvement on magnetic resonance imaging is associated with high risk cytogenetics and poor outcome in newly diagnosed, symptomatic patients with multiple myeloma: A single center experience on 228 patients. Am J Hematol. 2012:87:861-864.
3. Dixon WT. Simple proton spectroscopic imaging. Radiology. 1984:153:189-194.
4. Zajick DC Jr, Morrison WB, Schweitzer ME, et al. Benign and malignant processes: normal values and differentiation with chemical shift MR imaging in vertebral marrow. Radiology. 2005:237: 590-596.
5. Swartz1 PG, Roberts CC. Radiological Reasoning: Bone Marrow Changes on MRI. AJR Am J Roentgenol. 2009:193: S1-4.
Figures