1433
Feasibility of monosodium urate assessment using multi-echo gradient echo based quantitative imaging1Seoul St.Mary's Hospital, College of Medicine, The Catholic University of Korea, Seoul, Republic of Korea
Synopsis
Gout is a common disease caused by monosodium urate (MSU) accumulation in joints. Although conventional MR imaging well describes generic features of inflammation, sensitivity of MSU is relatively low compared to dual energy CT. Because MSU has diamagnetic susceptibility, high sensitivity can be expected in magnetic susceptibility related contrast imaging. However, calcium is another diamagnetic material existing in joints. Therefore, distinguishing MSU and calcium is an essential step for imaging MSU. In this context, we investigate the feasibility of multi-echo gradient echo based quantitative imaging for MSU assessment.
Purpose
Gout is a common inflammatory disease caused by monosodium urate (MSU) deposition in joints. Dual energy computed tomography (DECT) has been utilized for noninvasive MSU imaging due to its ability to distinguish between MSnd calcium.1,2 Although conventional MR imaging well describes generic features of inflammation, sensitivity of MSU is relatively low compared to CT. Recently, multi-echo gradient echo (mGRE) based quantitative images (R2* and quantitative susceptibility maps) have been getting attention as an assessment tool for iron or calcium because of its high sensitivity to magnetic susceptibility induced B0 field perturbations.3,4 Because MSU has diamagnetic susceptibility, high sensitivity can be expected in mGRE imaging. However, calcium is another diamagnetic material existing in joints. Therefore, distinguishing MSU and calcium is an essential step for imaging MSU. In this study, we investigate the feasibility of mGRE based quantitative imaging for MSU assessment.
Methods
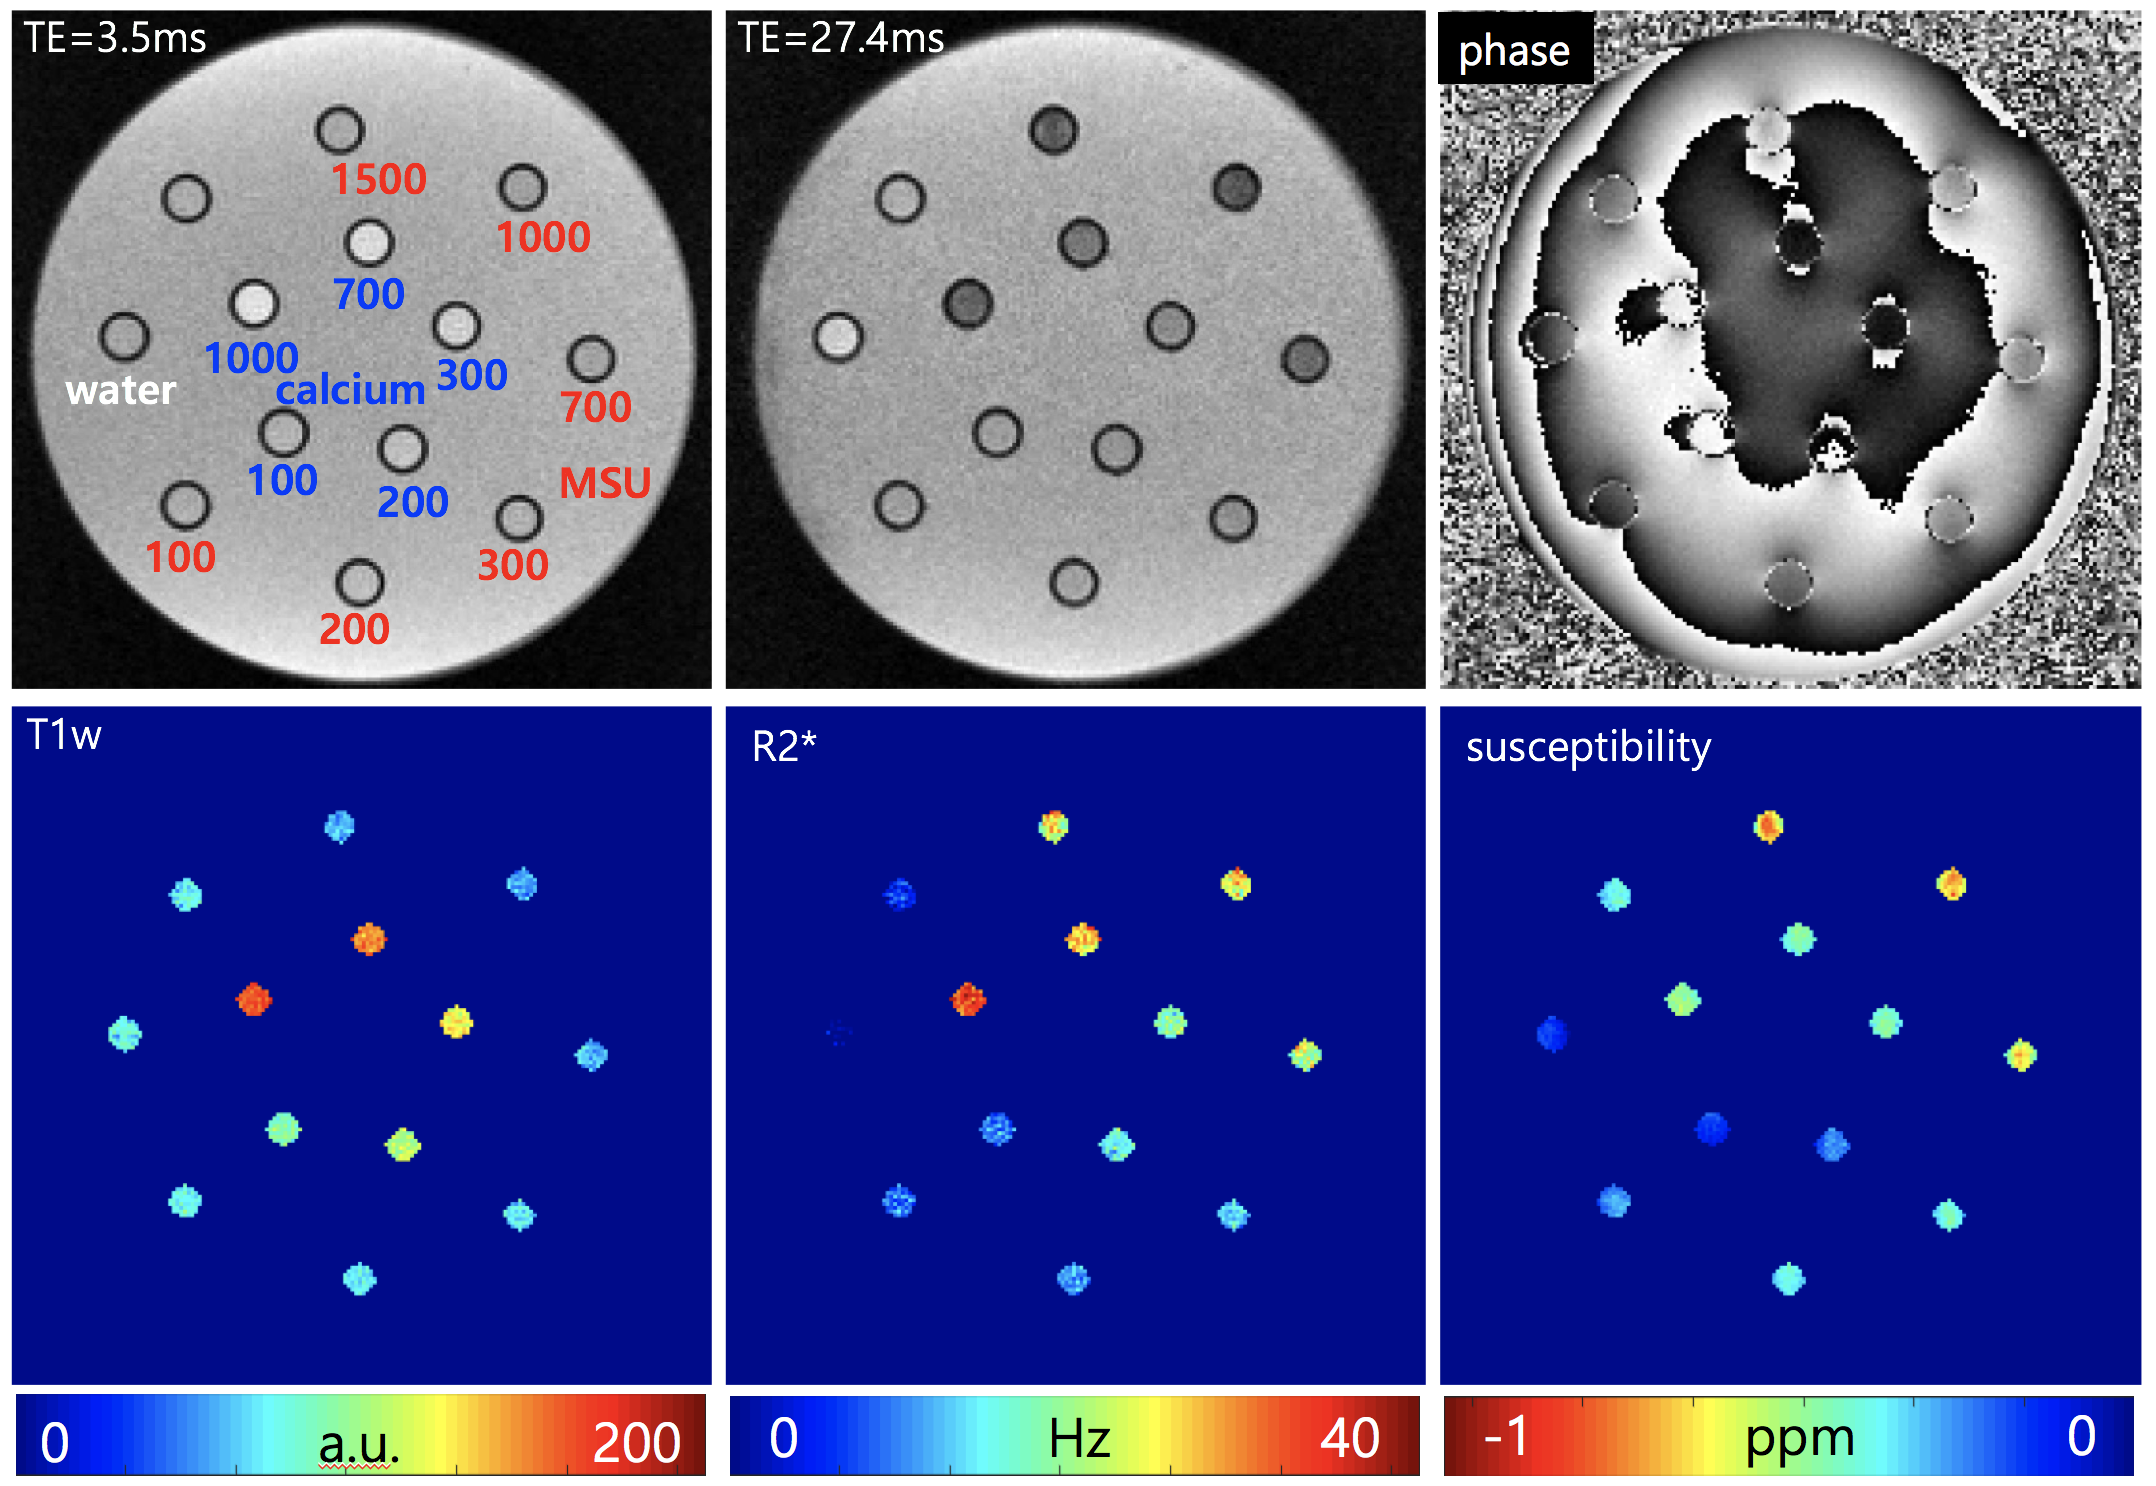
Phantom experiments Vials of MSU (uric acid powder 99%) and calcium (calcium pyrophosphate powder 99%) with different concentrations (100, 200, 300, 700, 1000 mmol/L) were placed in a plastic container as illustrated in Fig.1. Vial with only water was also placed as a reference. The empty space in the container was filled with agarose gel. The phantom was scanned at 3T clinical MRI (Verio, Siemens) with following parameters: 3D six echo GRE, TR = 32 ms, TE = 3.5/8.3/13.1/17.9/22.7/27.4 ms, flip angle = 16 °, in-plane resolution = 0.5 x 0.5 mm2, slice thickness = 0.5 mm, R = 2 for GRAPPA, NEX = 8. The orientation of each vial relative to B0 was perpendicular. Using the obtained mGRE data, R2* and quantitative susceptibility maps were calculated. R2* was estimated from the multi-echo magnitude images by a mono-exponential fitting and magnetic susceptibility was calculated from the multi-echo phase images by dipole inversion process after background phase removal.4 For each vial region, first echo magnitude (T1w signal intensity), R2* and susceptibility values were calculated. In addition, the ratio of R2* and susceptibility was also calculated.
In vivo experiments Both MRI and DECT were performed for two gout patients with IRB approval. Following protocols for MRI and DECT were used for MSU imaging in gout patients, respectively. At 3T clinical scanner, 3D four echo GRE was obtained (Verio, Siemens) equipped with 8-ch knee coil with following parameters: TR = 36 ms, TE = 7.5/15.0/22.5/30.0 ms, flip angle = 15 °, in-plane resolution = 0.36 x 0.36 mm2, slice thickness = 2 mm, R =2 for GRAPPA, NEX = 1. DECT was performed at 64-row dual-source CT scanner (Somatom Definition, Siemens). The scan parameters of DECT were as followed: tube A with 140kV and 55mAS and tube B with 80 kV and 243 mAs; soft tissue was used as standard with parameters of 80kV (50HU) and 140kV (50HU); Kernels for reconstruction: B30s and D30s. For in vivo data, R2* and susceptibility maps were generated using mGRE data. The generated maps were visually compared with the CT images from the aspect of MSU and calcification assessment.
Results
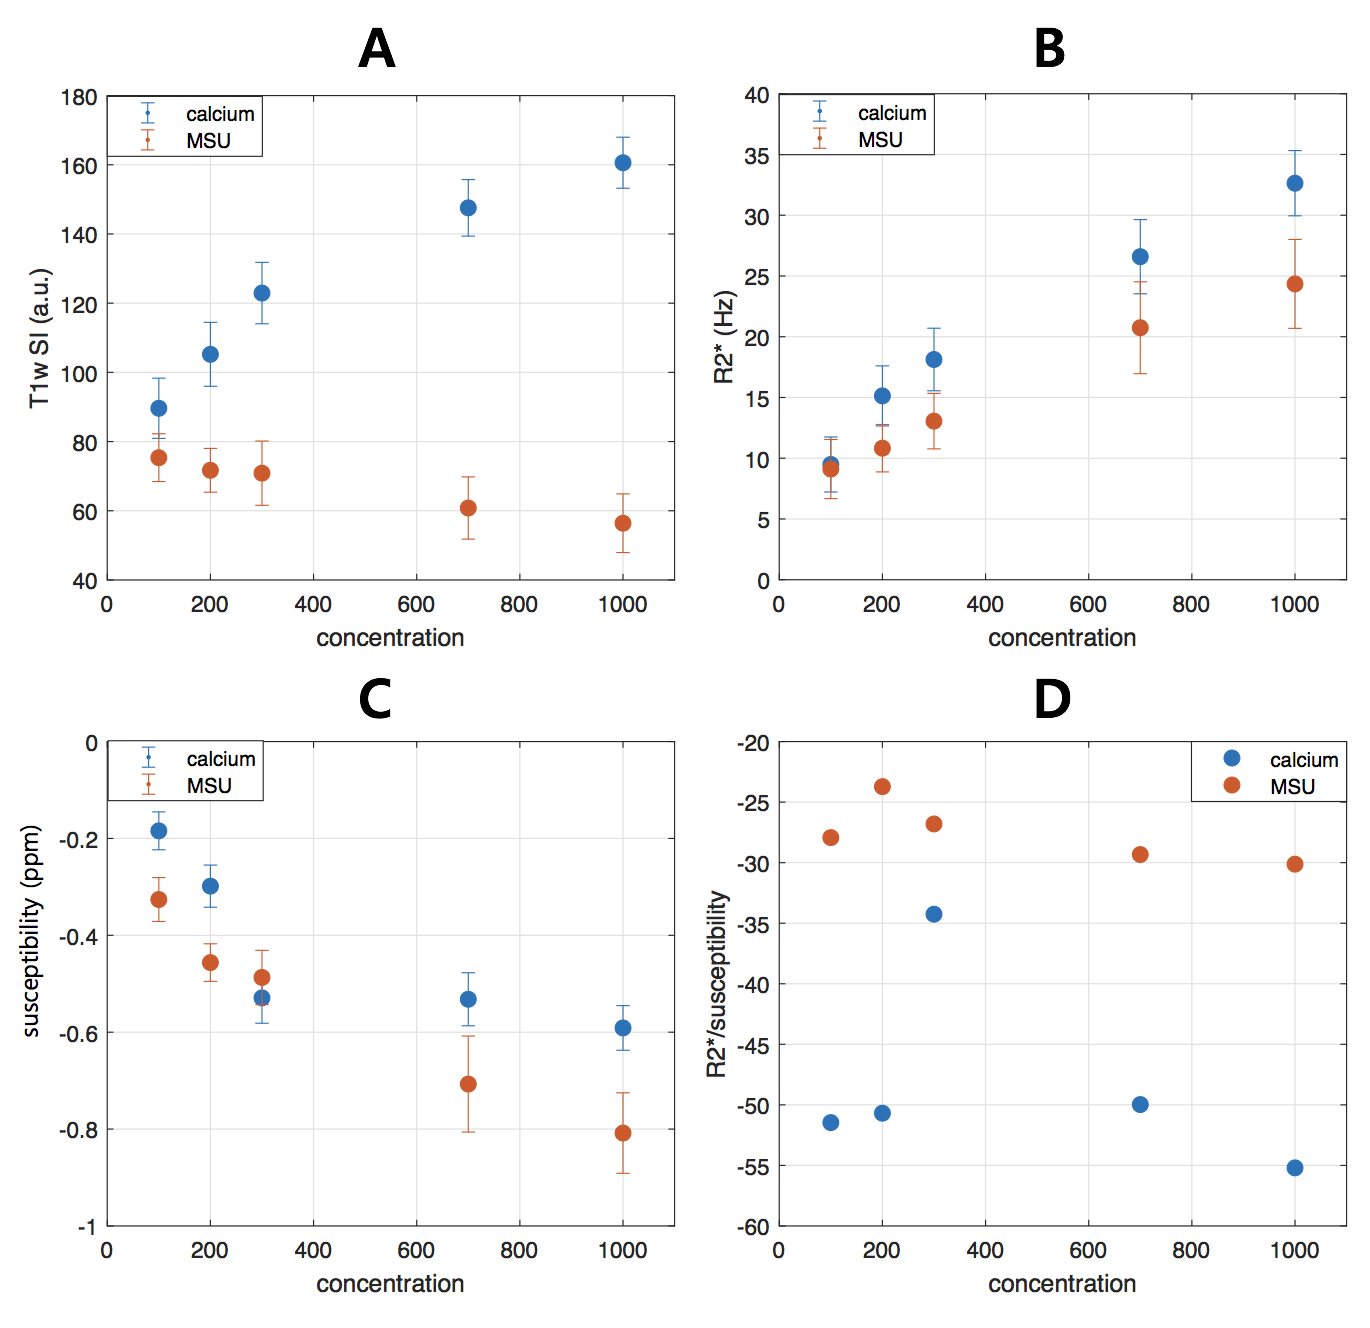
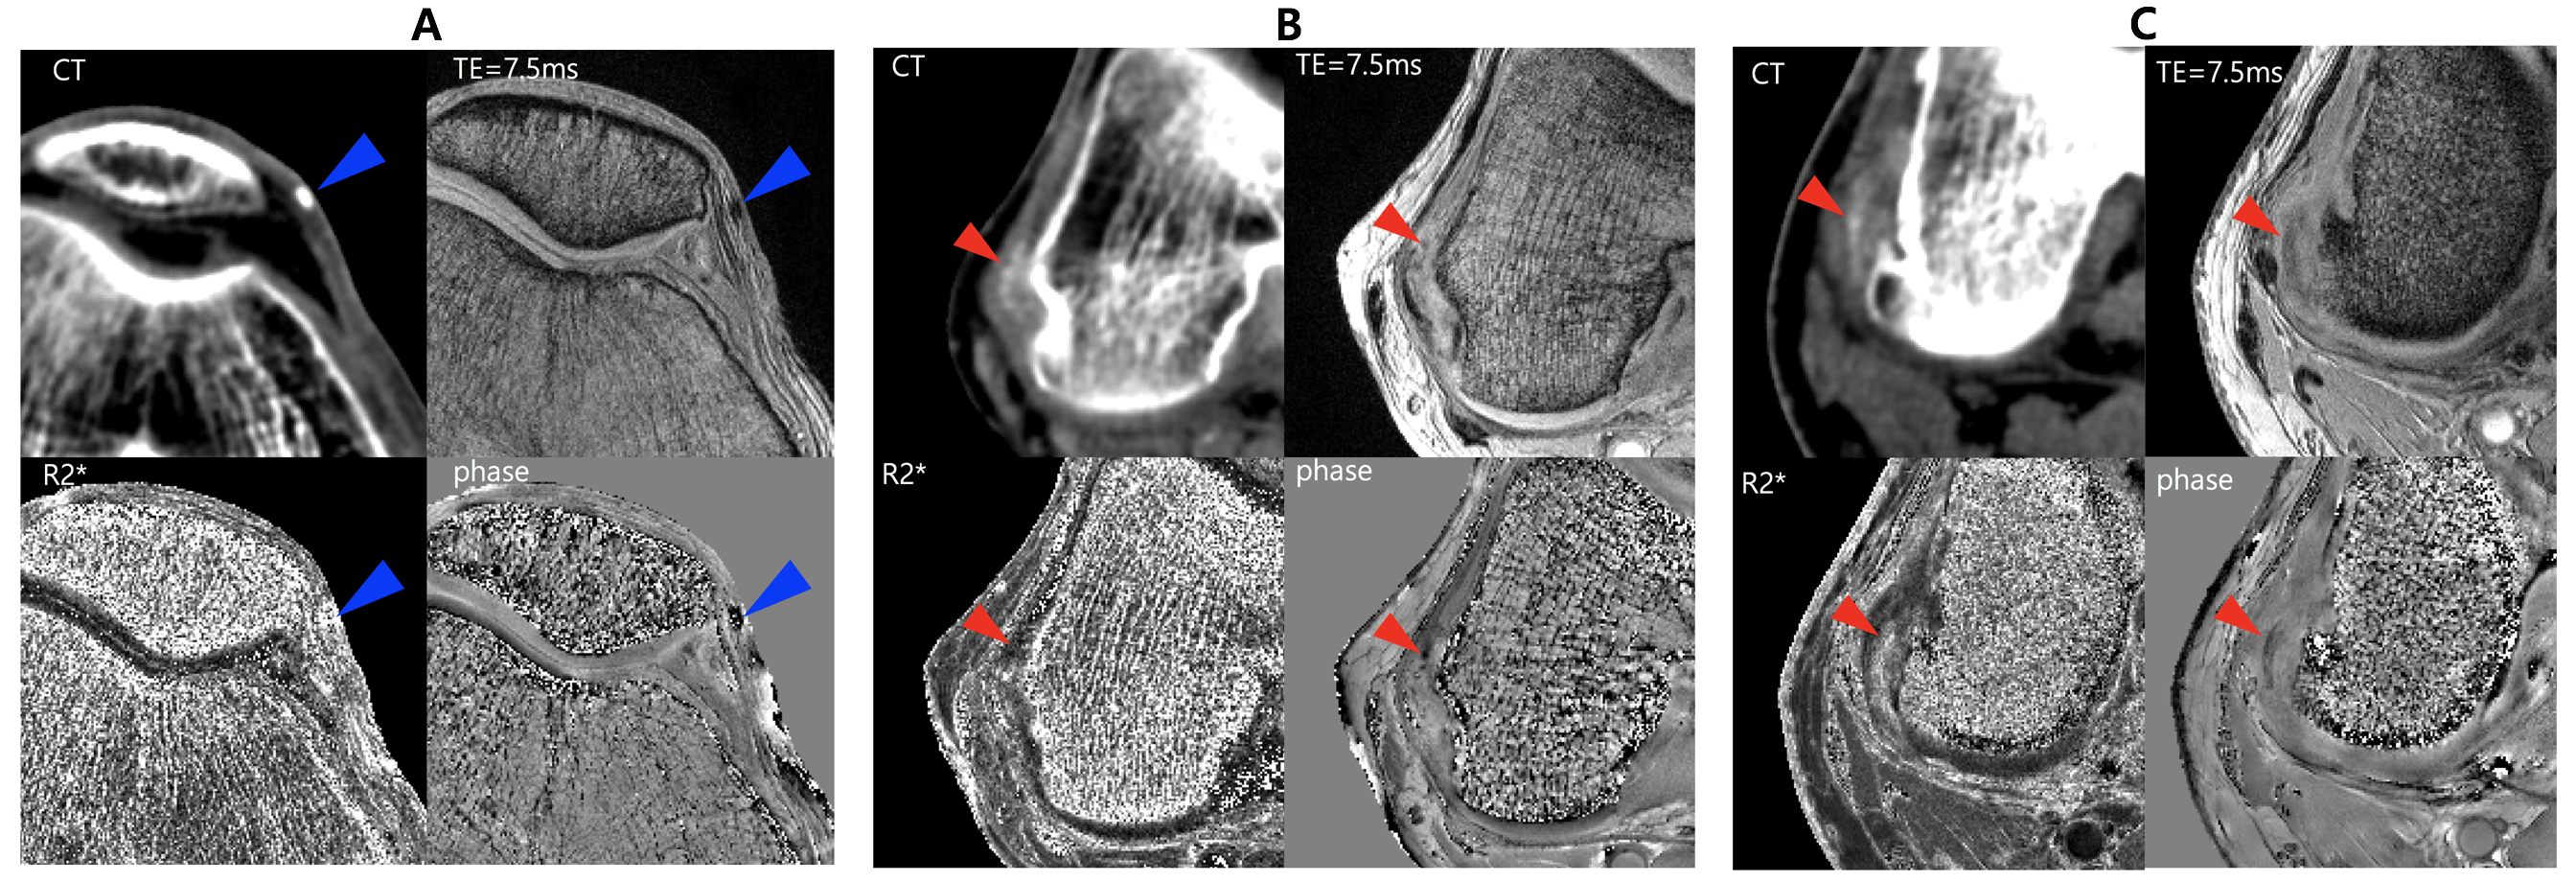
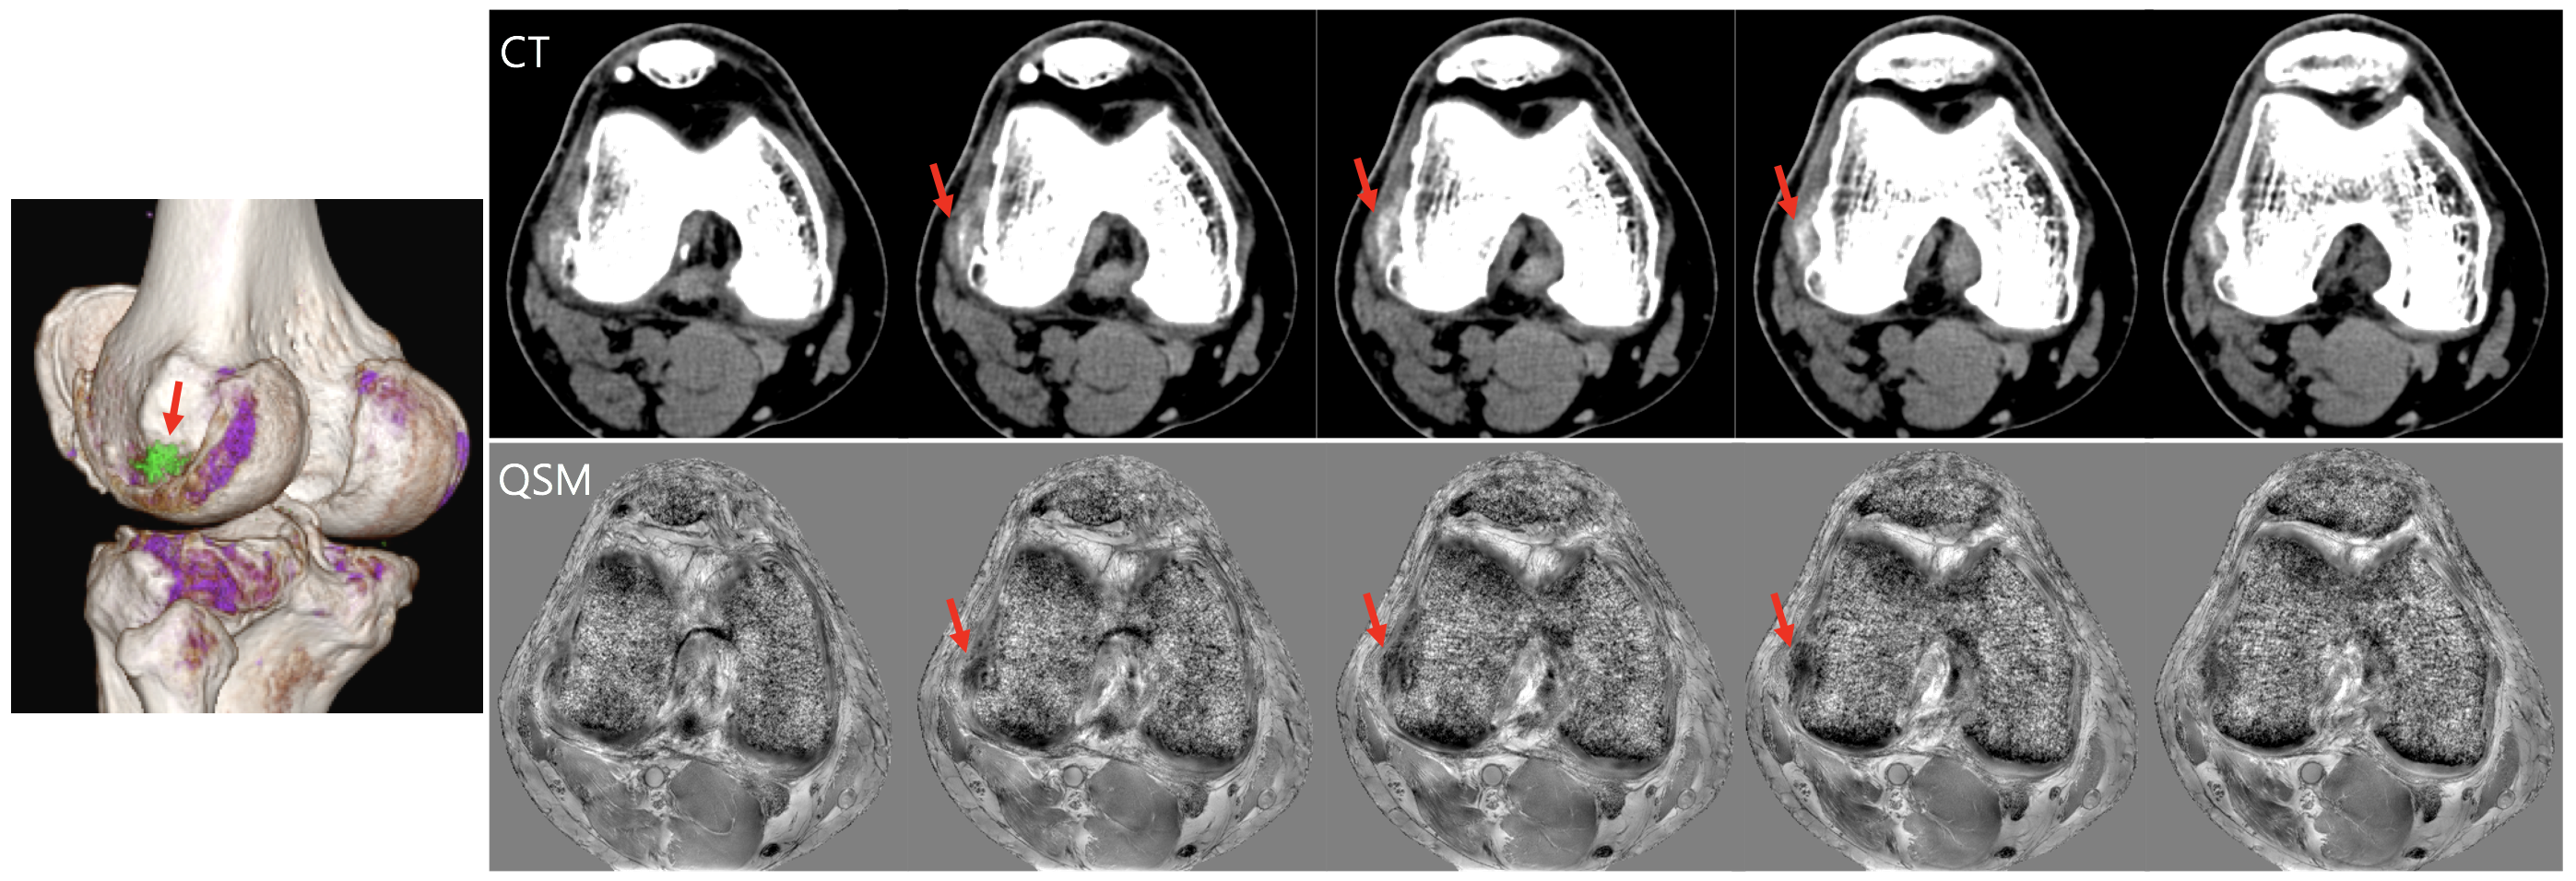
Fig.1 shows the representative images and quantitative maps of the phantom experiments. The changes of T1w and R2* of MSU according to concentrations were relatively small compared to those of calcium (Fig.2A and B). On the other hand, both materials showed high sensitivity in susceptibility values (Fig.2C). The ratio of R2* and susceptibility clearly showed the difference between MSU and calcium except for 300 mmol/L of calcium (Fig.2D). This exception was probably due to incorrectly removed background phase. In the patient images, both calcification (Fig.3A) and MSU regions (Fig.3B and C) were well described in the obtained images, particularly in the phase. Figure 4 shows that the MSU regions confirmed by DECT (green color in render image) can be obviously detectable in the susceptibility maps.Discussion
We demonstrated the potential of mGRE based quantitative imaging for assessment of MSU. The phantom experiment results showed the possibility of distinguishing between MSU and calcium by combining susceptibility and relaxation characteristics. For future work, protocol optimization for in vivo MSU imaging will be needed because the environment surrounding the material is different from that in the phantom used in this study.Acknowledgements
No acknowledgement found.References
1. Chowalloor PV, Siew TK, Keen HI. Imaging in gout: A review of the recent developments. Ther Adv Musculoskelet Dis 2014;6:131–143.
2. Diekhoff T, Kiefer T, Stroux A, et al. Detection and characterization of crystal suspensions using single-source dual-energy computed tomography: a phantom model of crystal arthropathies. Investigative Radiology 2015;50:255–260.
3. Haacke EM, Liu S, Buch S, Zheng W, Wu D, Ye Y. Quantitative susceptibility mapping: current status and future directions. Magnetic Resonance Imaging 2015;33:1–25.
4. Wang Y, Liu T. Quantitative susceptibility mapping (QSM): Decoding MRI data for a tissue magnetic biomarker. Magnetic Resonance in Medicine 2014;73:82–101.
Figures