1431
Ultra-short echo-time (UTE) imaging of the knee with curved surface reconstruction-based extraction of the patellar tendon1Medical Physics Group, Institute of Diagnostic and Interventional Radiology, Jena University Hospital - Friedrich Schiller University Jena, Jena, Germany, 2Zuse Institute Berlin, Berlin, Germany, 3Julius Wolff Institute and Center for Musculoskeletal Surgery, Charité – Universitätsmedizin Berlin, Berlin, Germany, 4Michael Stifel Center for Data-driven and Simulation Science Jena, Friedrich Schiller University Jena, Jena, Germany, 5Abbe School of Photonics, Friedrich Schiller University Jena, Jena, Germany, 6Center of Medical Optics and Photonics, Friedrich Schiller University Jena, Jena, Germany
Synopsis
Due to very short T2 relaxation times, imaging of tendons is typically performed using ultra-short echo-time (UTE) acquisition techniques. In this work, we combined an echo-train shifted multi-echo 3D UTE imaging sequence with a 3D curved surface reconstruction to virtually extract the patellar tendon from an acquired 3D UTE dataset. Based on the analysis of the acquired multi-echo data, a T2* relaxation time parameter map was calculated and interpolated to the curved surface of the patellar tendon.
Purpose
Materials and Methods
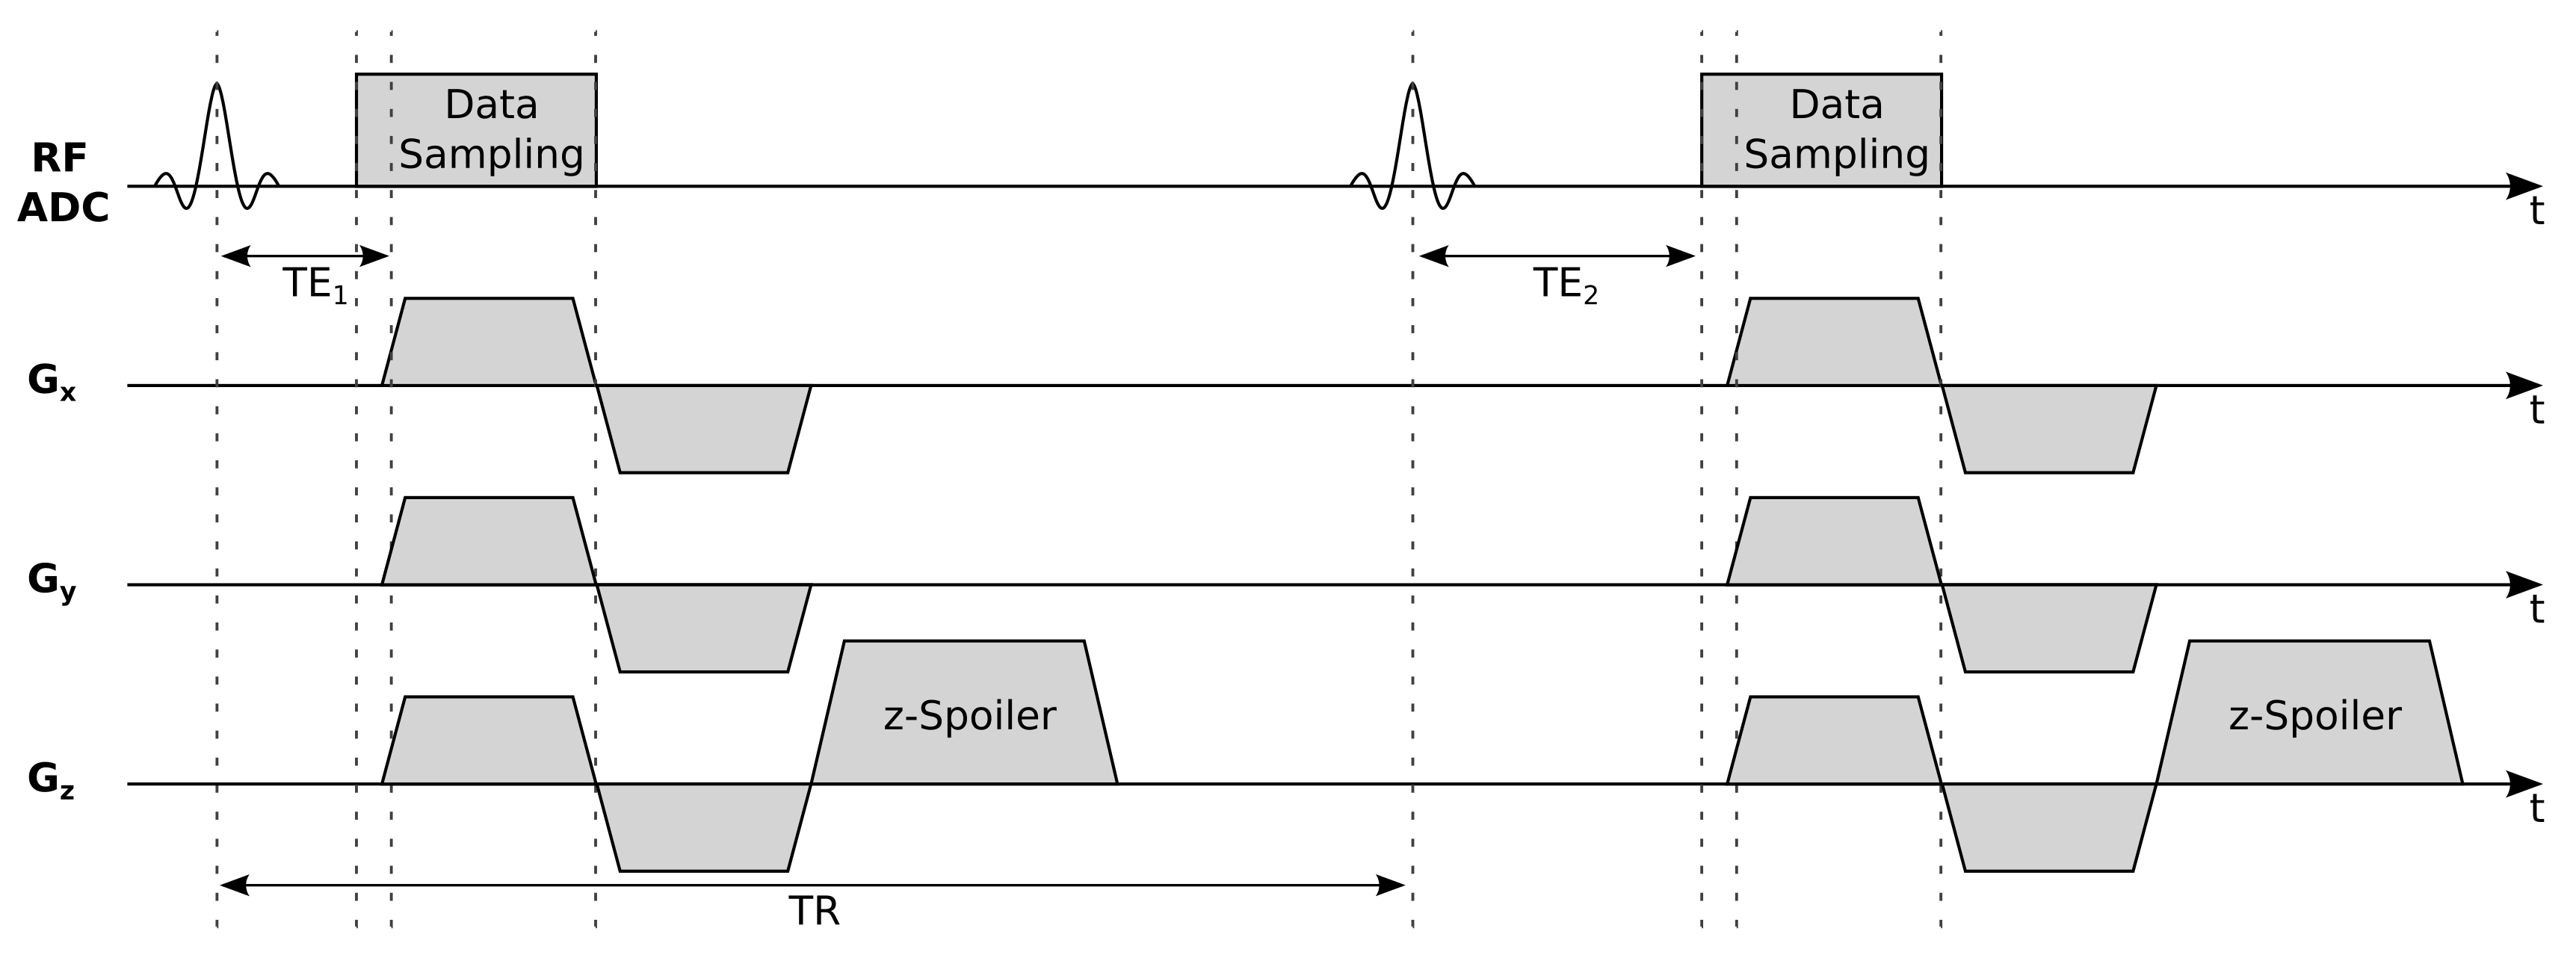
Imaging of the knee was performed using a 3D center-out radial UTE imaging sequence that acquired three different echoes using the echo-train shifting technique. With this method, only one echo is acquired per repetition time (TR), with the echo time (TE) being shifted for subsequent echoes. The advantage of echo-train shifting is that shorter echo spacing can be achieved and all echoes can be acquired with the exact same gradient history, reducing eddy current artifacts in subtraction images. All echoes were acquired in an interleaved mode to ensure that subject or physiological motion affected the echo images in the same way. To further reduce possible artifacts, the sequence used constant z-spoiling between repetitions, and a short delay of 20 µs between start of the ADC and the ramp-up of the readout gradients. A complete scheme of the imaging sequence is shown in Figure 1. Imaging parameters were as follows: 0.07 ms, 0.60 ms and 2.47 ms TE, 4.7 ms TR, 16 min TA, 8° flip angle, 982 Hz/Pixel bandwidth and a 192 x 192 x 192 acquisition matrix size with a (160 x 160 x 160) mm³ field of view, resulting in an isotropic spatial resolution of (0.83 x 0.83 x 0.83) mm3. A fat saturation pulse was interleaved with the data acquisition every 140 ms. Imaging experiments were performed on 3T clinical Siemens MRI Scanner using an 8-channel NORAS Variety coil.
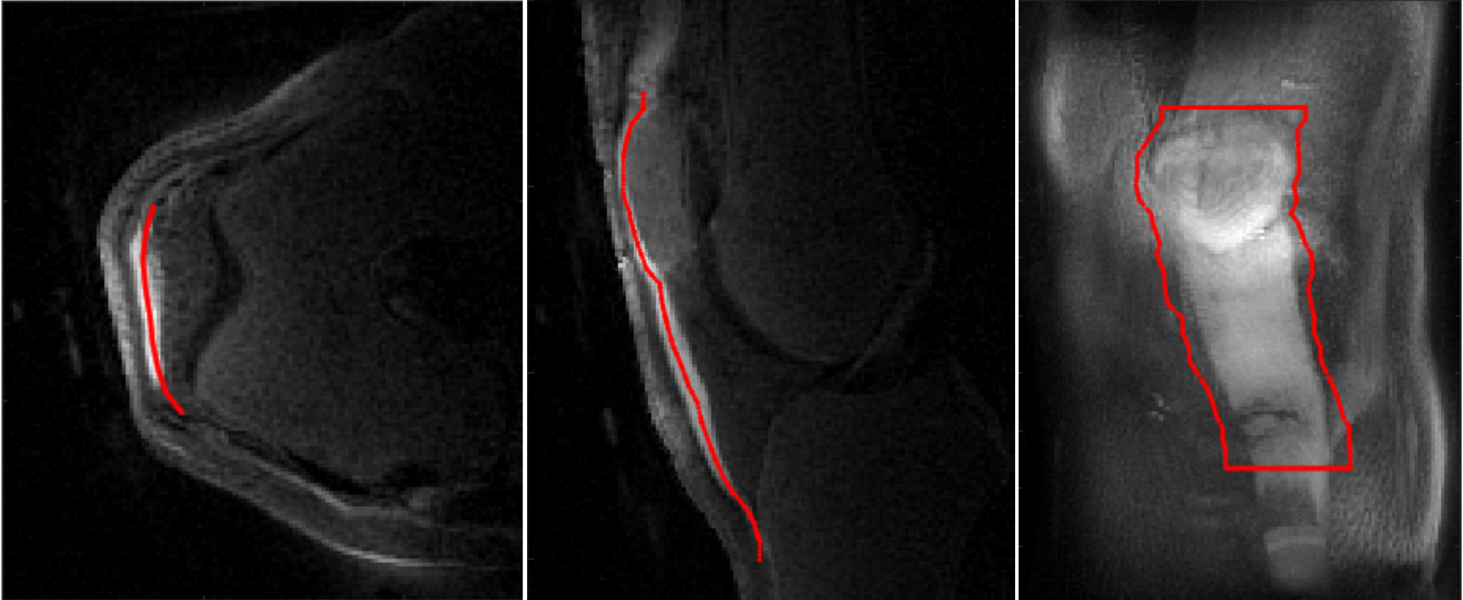
To better visualize the patellar tendon, difference images were computed from the first and last echoes. Based on these difference images, polygon lines through the center of the patellar tendon were drawn for multiple slices in transverse view of the reconstructed data. To extract a virtual curved 3D surface that contains the entire patellar tendon, coordinates between the manually-drawn lines were interpolated. An exemplary view of the resulting curved surface is given in Figure 2.
Besides computing the difference images, a mono-exponential T2* fit of the patellar tendon data was performed based on the three acquired echoes to create a T2* relaxation time parameter map.
Results
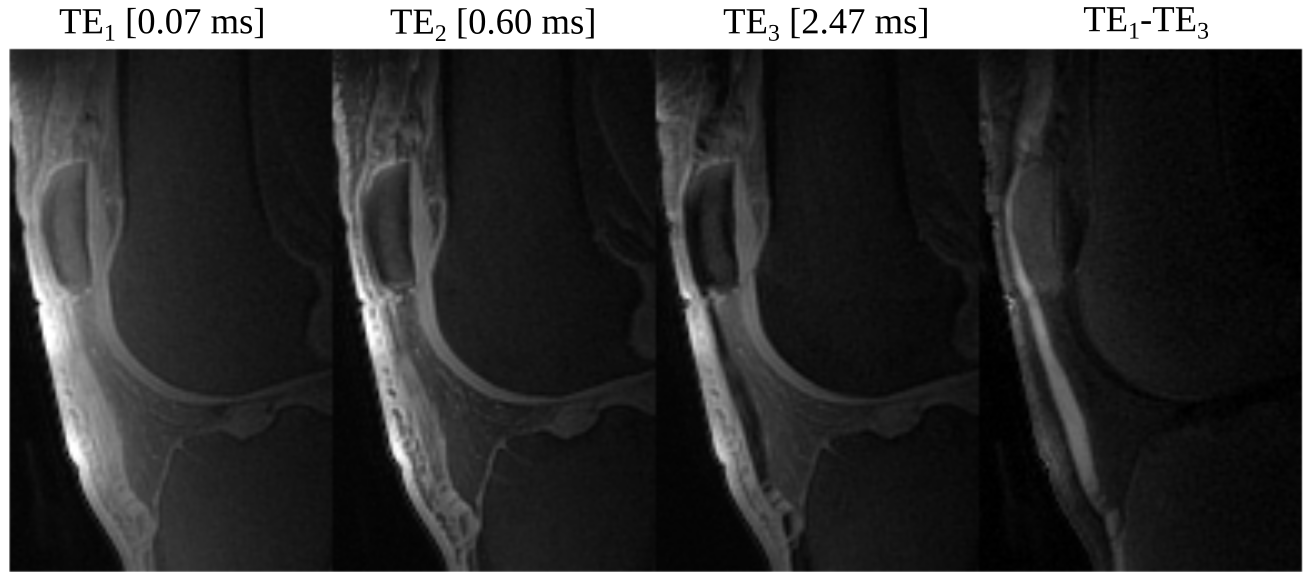
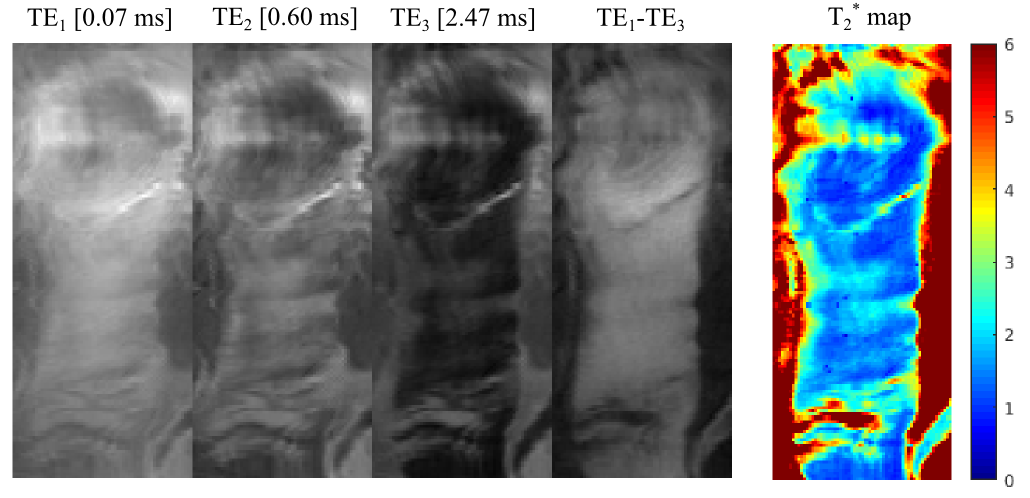
The multi echo images of the patellar tendon showed fast signal decay within the tendon area and a very distinct and artifact-free signal of the tendon in the difference image between the first and the last echo time (Figure 3). Based on the latter, the tendon could be easily differentiated from all other surrounding tissues and structures. Extracting the entire patellar tendon using the curved surface reconstruction showed again a clear tendon signal in the difference images (Figure 4). Surprisingly, the single echo images revealed some structure within the tendon. The calculated relaxation time parameter map showed an inhomogeneous distribution of T2* values within the tendon of 1.49 +/- 0.35 ms.Discussion and Conclusion
Virtually extracting the entire patellar tendon revealed an inhomogeneous distribution of T2* values which is in line with literature findings that reported varying values of 0.56 ms1 and 1.5 ms2 extracted from regions of interests in sagittal slices. Our results suggest that when only using a sagittal slice for T2* estimation, one has to select very carefully that slice to avoid untrustworthy results caused by the inhomogeneous distribution of T2* values within the tendon. The cause of the inhomogeneous T2* distribution and the visible structure in the single echo images may be due to the relaxed state of the knee and tendon during the measurement. In future experiments, it may be thus of interest to investigate T2* distributions in the tendon when the knee is under stress and the tendon is stretchedAcknowledgements
No acknowledgement found.References
- Ma YJ, Zhu Y, Lu X, Carl M, Chang EY, Du J. Short T2 imaging using a 3D double adiabatic inversion recovery prepared ultrashort echo time cones (3D DIR-UTE-Cones) sequence. Magn Reson Med. 2017; Sep 14; epub ahead of print
- Kijowski R, Wilson JJ, Liu F. Bicomponent ultrashort echo time T2* analysis for assessment of patients with patellar tendinopathy. J Magn Reson Imaging. 2017 Nov;46(5):1441-1447
- Herrmann KH, Krämer M, Reichenbach JR. Time Efficient 3D Radial UTE Sampling with Fully Automatic Delay Compensation on a Clinical 3T MR Scanner. PLoS One. 2016 Mar 14;11(3):e0150371
Figures