1430
Advanced Knee Imaging Study in NCAA Division 1 Basketball: Protocol Development and Preliminary Results1Radiology, Stanford, Stanford, CA, United States, 2GE Healthcare, Waukesha, WI, United States, 3Hospital of Special Surgeries, New York City, NY, United States, 4University of California San Francisco, San Francisco, CA, United States, 5Stanford, Redwood City, CA, United States, 6Radiology, Mayo Clinic, Rochester, MN, United States
Synopsis
Chronic knee injuries are especially common in jumping athletes, and in particular high-level basketball players. In this work, we developed an advanced quantitative MRI protocol to longitudinally study early degenerative changes in high-level basketball players across multiple sites. Studying these changes, between high and low impact athletes, within one season as well as over three seasons for a cumulative effect, will help provide better insight into these changes. In developing this protocol for a multi-center study, we use a common phantom to assess biases in quantitative measurements across study scanners.
INTRODUCTION
Chronic knee injuries are especially common in jumping athletes, and in particular high level basketball players, who place high loads on their knee joints1,2. While conventional MRI has shown structural degeneration in joint tissues at late stages of the osteoarthritis3,4, our understanding of the progression of early degenerative changes in cartilage and meniscus in basketball players remains limited. Advanced quantitative MRI methods offer a way to non-invasively study early changes in soft tissue microstructure. In this multi-site study, we will incorporate multiple advanced quantitative MRI metrics of cartilage and meniscus microstructure to longitudinally study early degenerative changes in high-level basketball players. High level swimmers are being recruited as an athletic comparison group that has lower impact activity. We also use a common phantom to assess biases in quantitative measurements across study scanners.METHODS
This study is taking place on five different 3T MRI scanners (GE Premier, MR750(3), MR750w) at three different sites across the US using either an 8-channel (Invivo, Gainsville,Fl) or 18-channel (Quality Electrodynamics, Mayfield Village,Oh) transmit/receive knee coil.
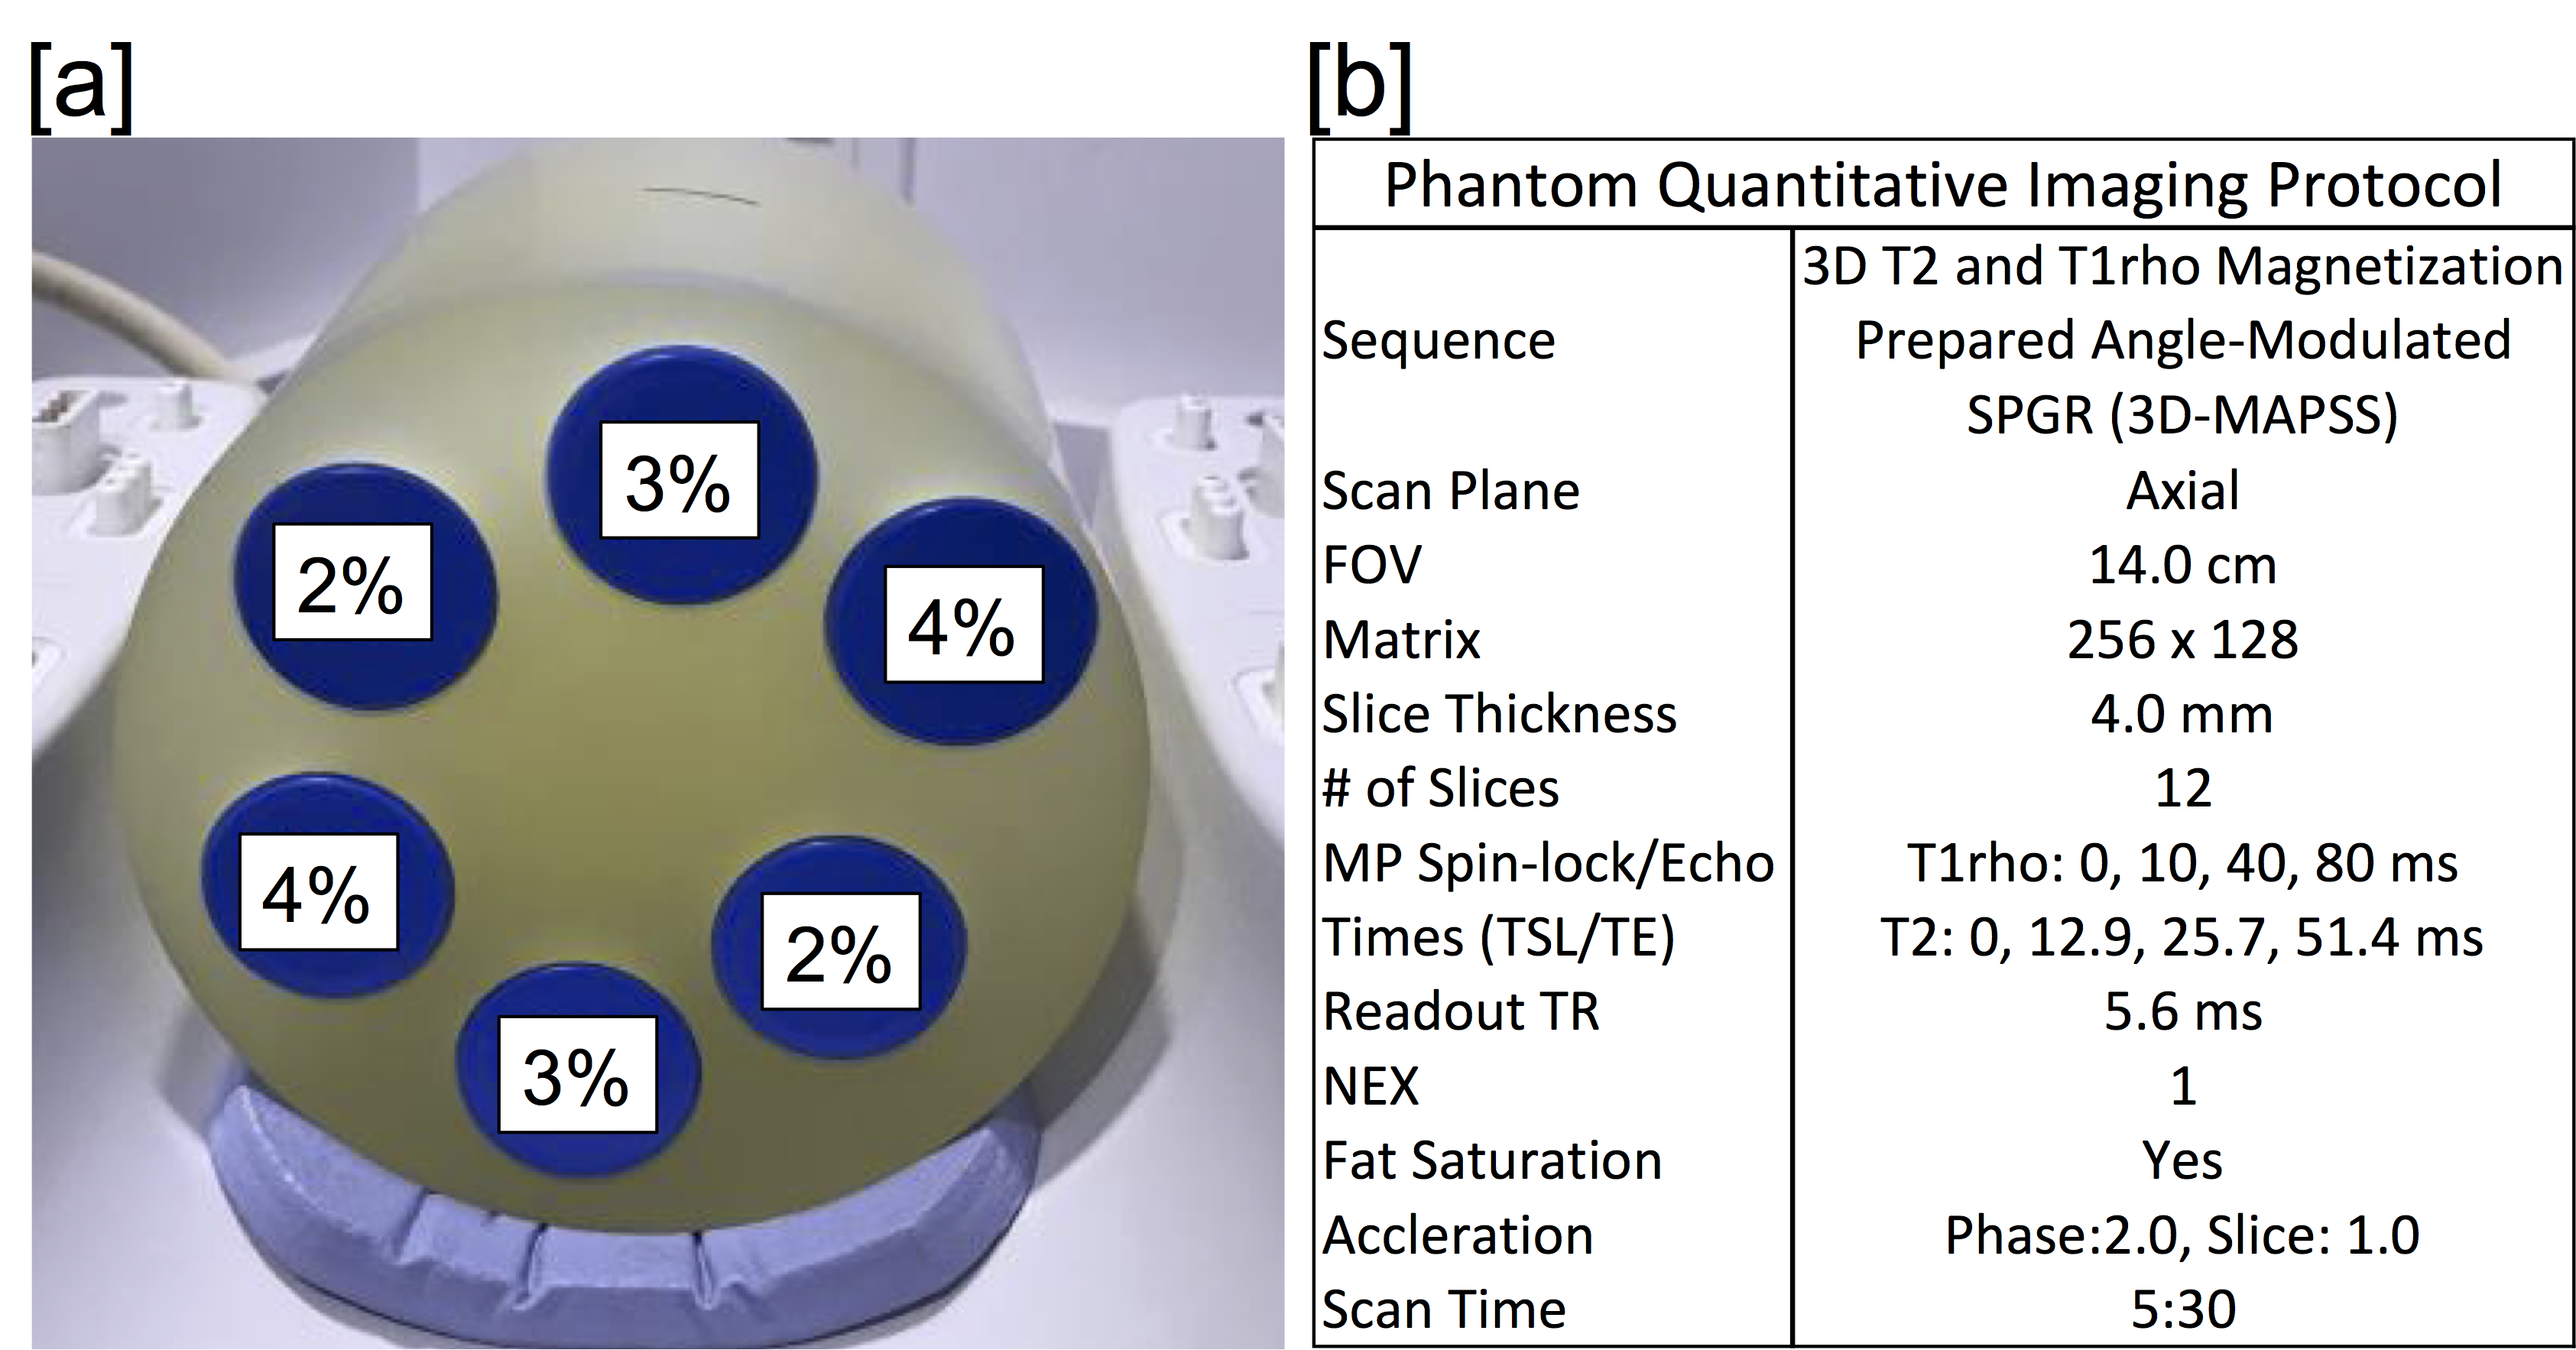
Phantom Study: To evaluate any differences in quantitative metrics across scanners, an identical phantom was imaged on all the participating scanners. Additionally, scanning was repeated 3 times on a single scanner to evaluate intra-scanner variability. The phantom consisted of falcon tubes with various amounts of agarose to vary relaxation times (Figure 1). Imaging was performed with a 3D T2 and T1ρ prepared SPGR sequence5. T2/T1ρ relaxation time maps were computed using a mono-exponential fit of signal data acquired at various echo/spin-lock (TE/TSL) times. Inter-scanner and intra-scanner reproducibility of T2/T1ρ measurements for each phantom solution was assessed with coefficients of variation(CV).
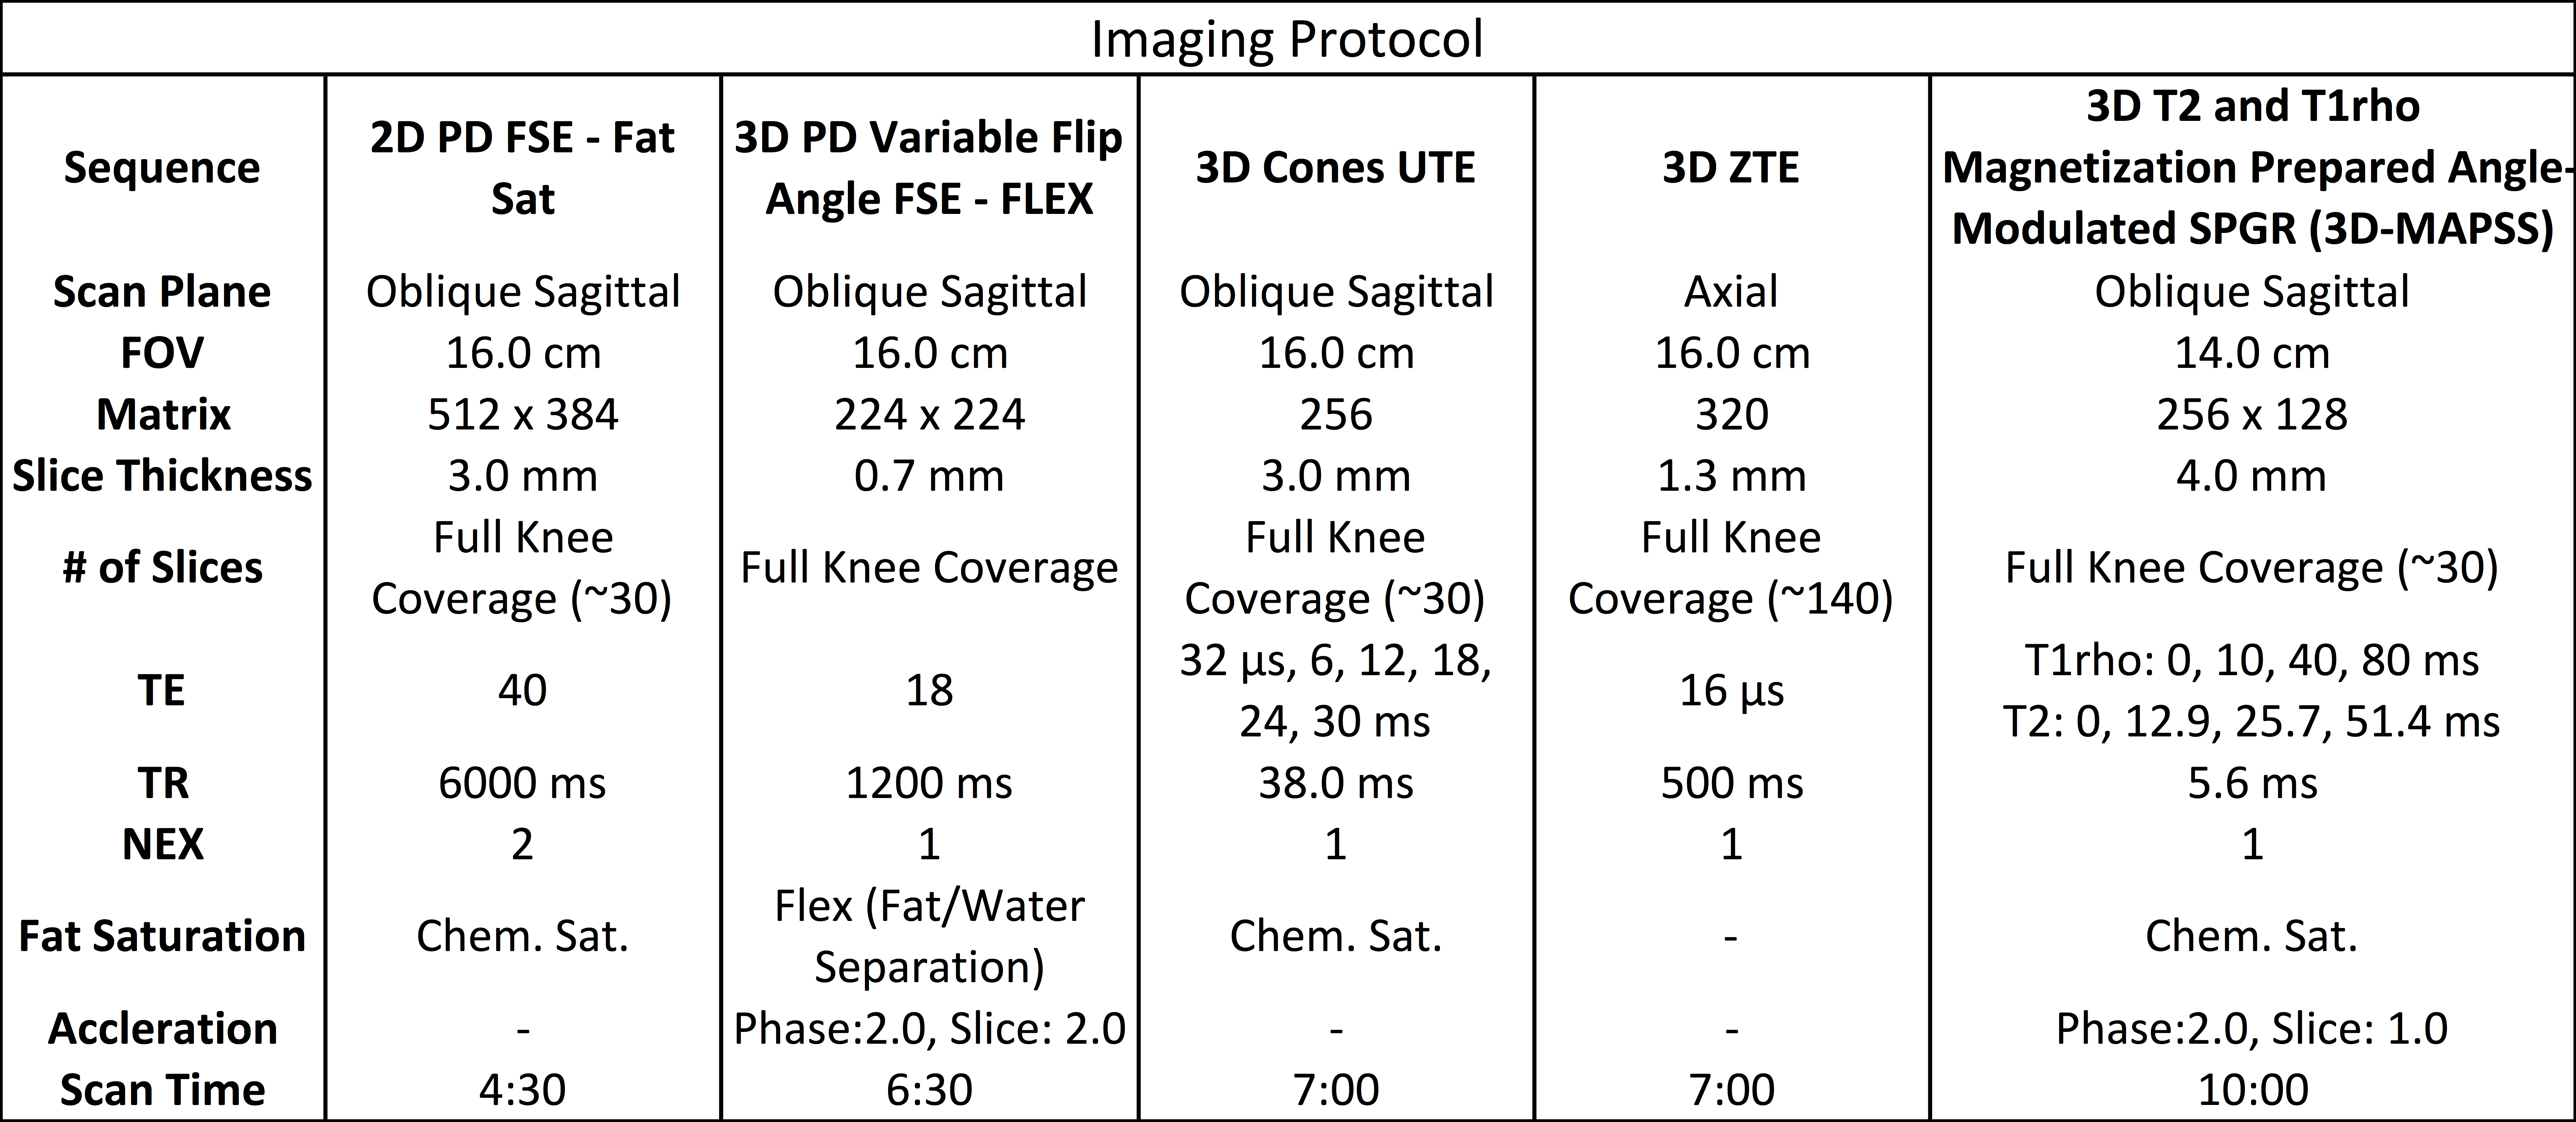
Imaging Study: In total, 40 basketball players and 20 swimmers (Comparison Group) who are all Freshmen or Sophomores at the beginning of the study, will be recruited. The Study Population will be recruited from five NCAA basketball and swim teams and an equal number of men and women will be enlisted. Each participant will be scanned once a year for three years. The imaging protocol is shown in Table 1 and will consist of a combination of morphologic and quantitative sequences to visualize and objectively study all joint tissues. To date, 31 basketball players have been scanned at the first time point. We are also recording training intensity data, as measured by cumulative court time and Session Rate of Performance Exertion(sRPE)6,7, as well as clinical history and self-reported condition of the knee through the Knee injury and Osteoarthritis Outcome Score(KOOS).
RESULTS
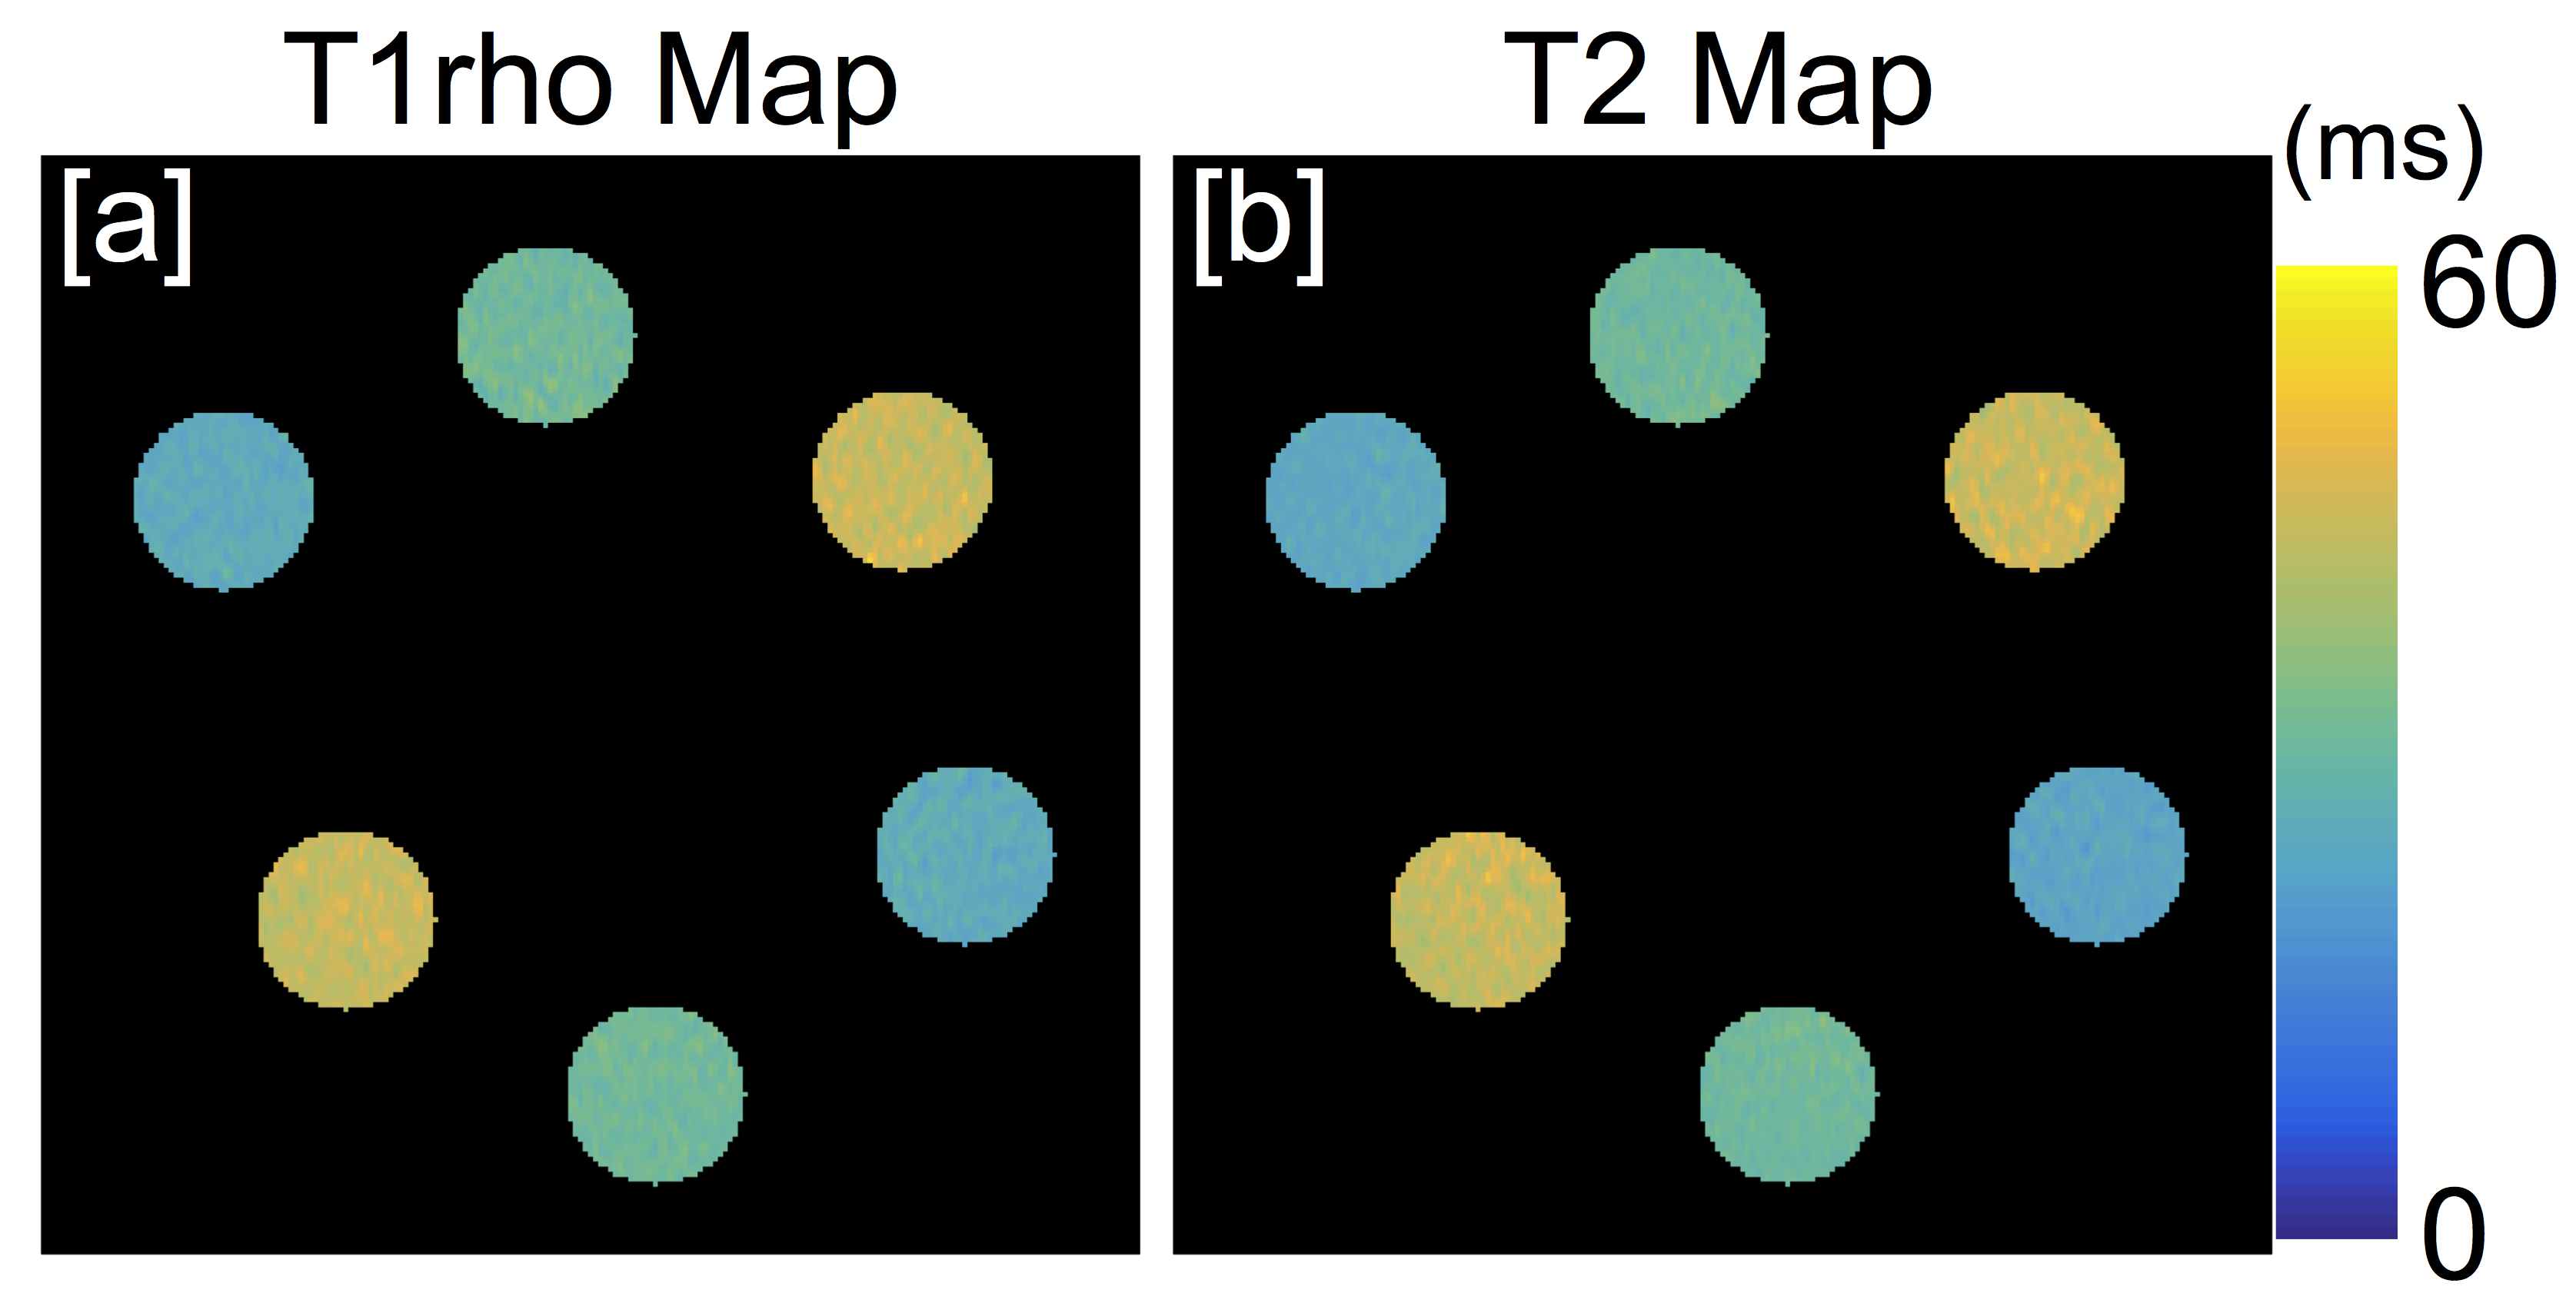
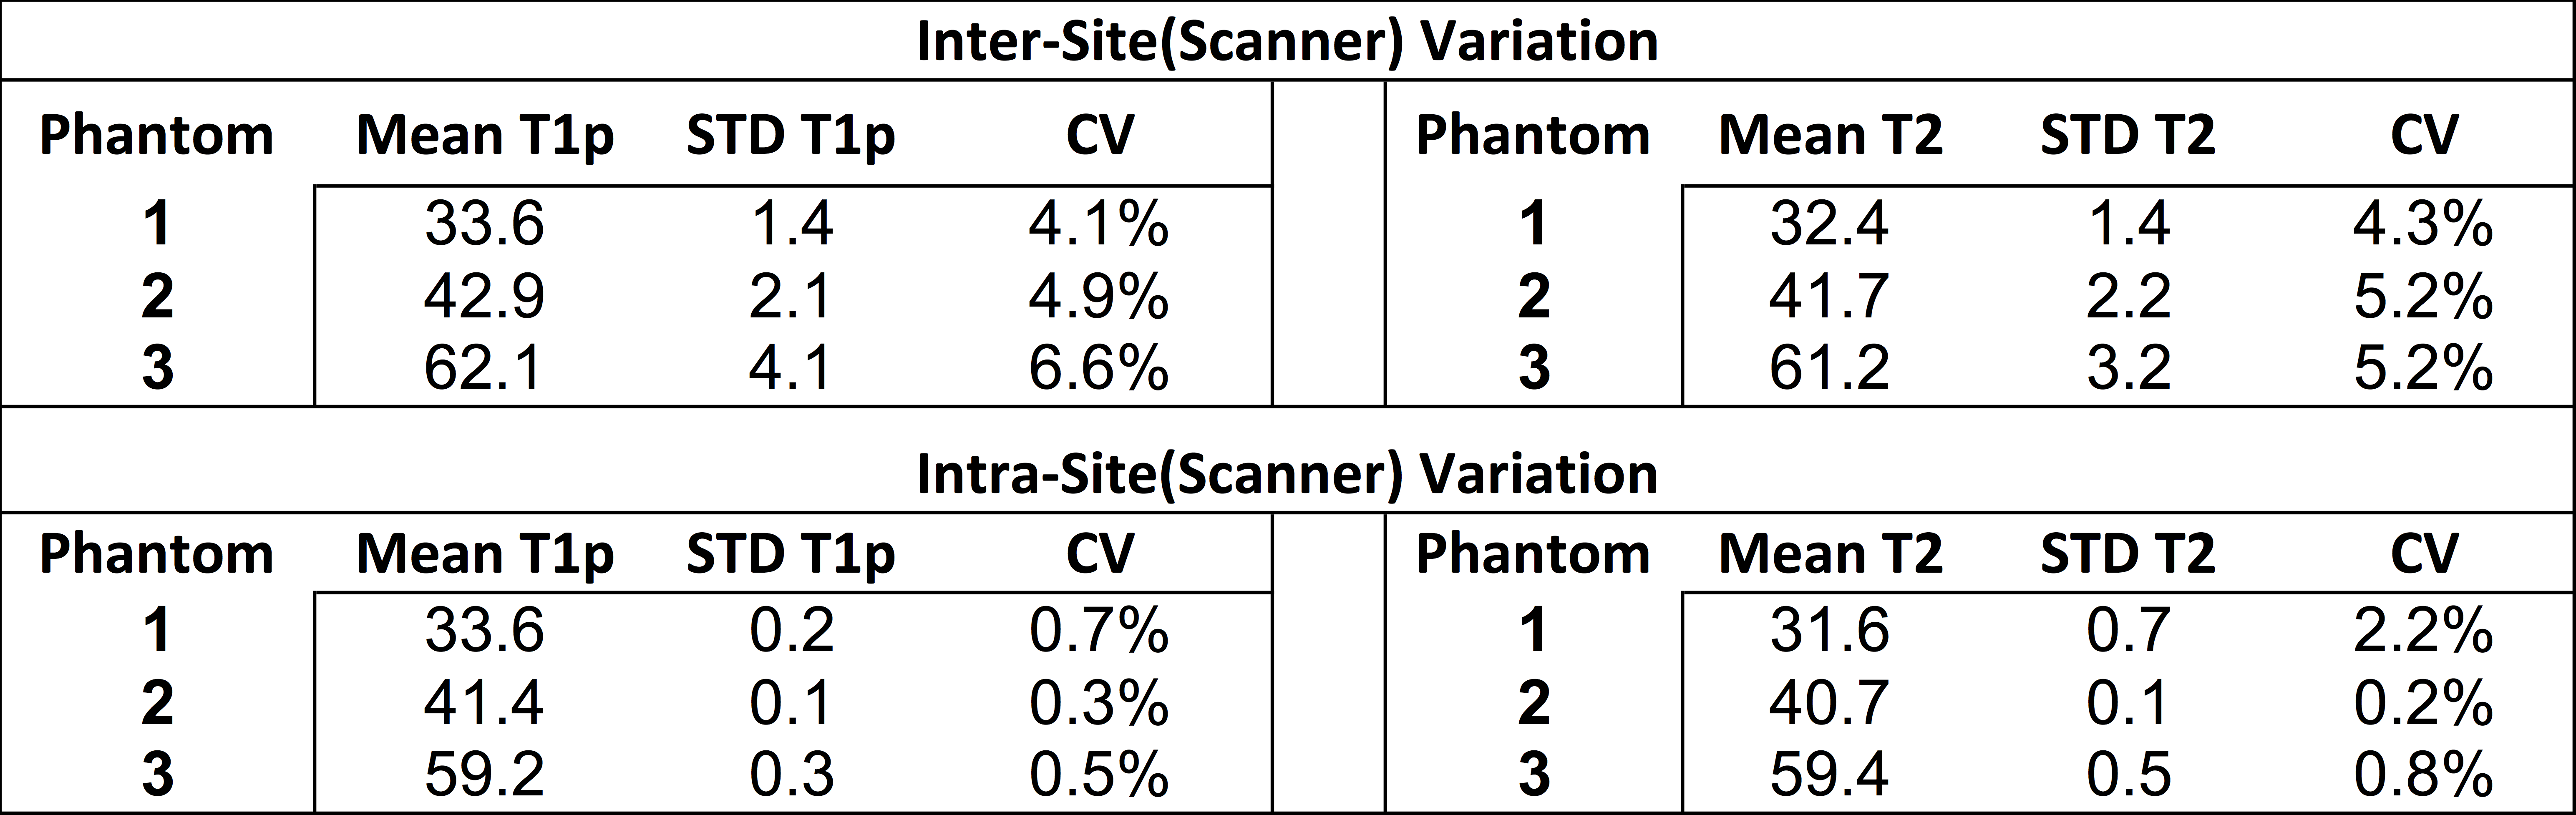
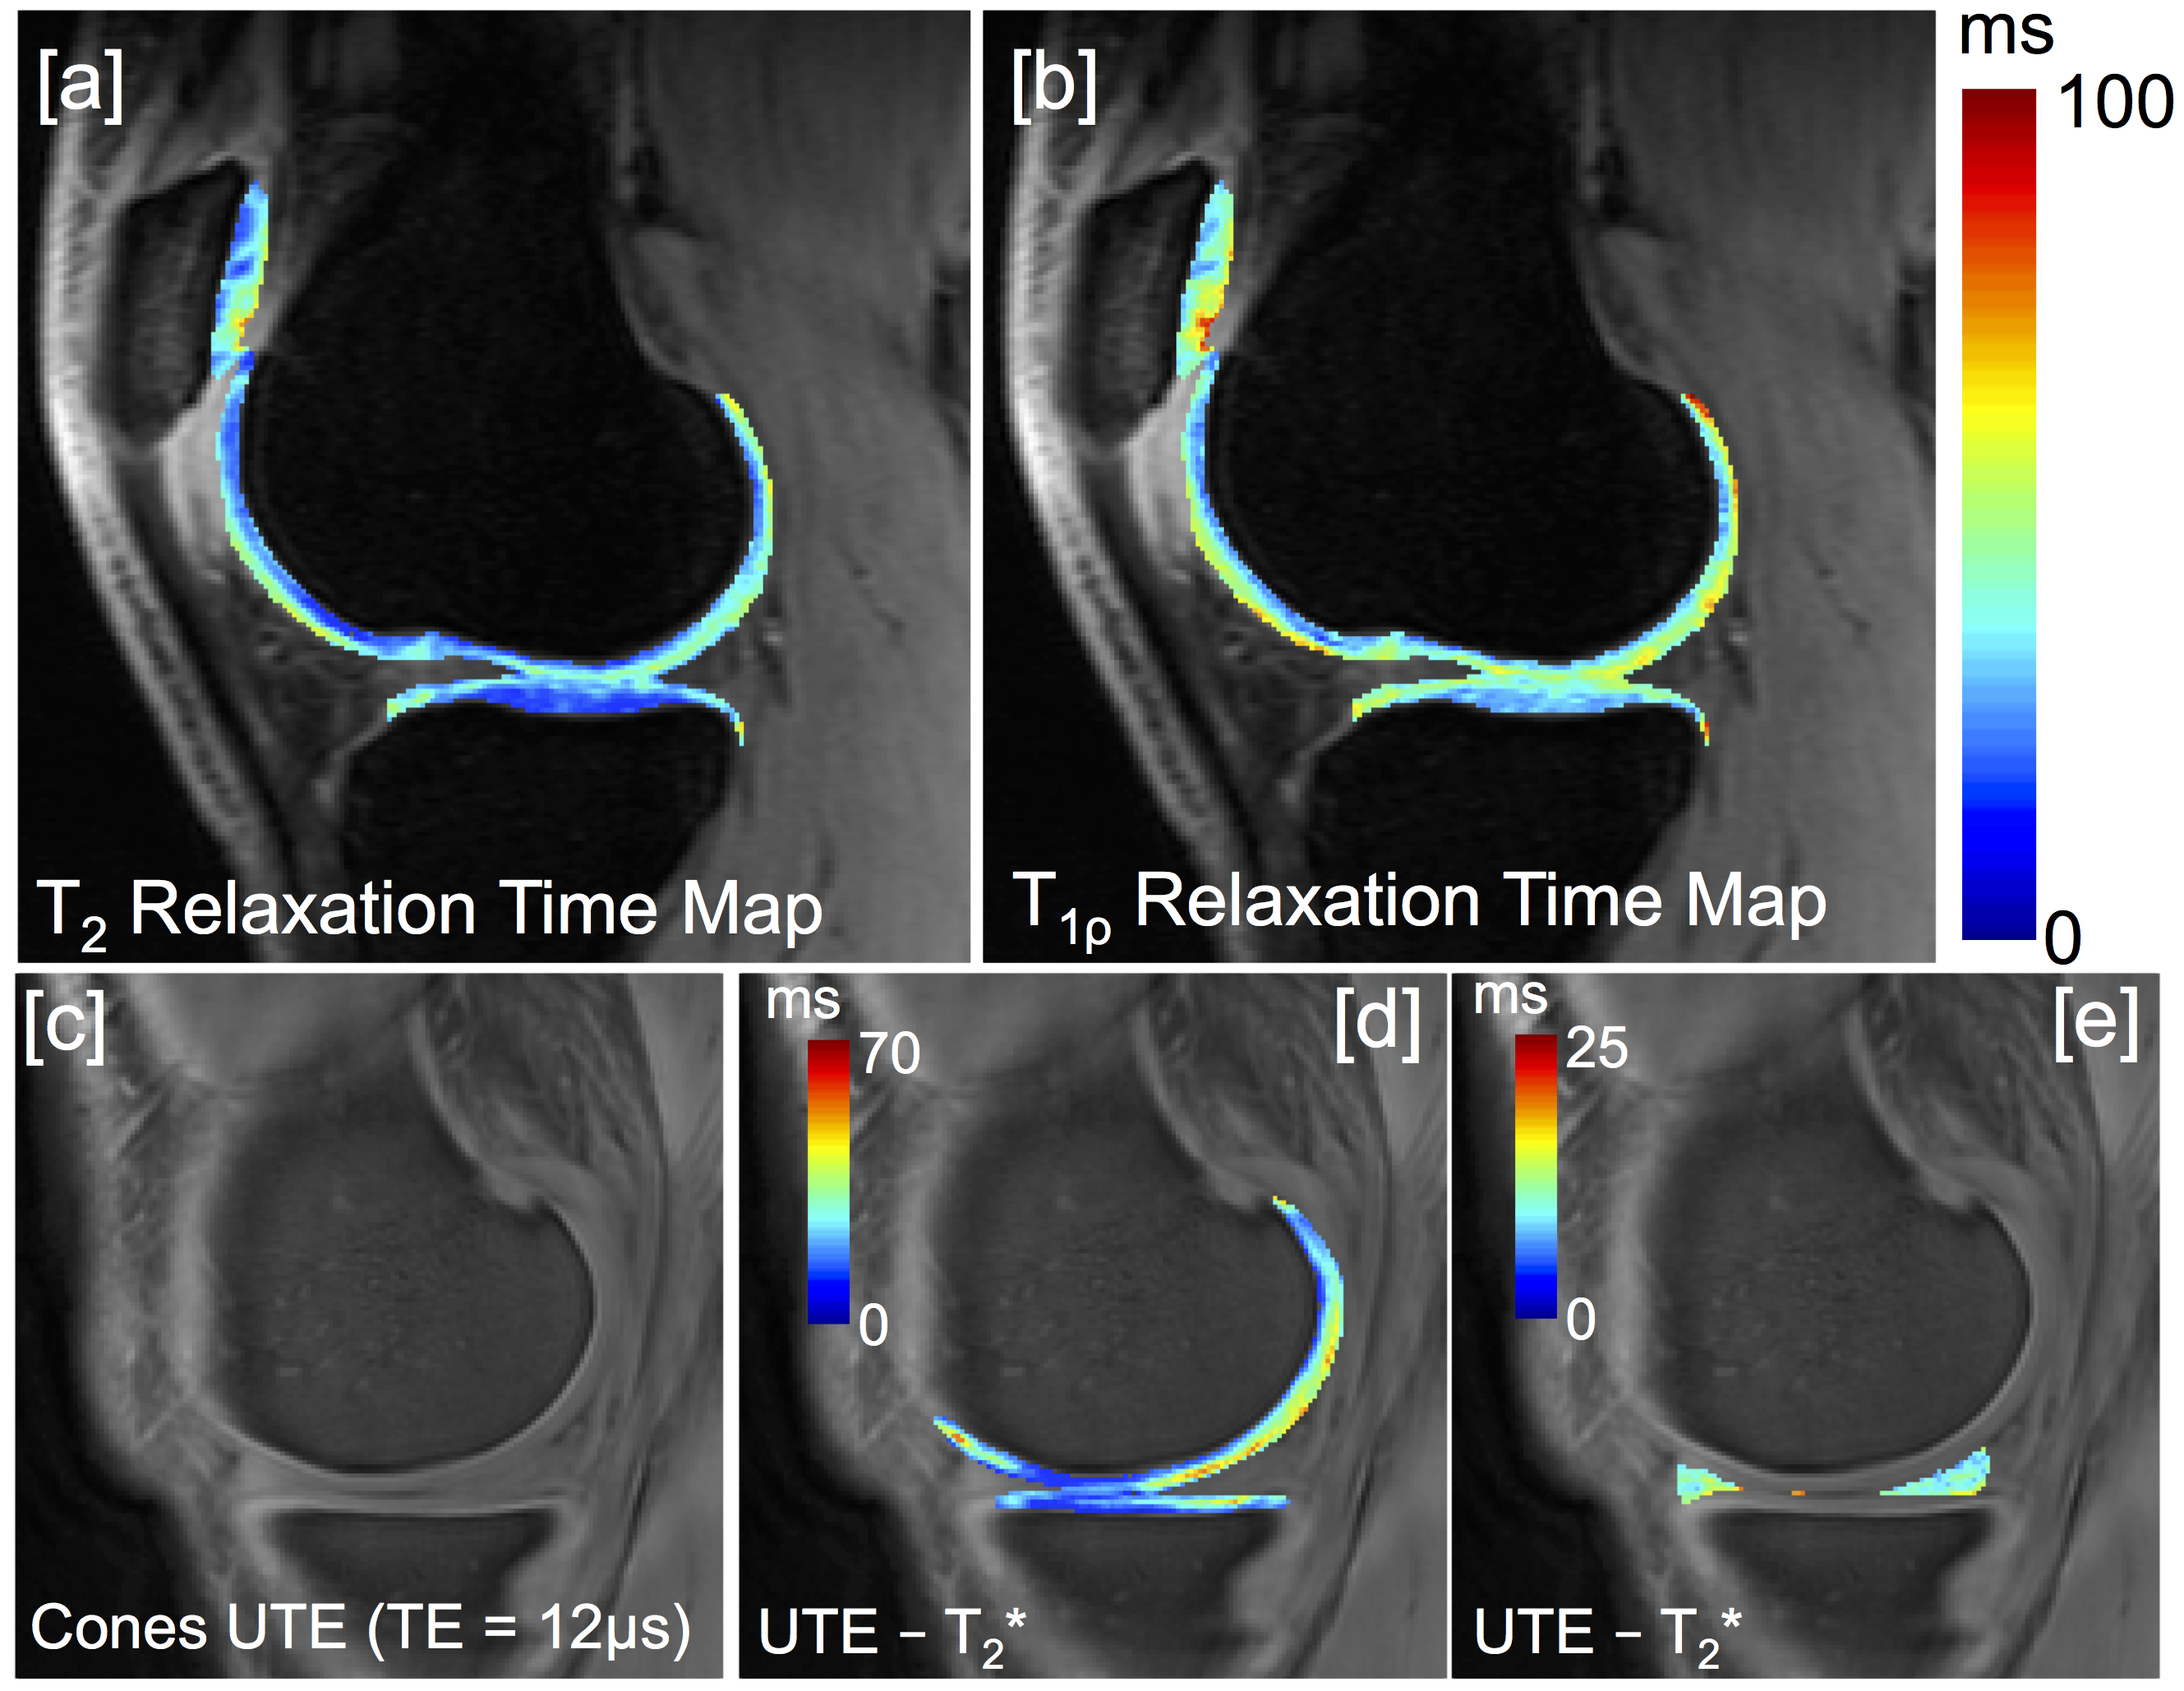
Figure 2 shows representative T2 and T1ρ relaxation time maps of the phantom at one site. Table 2 shows the mean and standard deviation of phantom T2/T1ρ relaxation times and repeatability across 5 different scanners as well as within one scanner. Intra-scanner repeatability was high with CV’s ranging from 0.2%-2.2% (Table 2). Inter-scanner T2 and T1ρ measurements were less consistent with CV’s ranging form 4.1%-6.6%. Figure 3 shows the various quantitative MRI measures that are acquired in this study for one subject. These include T2, T1ρ, and UTE-T2* of cartilage (Figure 3a,b,d) as well as UTE-T2* maps of short T2 tissues such as meniscus, tendons and ligaments(Figure 3e).DISCUSSION
Phantom data shows the challenges in quantitative measurements in a multi-site study. The low intra-scanner CVs observed suggests high repeatability of quantitative measurements within one site. This is critical as changes in these quantitative measurements over time is our most important metric of disease status. As expected, reproducibility across different scanners was less consistent. This is likely due to differences in scanner geometry, RF coils and slight variations in sequence parameters, which affect image SNR, and ultimately quantitative measurements. Measurement of quantitative values in a common phantom at each scanner at each study time point will allow us to understand and potentially correct for quantitative biases both longitudinally within one scanner as well as cross-sectionally across scanners/sites.CONCLUSION
Early data from the initial time point shows the wealth of quantitative information that is being collected across all joint tissues in this study. Studying these changes, between high and low impact athletes, within one season as well as over three seasons for a cumulative effect, as well as correlating imaging findings with training intensity data, will help provide better insight into the ability of cartilage to restore to homeostasis, or whether the changes are irreversible. Further, understanding the rate of degeneration and cumulative effects of a season, or even the timing and ability of recovery, are critical to keeping players safe and healthy and possibly learning how to prevent arthritis in the general population.Acknowledgements
Acknowledgments: This work was funded by GE Healthcare and National Basketball Association (NBA).References
1. Brunner MC, Flower SP, Evancho AM, Allman FL, Apple DF, Fajman WA. MRI of the athletic knee. Findings in asymptomatic professional basketball and collegiate basketball players. Invest Radiol 1989; 24:72-75.
2. Major NM, Helms CA. MR Imaging of the knee: findings in asymptomatic collegiate basketball players. AJR Am J Roentgenol 2002; 179:641-644.
3. Pappas GP, Vogelsong MA, Staroswiecki E, Gold GE, Safran MR. Magnetic Resonance Imaging of Asymptomatic Knees in Collegiate Basketball Players: The Effect of One Season of Play. Clin J Sport Med 2016; 26:483-489.
4. Vogelsong MA, Pappas GP, Staroswiecki E, Bangerter NK, Han E, Hargreaves BA, Braun HJ, Safran MR, Gold GE. Are Sports Good for Your Knees? An MRI Evaluation of the Effects of Basketball on Knee Health in Division 1 Collegiate Athletes. In:International Society for Magnetic Resonance in Medicine. Toronto, 2011; 507.
5. Li, X., Han, E. T., Busse, R. F. and Majumdar, S. (2008), In vivo T1ρ mapping in cartilage using 3D magnetization-prepared angle-modulated partitioned k-space spoiled gradient echo snapshots (3D MAPSS). Magnetic Resonance in Medicine 2008., 59: 298–307
6. Turner A, Bishop C, Marshall G, Read P. How to Monitor Training Load and Mode using sRPE. Professional Strength and Conditioning, 2015; 39:15-19.
7. Clark N, Farthing JP, Norris SR, Arnold BE, Lanovaz JL. Quantification of Training Load in Canadian Football: Application of Session-RPE in Collision-based Team Sports. Journal of Strength and Conditioning Research, 2013; 27 (8).
8. Li X, Cheng J, Lin K, Saadat E, Bolbos RI, Jobke B, Ries MD, Horvai A, Link TM, Majumdar S. Quantitative MRI using T1rho and T2 in human osteoarthritic cartilage specimens: correlation with biochemical measurements and histology. Magn Reson Imaging 2011; 29:324-334.
9. Stahl R, Luke A, Li X, Carballido-Gamio J, Ma CB, Majumdar S, Link TM. T1rho, T2 and focal knee cartilage abnormalities in physically active and sedentary healthy subjects versus early OA patients –a 3.0-Tesla MRI study. Eur Radiol 2009; 19:132-143.
10. Li X, Pai A, Blumenkrantz G, Carballido-Gamio J, Link T, Ma B, Ries M, Majumdar S. Spatial distribution and relationship of T1rho and T2 relaxation times in knee cartilage with osteoarthritis. Magn Reson Med 2009; 61:1310-1318.
11. Chang EY, Du J, Iwasaki K, Biswas R, Statum S, He Q, Bae WC, Chung CB. Single- and Bi- component T2 analysis of tendon before and during tensile loading, using UTE sequences. J Magn Reson Imaging 2015; 42:114-120.
12. Clark N, Farthing JP, Norris SR, Arnold BE, Lanovaz JL. Quantification of Training Load in Canadian Football: Application of Session-RPE in Collision-based Team Sports. Journal of Strength and Conditioning Research, 2013; 27 (8).
Figures