1428
T1ρ, T2, and RAFF are Sensitive to Acute Ischemic Injury to the Femoral Head in a Piglet Model of Legg-Calvé-Perthes Disease1Center for Magnetic Resonance Research, University of Minnesota, Minneapolis, MN, United States, 2Radiology, University of Minnesota, Minneapolis, MN, United States, 3Veterinary Population Medicine, University of Minnesota, Saint Paul, MN, United States, 4Texas Scottish Rite Hospital for Children, Dallas, TX, United States, 5Orthopaedic Surgery, UT Southwestern Medical Center, Dallas, TX, United States
Synopsis
We demonstrate that quantitative T1ρ, T2, and RAFF relaxation time maps are highly sensitive to bone/marrow and cartilage changes within 48 hours following ischemic injury to the growing femoral head. This work has important implications for the diagnosis and treatment of diseases associated with avascular necrosis of bone and cartilage.
Purpose
Legg-Calvé-Perthes disease (LCPD) is a developmental hip disorder caused by interruption of blood supply to the growing femoral head and its subsequent avascular necrosis (AVN), which can ultimately result in a deformed hip joint predisposed to osteoarthritis.1 Current clinical management of LCPD is limited by a lack of noninvasive imaging tools to assess the severity of the disease in the early stage, including the extent of ischemic injury to the secondary ossification center (SOC) (i.e., bone and marrow) and the articular-epiphyseal cartilage complex (AECC).2,3 We have previously demonstrated that quantitative mapping of relaxation times, in particular T1ρ, T2, and RAFF, are highly sensitive to necrosis of the SOC and AECC in an established piglet model of LCPD four weeks following surgery to induce complete femoral head ischemia.4 In this work, we tested the hypothesis that these methods would be sensitive to acute ischemic changes in the femoral head, just 48 hours following ischemia surgery. This would provide further evidence that the quantitative mapping methods are sensitive to AVN and not simply gross morphological changes associated with chronic injury.Methods
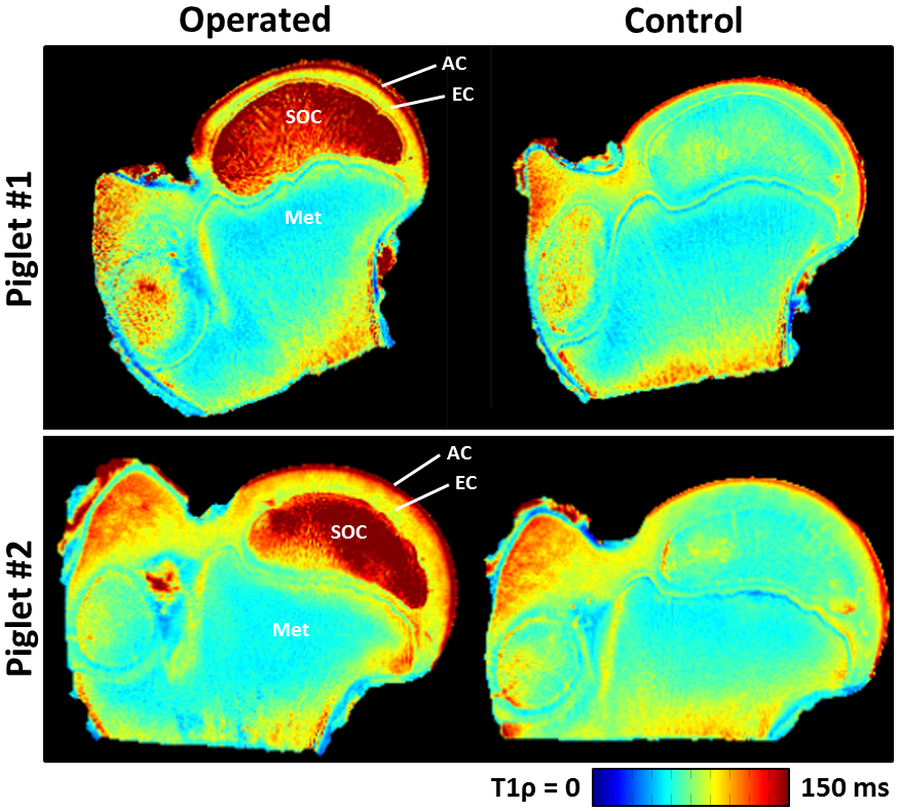
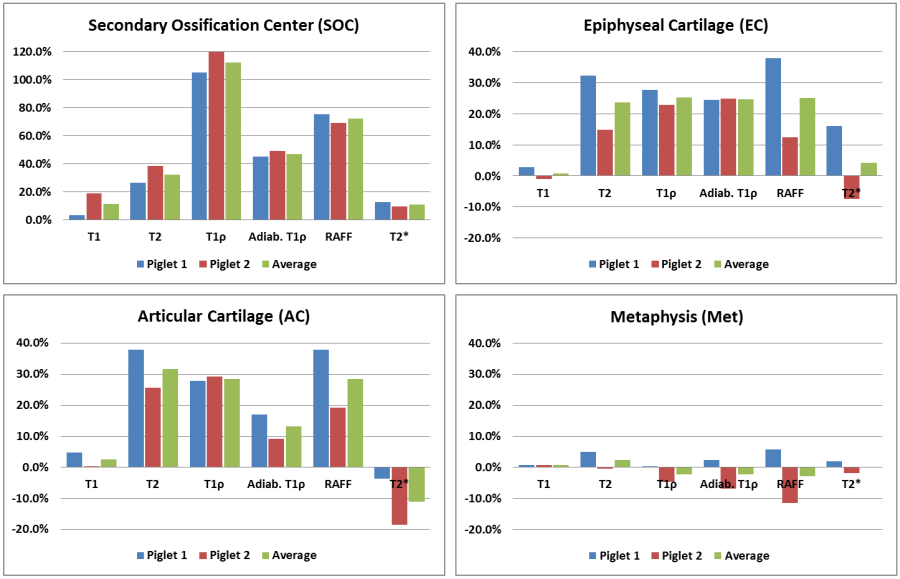
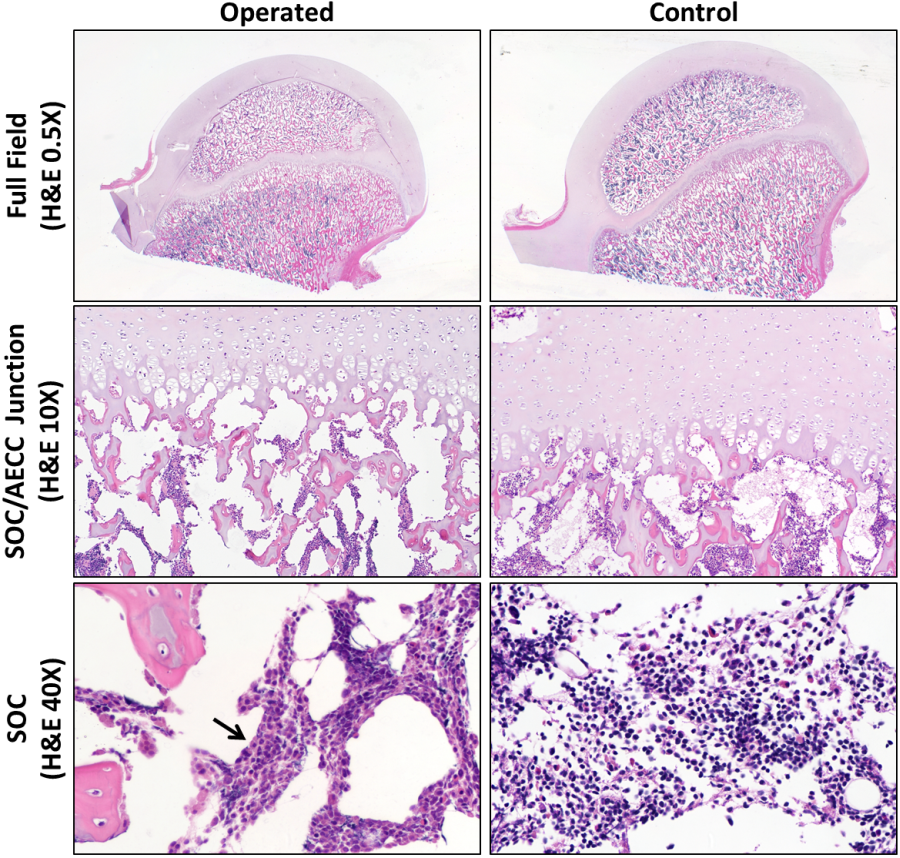
Complete femoral head ischemia was surgically induced in the right hip of two 6-week-old male piglets by placing a ligature tightly around the femoral neck and transecting the ligamentum teres.5 The animals were sacrificed 48 hours following surgery. The right (operated) and left (contralateral control) femoral heads were harvested, immediately frozen for storage, and imaged later. For imaging, the femoral heads were thawed at room temperature, mounted to a holder to control positioning within the MRI scanner, and immersed in Fomblin to reduce susceptibility artifacts. Imaging was then performed on a preclinical 9.4T Agilent MRI system equipped with a Varian console and millipede RF coil. 2D quantitative T1, T2, T1ρ, adiabatic T1ρ, RAFF, and T2* maps were acquired for each of the four specimens (i.e., two pairs of operated and control femoral heads). The first five methods used the same 2D FSE acquisition but with unique magnetization preparations: FOV=40×40 mm2; matrix=256×256; resolution=0.16×0.16 mm2; slice thickness=1.0 mm; TR/TEeff=5000/5.0 ms; ETL=8; BW=132 kHz; T1-prep: TI=200, 500, 800, 1100, 1400, 3000 ms; T2-prep: TE=4, 20, 40, 60, 80, 100 ms; T1ρ-prep: B1SL=500 Hz and TSL=0, 24, 48, 96, 192 ms; adiabatic-T1ρ-prep: B1SL,max=2500 Hz and TSL=0, 24, 48, 72, 96, 144 ms; and RAFF-prep: B1SL,max=625 Hz and TSL=0, 36.2, 72.4, 108.6, 144.8 ms with two phase-cycled acquisitions. For T2* mapping, a 2D GRE sequence was acquired with: same FOV and resolution as the 2D FSE; TR=30 ms; TEs=5, 8, 11, 14, 17, 20, and 25 ms; flip angle=14°; and BW= 50 kHz. Immediately following imaging, the femoral heads were bisected along the imaging plane using a high-speed bone saw and fixed in 10% neutral buffered formalin. After decalcification in 10% EDTA and processing into paraffin, histological sections oriented along the co-registered imaging plane were stained with H&E, toluidine blue, and safranin O for comparison with the MRI data. For analysis using MATLAB, the quantitative maps were generated using mono-exponential fitting and regions of interest (ROIs) were manually drawn for the SOC, epiphyseal cartilage, articular cartilage, and metaphysis (which served as an internal control). The median relaxation times in each ROI were recorded and compared between the operated femoral heads and their paired contralateral controls.Results
Both operated femoral heads had prominently increased relaxation times in the SOC, epiphyseal cartilage, and articular cartilage compared to their paired controls (Figures 1 and 2). In contrast, the metaphysis, which is unaltered by the surgery, showed no change in relaxation times. T1ρ was most sensitive to changes in the SOC (112% increase), and T2, T1ρ, and RAFF were most sensitive to the AECC changes (25-30% increase). Histological evaluation of the corresponding tissue sections revealed evidence of marrow necrosis throughout the SOC and the presence of subtle chondronecrosis at the surface of the articular cartilage and the deepest layer of the epiphyseal cartilage (Figure 3).Discussion
Our results support that quantitative T2, T1ρ, and RAFF maps are potentially useful to detect early SOC and AECC damage following ischemic injury to the femoral head. Interestingly, the increase in SOC relaxation times observed at 48 hours post-surgery are similar to those reported at 4 weeks post-surgery.4 Histological evaluation of the sections did not reveal an explanation for the relaxation time changes, suggesting a potential role for intracellular, molecular, and/or biochemical changes. This unique sensitivity to ischemic damage may allow much earlier diagnosis and treatment of LCPD and other ischemic bone and cartilage disorders than is currently possible.Acknowledgements
This study was supported in part by the NIH (K01AR070894; P41EB015894), W. M. Keck Foundation, and Texas Scottish Rite Hospital for Children.References
1. Kim HK. Pathophysiology and new strategies for the treatment of Legg-Calvé-Perthes disease. J Bone Joint Surg Am 2012; 94(7):659-69.
2. Joseph B, Nair NS, Narasimha Rao KL, Mulpuri K, Varghese G. Optimal timing for containment surgery for Perthes disease. J Pediatr Orthop 2003; 23(5):601-6.
3. Herring JA, Kim HT, Browne R. Legg-Calve-Perthes disease. Part II: Prospective multicenter study of the effect of treatment on outcome. J Bone Joint Surg Am 2004; 86-A(10):2121-34.
4. Johnson CP, Wang L, Toth F, Carlson CS, Kim HK, Ellermann JM. Quantitative mapping of the ischemic femoral head in a piglet model of Legg-Calve-Perthes disease. Proc Int Soc Magn Reson Med 2017; 1593.
5. Kim HK, Su PH. Development of flattening and apparent fragmentation following ischemic necrosis of the capital femoral epiphysis in a piglet model. J Bone Joint Surg Am 2002; 84-A(8):1329-34.
Figures