1427
MRI Methods for Exercise-based Perfusion Assessment of Diabetic Feet with Ulcers1Washington Univesity in St Louis, Saint Louis, MO, United States
Synopsis
The purpose of this study was to develop MRI methods for comprehensive evaluation of foot muscle perfusion and perfusion reserve in patients with diabetes and foot ulcers. Healthy controls and patients with diabetic foot ulcers were scanned with a non-contrast MRI protocol at rest and during a standardized foot flexion exercise. Ischemic regions around foot ulcers were clearly identified with quantitative perfusion data during the exercise.
Objective
Foot ulcers are the leading cause of hospitalization in patients with diabetes mellitus (DM) and 85% of all diabetes-related lower-extremity amputations are preceded by foot ulcers. Tissue ischemia accounts for up to 50% of population with foot ulcers.1 Assessment of local perfusion and perfusion reserve in foot muscle is critical in understanding the status of ischemia in the diabetic foot and corresponding therapeutic treatment effects. However, current clinical evaluation of pedal perfusion is qualitative and indirect, at best. The objective of this project was to develop novel MRI methods to characterize the local perfusion and perfusion reserve in the diabetic foot with ulcers using a new MRI compatible foot ergometer.Methods
Subjects Patients with diabetes and a foot ulcer (n = 7) and age and BMI (body mass index) matched healthy control subjects (n = 7) without history of cardiovascular diseases were prospectively recruited for this study (Table 1).
Experiments All participants underwent MRI perfusion assessment at rest and during a standardized toe flexion exercise using a MRI compatible foot ergometer (Figure 1). The exercise lasted for 4 minutes with 20% of maximum voluntary contraction (MVC). The healthy control subjects were scanned twice on two different days to assess reproducibility.
MRI-compatible foot ergometer We built the foot ergometer shown in Figure 1 to quantify toe flexion force within the MRI scanner. The participants flexes their toes against the pressurized air bulb and the pressure data is displayed in real time on a screen above the scanner through a projector. The participant is instructed first to maximally flex the toes to determine the MVC. During MRI acquisition the participant presses on the ball at approximately 20% of MVC, using the display to guide pressure production.
MRI perfusion measurement The measurement of local perfusion or skeletal muscle blood flow (SMBF) was performed using an arterial spin labeling method.2 The current sequence parameters are: TR/TE = 4.1 msec/1.3 msec; fat saturation; TI = 220, 720, 1220, …,3720 msec, flip angle = 50o; Field of View (FOV) = 320 x 240 mm2; matrix = 128 x 96; average number = 4; total acquisition = 60 sec. Three slices were obtained.
Perfusion map processing and data analysis SMBF maps were created using a custom-made software for all three slices.2 To facilitate the analysis of the ulcer location, a grids-eye map of SMBF with 6 segments per slice was created in a foot, with examples of exercise grids-eye maps in three subjects in Figure 2. To simplify quantitative analysis, the SMBF values within the medial (M) and lateral regions (L) of foot angiosomes were calculated from respective segments, as well as SMBF values within segments immediately adjacent to a foot ulcer. The SMBF reserve was calculated as the ratio of SMBF during flexion exercise to SMBF at rest. The coefficient of variations (CV) were calculated to assess reproducibility of measures.
Results
The mean CVs of exercise SMBF for medial and lateral regions in feet were 14% and 6%, respectively. These values are consistent with the CV measured in calf muscle (14 – 16.3%).2 While there were no significant differences observed in SMBF between healthy and DM+ulcer groups, the SMBF reserve showed a significant decrease in DM+ulcer group compared to the healthy control group in the medial region (Table 1). For ulcers located in the medial region, the averaged SMBF adjacent to them was 8.2 ± 2.9 ml/min/100g which was significantly lower than the averaged SMBF (16.5 ± 6.1 ml/min/100g) in the same regions of feet of the healthy control group. The overall SMBF reserve (medial and lateral regions) within the segments adjacent to foot ulcers in the DM+ulcer group were significantly lower than that in the healthy control group (Figure 1).Discussion and Conclusion
The study demonstrated methods for comprehensive evaluation of muscle perfusion in feet with diabetes and ulcers using non-contrast MRI and during exercise for the first time. All patients performed the study successfully and comfortably without any adverse incidents. Even with only 20% MVC, the ischemic regions can be readily distinguished from normally perfused muscle regions at a quantitative level by the assistance of grids-eye display. These methods are currently investigated for the use of large clinical trials in DM patients with foot ulcers.Acknowledgements
National Institutes of Health; grant number: R21AR065672 and RO1DK105322References
1. Dinh T, et al. Microcirculation of the diabetic foot. Curr Pharm Des 2005; 11: 2301–2309.
2. Zheng J, et al. Noncontrast skeletal muscle oximetry. Magn Reson Med, 2014;71:318-325.
Figures
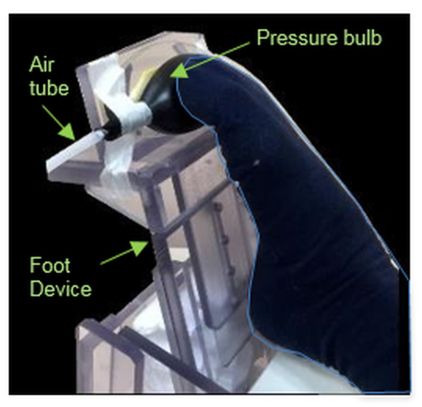
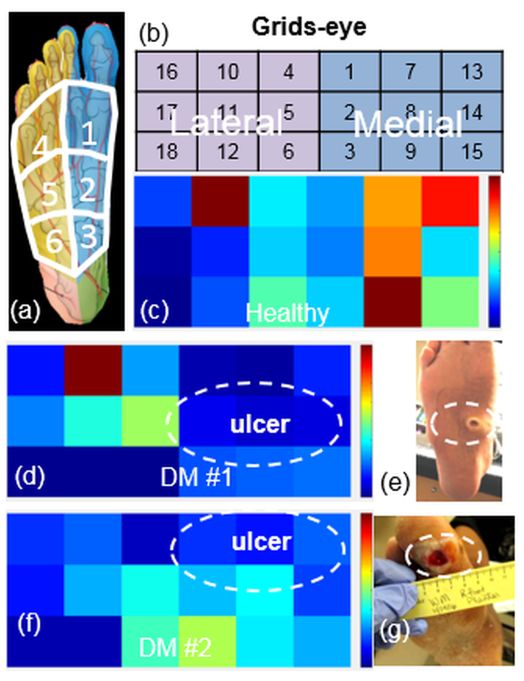
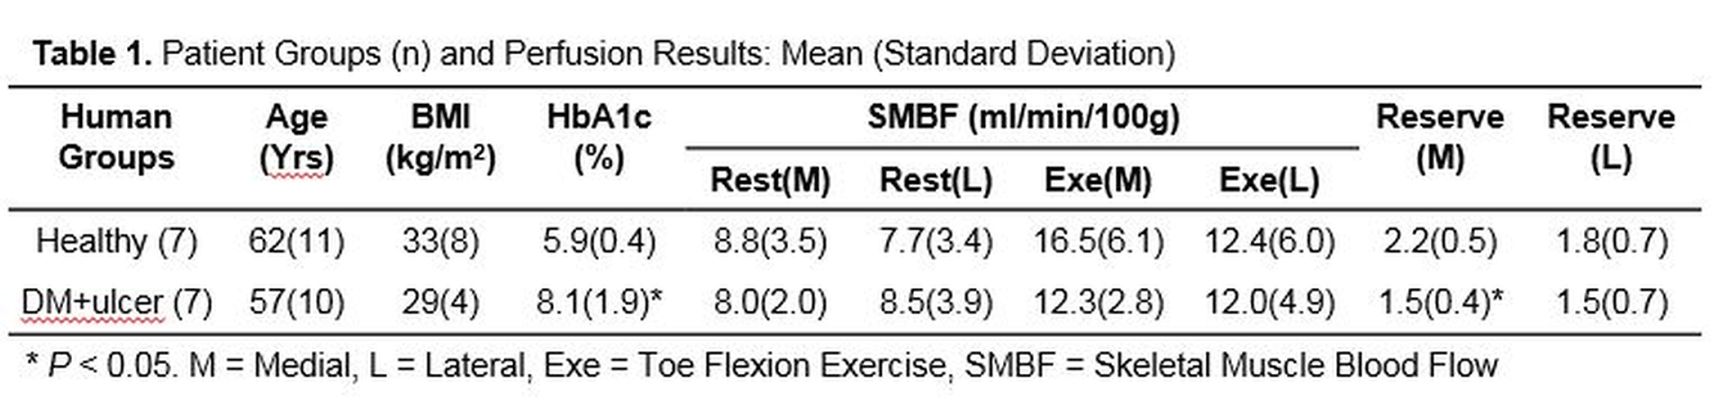
Table 1