1426
Anisotropic analysis and decay characteristics of T2* relaxation of the human Achilles tendon studied with 7 T MR-microscopy1High-Field MR Centre, Department of Biomedical Imaging and Image-guided Therapy, Medical University of Vienna, Vienna, Austria, 2Christian Doppler Laboratory for Clinical Molecular MR Imaging, Vienna, Austria, 3Department of Imaging Methods, Institute of Measurement Science, Bratislava, Slovakia, 4Division of Radiological Physics, Department of Radiology, University of Basel Hospital, Basel, Switzerland, 5Center for Anatomy and Cell Biology, Department for Systematic Anatomy, Medical University of Vienna, Vienna, Austria, 6Center for Medical Physics and Biomedical Engineering, Medical University of Vienna, Vienna, Austria, 7Department of Orthopaedic Surgery, Medical University of Vienna, Vienna, Austria
Synopsis
The fiber-to-field angle dependence and the T2* characteristics of a human Achilles tendon were investigated. The results show an increase of approx. factor 20 in T2* values when the long axis of the tendon is change from 0° to 55°, which is much higher than previously reported. Moreover, in contrast to previous findings we found no homogenous biexponential decay behavior for the tendon on a small sized voxel basis. The results reported here are to our knowledge the first MR-microscopy evaluations of the orientational dependence of T2* relaxation in the Achilles tendon.
Introduction
In MRI, tendon is known to contain primarily short T2/ T2* components. Recent studies have suggested that the T2* decay in the tendon tissue can be described by a biexponential function, where the short and long component of T2* are suggested to reflect bound and free (bulk) water pools1,2.
The aims of this study were: 1) to evaluate the fiber-to-field angle dependence of T2* relaxation; 2) to study the T2* decay characteristics of the Achilles tendon using microscopic in-plane pixel resolution.
Materials and methods
One fresh Achilles tendon was obtained from a human cadaveric ankle (67y, male). All MRI experiments were performed on a 7T whole-body system (Magnetom Siemens Healthineers, Erlangen, Germany) using a microimaging system3 (maximum gradient-strength = 750 mT/m).
Measurements of one Achilles-tendon were made at two fiber-to-field orientations (0, 55°). For morphological evaluation a proton-density-weighted spin-echo sequence was used (voxel size = 59 x 59 x 400 μm3).
Mono- and biexponential T2* assessment was performed on data acquired with the 3D-vTE multi-echo sequence4. Image parameters included: 40 TEs ranging from 0.66 to 51.62 ms (echo spacing: 1.0 - 2.5 ms), TR = 80 ms, FA = 17°, FOV = 30 x 30 mm2, matrix = 320 x 320, pixel size = 94 x 94 μm2, slice thickness = 0.4 mm, number of slices = 72. Two measurements were performed for each orientation, with one and three signal-averages, to gain data with two different SNR levels.
Subsequent voxel-wise analysis was performed on 10 consecutive slices. Mono- and biexponential T2* analysis was performed using a non-linear Levenberg-Marquardt (LM) curve-fitting method5. In order to evaluate the preference of mono-exponential versus a biexponential T2* decay model, we compared the quality of mono- and biexponential model fitting using a small-sample (second order bias corrected) Akaike Information Criterion (AICC)6 and F-test7.
Results
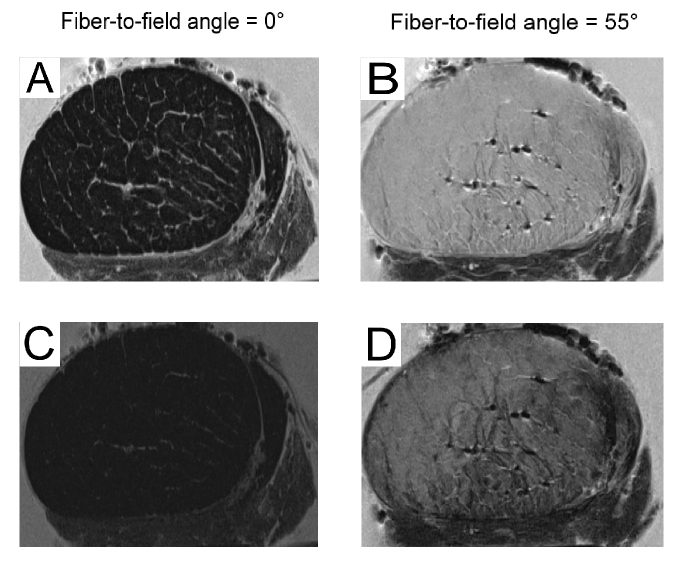
Fig. 1 depicts morphological proton density weighted images (TE = 6.6 ms and TE = 40 ms) of one Achilles tendon measured in two orientations (Fig. 1A-D). Considerable T2* decay already occured for a fiber-to-field angle of 0° when measured with TE = 6.6 ms (Fig.1A). For TE = 40 ms (Fig.1C) the signal approaches background noise level. In contrast, for the magic angle of 55° the two echo times (especially TE = 6.6 ms) show very high signal intensity (Fig. 1B,D).
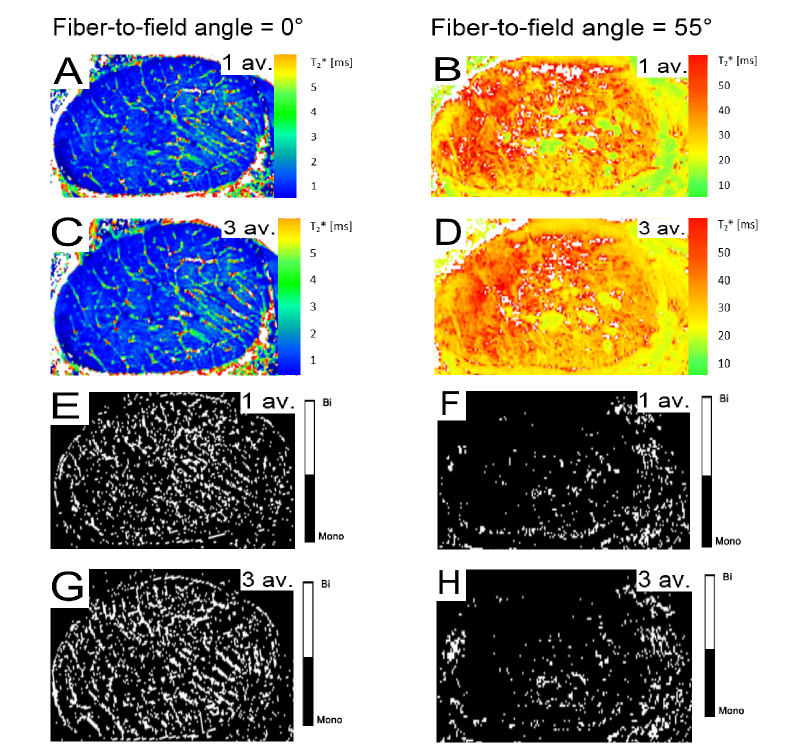
Fig. 2 A-D shows T2* maps measured in two orientations to the magnetic field and at two SNR levels. T2* values showed considerable increase for the magic angle (55°) orientation when compared to the angle of 0°.
For the voxel-wise analysis over 10 consecutive slices the magic angle orientation (55°) showed T2* values with a mean value of 39.5 ± 0.8 ms, whereas at a fiber-to-field angle of 0° the T2* values were very low (T2* = 2.2 ± 0.2 ms).
Voxel-wise analysis, using AICC and F-tests, revealed that biexponential pixels can only be found at an angle of 0° (~20-25%, Fig. 2 E-H). Moreover, there is a slight increase in the number of biexponential pixels (~ 5%) with increasing level of SNR. For the magic angle, the percentage of voxels that can preferentially be considered biexponential is extremely low (<5%) at both SNR levels (SNR~70 and ~110), when tested with AICC and F-test.
Discussion/Conclusion
The results reported here are to our knowledge the first MR microscopy evaluations of the orientational dependence of T2* relaxation in the Achilles tendon.
We showed that monoexponential T2* values varied up to ~2000% with orientation to the magnetic field. This is a much higher increase than previously reported in the literature8.
T2* analysis showed a balance between mono- and biexponential pixel T2* decay at a fiber-to-field angle of 0° for both SNR levels. At the magic angle (55°) we found a very low number of pixels with preferentially biexponential T2* decay in the tendon. We hypothesize here, based on the literature (e.g. [9]), that the short component of T2* (bound water) is subject to a stronger orientational dependence than the long component due to unaveraged dipolar coupling. This hypothesis could explain to some extent the vanishing of the biexponential decay at the magic angle: if it is assumed that the short component (only) exhibits an increase of T2* towards the long T2* (of the other tissue component) approaching the magic angle orientation, then the two components cannot be adequately differentiated anymore by the fitting algorithm.
Acknowledgements
The study was supported by the FWF Project KLI 541-B30.References
1. Du, J., et al., Ultrashort Echo Time Imaging With Bicomponent Analysis, Magnetic Resonance in Medicine, 2012. 67:645–649
2. Juras, V., et al., Bi-exponential T2* analysis of healthy and diseased Achilles tendons: an in vivo preliminary magnetic resonance study and correlation with clinical score, Eur Radiol., 2013. 23(10):2814–2822.
3. Berg, A., et al., MR- Microscopy on a human 7T-scanner, in In: Proceedings of the ISMRM/ESMRMB 2010, Stockholm, Sweden, 1048. 2010.
4. Deligianni, X., et al., High-resolution Fourier-encoded sub-millisecond echo time musculoskeletal imaging at 3 Tesla and 7 Tesla. Magn Reson Med, 2013. 70(5):1434-9.
5. Markwardt, C.B., Non-linear Least-squares Fitting in IDL with MPFIT. Astronomical Society of the Pacific Conference Series, 2009. 411:251-254.
6. Hurvich, C.M. and C.-L. Tsai, Regression and Time Series Model Selection in Small Samples. Biometrika, 1989. 76(2):297-307.
7. Yuan, J., et al., Statistical assessment of bi-exponential diffusion weighted imaging signal characteristics induced by intravoxel incoherent motion in malignant breast tumors. Quant Imaging Med Surg, 2016. 6(4):418-429.
8. Du, J., et al., Orientational analysis of the Achilles tendon and enthesis using an ultrashort echo time spectroscopic imaging sequence. Magn Reson Med, 2010. 28(2):178-184.
9. Henkelman, R.M., et al., Anisotropy of NMR properties of tissues. Magn Reson Med, 1994. 32(5):592-601.
Figures