1423
Preliminary study of BOLD fMRI for the differentiation of musculoskeletal benign and malignant tumors1Dept. of MRI, The First Affiliated Hospital of Zhengzhou University, Zhengzhou, China, 2Philips Healthcare, Beijing, China
Synopsis
This work investigated and evaluated the role of Blood Oxygenation Level-Dependent (BOLD) based functional MRI in characterizing the musculoskeletal tumors, and furtherly evaluate the ability of the power calculated from the fMRI time series to differentiate benign and malignant tumors, which might be helpful for clinical diagnosis and studies.
Purpose
Recent studies have shown that BOLD fMRI reflect the potential ability to evaluate tumor metabolism and angiogenesis, and offers a method to reflect the blood supply and consumption information in brain diseases and liver tumors1-2, but it was rarely used in the study of musculosketltal tumors. The purpose of this study is to investigate the application of BOLD fMRI on musculoskeletal tumors and furtherly evaluate the ability of the power extracted from BOLD signals to differentiate benign and malignant tumors .Methods:
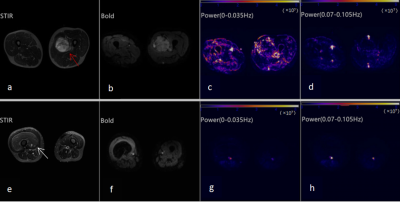
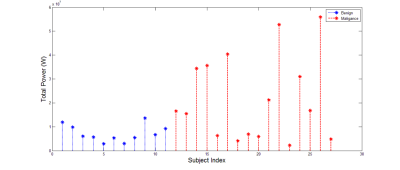
Twenty-seven patients(14 males and 13 females aged 40.2±12.5 years old) with musculoskeletal tumors(all have been diagnosed as musculoskeletal tumor according to pathological biopsy) were included in this study. Based on the WHO Classification of Tumors of Soft Tissue and Bone(2013) criteria, patients were divided into two groups:16 for malignancies and 11 for benign tumors. All patients were scanned by using BOLD sequence based on a 3T MR scanner (Ingenia, Philips Healthcare, Best, the Netherlands). The BOLD scanning was performed with the following parameters: TE=30ms; TR=2000ms; In-plane resolution=2mm×2mm;slice thickness=4mm;NSA=1, 120 dynamics. The STIR sequence with the following parameters: TR=200ms, TE=60ms. The pre-processing steps of the bold fMRI includes realign, slice timing, and filtering (0-0.25Hz, maximum frequency was corresponding to the TR=2s). Then Fourier transform was applied on the processed fMRI time series and the full frequency (0-0.25Hz) was divided into seven frequency sub-bands (Table 1). The signal power within each frequency sub-bands were calculated voxel-by-voxel. And thus seven power mappings were obtained for each subject. All the above parameters were measured by drawing ROIs (Region of Inrerest) which covered the whole lesions on the lesion maximum slice. And the measured signal power in benign and malignant lesions were compared by using Independent Two Samples T test and a P value of less than 0.05 was considered statistically significant.Results:
The statistical results of the parameters with significant difference between benign and malignant lesions were summarized in Table 1. The results revealed that the signal power in high frequency sub-bands are not significantly different(P>0.05). However, the power in low frequency sub-bands showed significant difference(P<0.05) between benign and malignant lesions.Discussion:
BOLD fMRI is a noninvasive technique sensitive to tumor vascular oxygenation, it provides useful information to reflect blood flow fluctuation. Recent studies showed that pattern of vascularity in benign and malignant tumor is different. Malignant tumors vessels are immature and lacking smooth muscle around the wall, the vascular of benign tumor is mature with homogeneous density3. BOLD imaging conveys vasoreactive maturation information. In this study, the results showed the ability of BOLD fMRI in the differentiation of malignant from benign tumors. In the future, more patients with different musculoskeletal tumors will be included in our study to furtherly evaluate clinical value of the BOLD technique.Conclusions
BOLD fMRI is helpful to evaluate the differences between musculoskeletal malignant and benign tumors.Acknowledgements
No acknowledgement found.References
[1] Patterson A J, Priest A N, Bowden D J, et al. Quantitative BOLD imaging at 3T: Temporal changes in hepatocellular carcinoma and fibrosis following oxygen challenge[J]. Journal of Magnetic Resonance Imaging, 2016, 44(3):739-744
[2] Jiang L, Weatherall P T, Mccoll R W, et al. Blood oxygenation level-dependent (BOLD) contrast magnetic resonance imaging (MRI) for prediction of breast cancer chemotherapy response: a pilot study[J]. Journal of Magnetic Resonance Imaging Jmri, 2013, 37(5):1083-92.
[3] Mahajan A, Engineer R, Chopra S, et al. Role of 3T multiparametric-MRI with BOLD hypoxia imaging for diagnosis and post therapy response evaluation of postoperative recurrent cervical cancers[J]. European Journal of Radiology Open, 2016, 3(2016):22.
Figures


