1420
A machine learning method for tissue characterisation in the human thigh1Medical School, University of Warwick, Coventry, United Kingdom, 2Radiology, University Hospitals Coventry & Warwickshire NHS Trust, Coventry, United Kingdom, 3Medical Physics, University Hospitals Coventry & Warwickshire NHS Trust, Coventry, United Kingdom, 4Computer Science, University of Warwick, Coventry, United Kingdom, 5Department of Rheumatology, University Hospitals Coventry & Warwickshire NHS Trust, Coventry, United Kingdom
Synopsis
Inflammatory idiopathic myositis is a debilitating inflammatory muscle condition. Diagnosis relies on a battery of tests, but monitoring of disease severity can be challenging. We present a novel machine learning approach to classifying tissues using multi-parametric analysis of routine MRI sequences. A logistic regression model was trained to predict tissue type based on T1 and STIR signal intensity and 10-fold cross-validated. The system attained 93.8% sensitivity and 96.9% specificity overall (ROC area 0.991). Testing of this model showed a low level of ostensible muscle inflammation in 9/11 asymptomatic controls – likely due to misclassification of vessels.
INTRODUCTION
Inflammatory idiopathic myositis (IIM) is a debilitating inflammatory condition of skeletal muscles characterised by proximal muscle weakness, with an annual incidence of 7 per 100,000. Diagnosis relies on an assortment of tests including clinical examination, measurement of serum muscle enzymes, electromyography, and muscle biopsy1,2. These criteria have a sensitivity of 75%3, but are less reliable in assessing disease severity.
Improved diagnostic tools would facilitate earlier treatment. Tools for disease monitoring would prevent over-treatment or identify patients in whom treatment intensification is required, as failure to treat can result in significant morbidity and mortality4.
We hypothesise that a machine learning approach may be used to differentiate tissues on routine MRI sequences, and quantify the severity of muscle inflammation in IIM.
METHODS
Five symptomatic volunteers (3 males, 2 females, age 34 +/- 7 years) and 11 asymptomatic controls (7 males, 4 females, age 54 +/- 12 years) were imaged on 1.5T scanners (Optima MR450w and Optima MR360, General Electric, Milwaukee, USA) with a phased array body coil placed over the thighs.
T1-weighted FSE (TR=500ms, TE=minimum full, number of signal averages=4) and STIR (TR=5300ms, TE=40-60ms, TI=170ms, number of signal averages=2) sequences were acquired. Between 6 and 12 image-pairs (i.e. ‘slices’) were acquired for each subject.
T1-weighted and STIR image pairs were normalised with respect to maxima within each image stack to facilitate direct comparison between subjects. Regions of interest were defined manually around areas of confluent high STIR signal within muscle consistent with muscle inflammation (in symptomatic volunteers) and within overtly normal muscle and subcutaneous fat (alternate image pairs in asymptomatic controls) using Image J5.
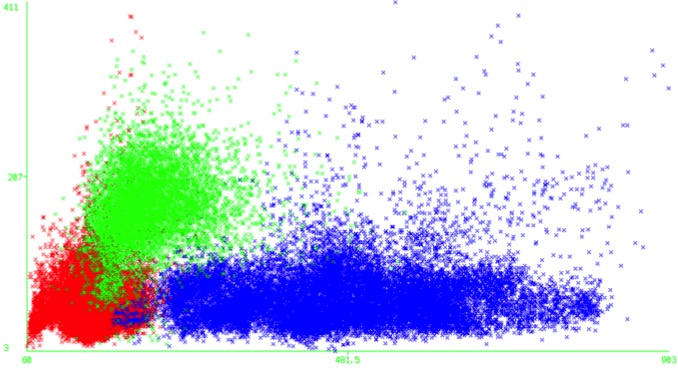
Paired signal intensity data were evaluated in WEKA (Waikato Environment for Knowledge Analysis, version 3.8.1, the University of Waikato, Hamilton, New Zealand) and plotted in a scatterplot (Figure 1). A logistic regression model was used for classification according to tissue type using 10-fold cross validation.
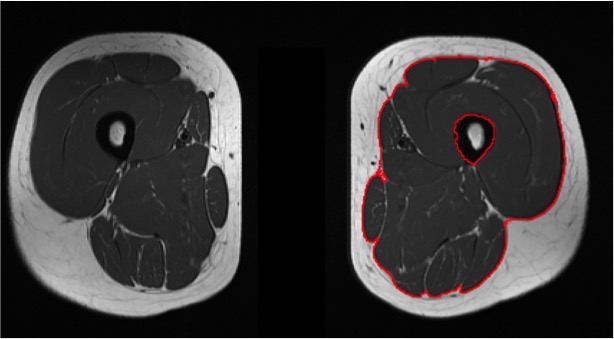
This model was then tested on alternate image pairs (i.e. those not included in the training data set) for asymptomatic controls, to determine the normal range of ostensibly inflamed muscle voxels in the healthy population. Regions of interest were manually defined around the deep fascia of the thigh (Figure 2) as this is a readily identifiable and reproducible anatomical landmark.
RESULTS
The training dataset comprised 30 image-pairs from 5 patients with florid myositis, and 48 image-pairs from 11 asymptomatic controls.
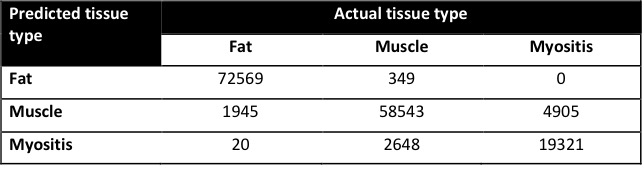
For classification, 93.8% of voxels were correctly identified with respect to their tissue type, with 96.9% specificity overall (Figure 3). The receiver operator characteristic (ROC) area under the curve (AUC) was 0.991, and kappa statistic was 0.899.
On a tissue-by-tissue basis, the regression model attained high accuracy in identifying fat (97.4% sensitivity, 99.6% specificity, AUC 0.998) and muscle (95.1% sensitivity and 93.1% specificity, AUC 0.984) voxels. When identifying myositis, sensitivity was 79.8% and specificity 98.0% (AUC 0.986).
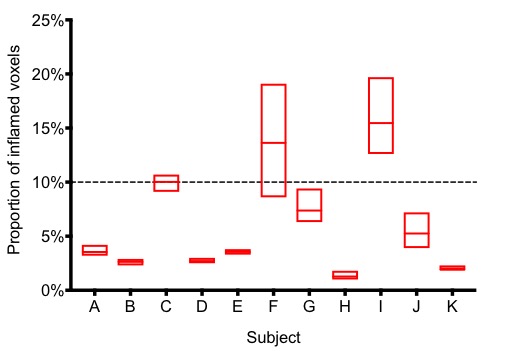
The test dataset comprised 30 image pairs from 11 asymptomatic controls. In all cases a small proportion of voxels were classified as muscle inflammation (Figure 4), amounting to 10% or less of total muscle mass in 9/11 individuals.
DISCUSSION
This model correctly classified the vast majority of voxels according to their tissue type, and permits quantification of each of these tissue types on routine MRI sequences.
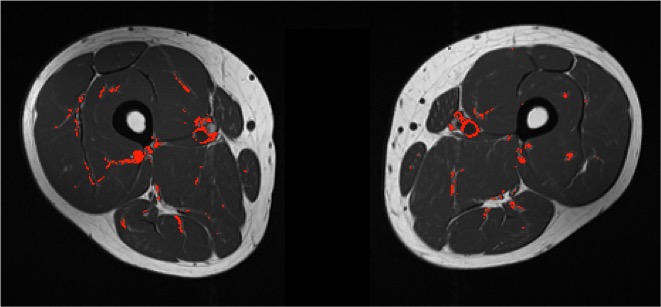
We identified a low level of ostensibly inflamed muscle voxels in asymptomatic controls. Whilst it is feasible that there is low level myositis in the asymptomatic population, and that this technique identifies smaller deposits of muscle inflammation than are otherwise possible by visual inspection alone, many of these misclassified voxels correspond to vessels (Figure 5). We hypothesise that there will be a higher proportion of inflamed muscle voxels in patients with IIM.
This model also allows quantification of the proportion of fat within muscle. Fatty replacement of muscle occurs in steroid-induced myopathy, which can have similar clinical manifestations to IIM. Therefore this model may assist in differentiating breakthrough muscle inflammation and steroid-induced atrophy, thereby enabling better targeting of treatment.
CONCLUSION
A machine learning approach to multi-parametric MRI analysis shows promise in characterising tissue in IIM.Acknowledgements
No acknowledgement found.References
- Bohan A, Peter J (1975). Polymyositis and dermatomyositis (first of two parts). N Engl J Med 292: 344-7
- Bohan A, Peter J (1975). Polymyositis and dermatomyositis (second of two parts). N Engl J Med 292:403-7
- Targoff IN, Miller FW, Medsger Jr TA, Oddis CV (1997). Classification criteria for the idiopathic inflammatory myopathies. Curr Opin Rheumatol 9:527
- Mandel DE, Malemud CJ, Askari AD (2017). Idiopathic Inflammatory Myopathies: A Review of the Classification and Impact of Pathogenesis. Int J Mol Sci 18:E1084
- Schindelin J, Arganda-Carreras I & Frise E et al. (2012). Fiji: an open-source platform for biological-image analysis, Nature Methods 9(7): 676-682.
Figures