1416
Accuracy of MRI-based measurements of aponeurosis dimensions1Neuroscience Research Australia, Randwick, Australia, 2Sydney University, Camperdown, Australia, 3University of New South Wales, Kensington, Australia, 4Philips Electronics Australia, Sydney, Australia
Synopsis
Aponeuroses are the thin, sheet-like tendons that cover substantial parts of muscles. We validated measurements of the dimensions of aponeuroses from T1, mDixon and ultrashort echo time (UTE) scans by comparing to direct measurements from dissection and digitisation. We used sequences that are feasible for human studies. Aponeurosis widths and lengths, measured on 20 lamb muscles, were substantially underestimated from mDixon scans. More accurate measurements were obtained from T1 and UTE scans, which had root mean square errors of 8-10% and 5-13% of the aponeurosis width and length, respectively, and did not systematically underestimate or overestimate aponeurosis width or length.
Introduction
Tendons are important for human and animal movements. They connect muscles to bones, increase efficiency of locomotion, and enable movements at speeds higher than muscles can contract 1. Most research focuses on the extramuscular, rope-like parts of tendons (e.g. the Achilles tendon). However, most muscles also have sizeable intramuscular, sheet-like tendons (aponeuroses) whose function is understood incompletely 2,3.
In vivo characterisation of the complex shapes of aponeuroses may improve understanding of their function. It appears possible to measure aponeurosis dimensions from conventional spin-echo magnetic resonance imaging (MRI) scans, because the short T2 times in tendinous tissue cause aponeuroses to appear as black voids between muscles 4,5. However, aponeuroses can be thin and therefore difficult to discern over their entire length.
Here, we validate measurements of aponeurosis dimensions using two MRI sequences frequently used for muscle imaging (T1 and mDixon), and an ultrashort echo time (UTE) sequence with echo times 40-100 times shorter than conventionally used 6. UTE is a promising method for aponeurosis imaging because it provides contrast in tissues with short T2-times. The MRI-based measurements of aponeurosis width and length are compared to detailed, direct measurements made by dissection and 3D digitisation.
Methods
The peroneus tertius and digital extensor muscles, containing an internal and a surface aponeurosis, respectively, were dissected from ten fresh lamb shanks. The muscles were submerged in gelatine and scanned with a 3.0 T clinical whole-body MR system (Achieva TX, Philips Healthcare, Best, The Netherlands) using a cardiac array coil with 32 elements for receive. The muscles’ long axes were aligned with the scanner bore and axial UTE, mDixon and T1 images were obtained with the following parameters. UTE: 3D IR-TFE radial stack of stars technique with FID sampling, non-selective pulse for RF excitation to achieve a shorter echo time, FOV=160×160mm, slice=4 mm (2mm over-contiguous), acquisition matrix=268×268 (recon=320×320), flip angle=16°, BW=500 Hz/pixel, TFE factor=7, 200% density of angles, TR/TE/TI/TFE shot interval = 4.7/0.15/57/125 ms, scan time=17.5 minutes. mDixon: 2-point 3D multi-echo mDixon FFE, FOV=160×160mm, acquisition matrix=160×160 (recon=176×176), slice=2mm (1mm over-contiguous), TR /TE1/TE2=6.0/2.3/4.6 ms, NSA=2, scan time=2.72 min. T1-weighted: 2D TSE, FOV=160×160, acquisition matrix 256× 182 (recon=768×768), slice=2 mm, TR/TE=699/13ms, flip angle=80°, refocussing control=T1 optimised, NSA=2, scan time=7.85 min
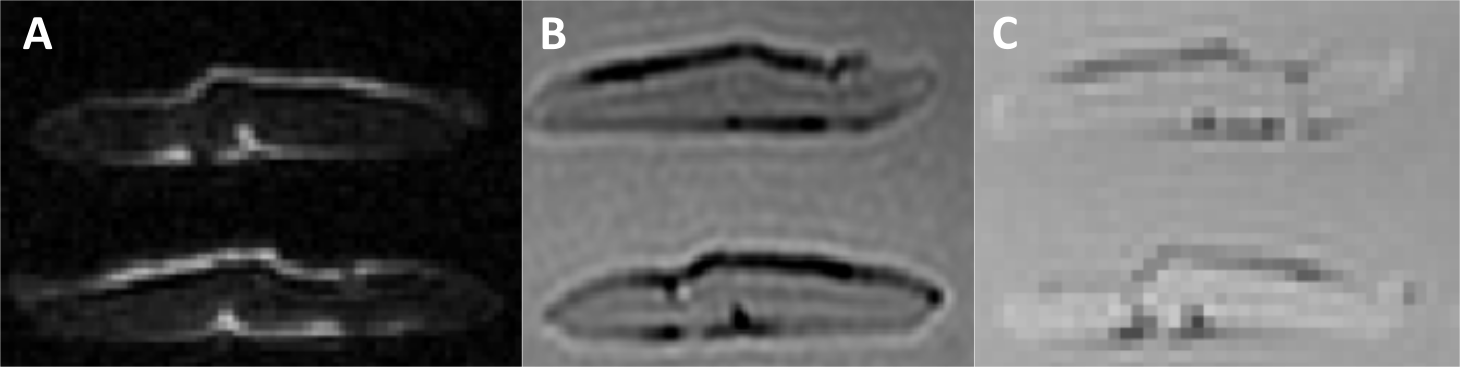
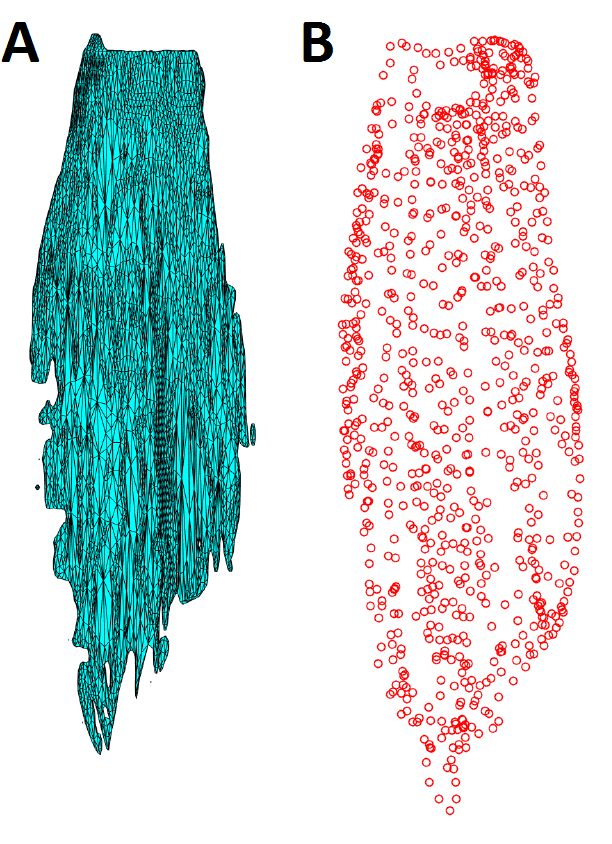
The aponeuroses of all muscles were semi-automatically segmented on all three scans (T1, UTE and mDixon; Fig. 2) using 3D Slicer (www.slicer.org). 3D surface models were reconstructed (Fig. 3a) and projected onto a 2D plane using principal component analysis. Aponeurosis length and width were calculated as the dimensions of the surface model along the first and second principal component, respectively.
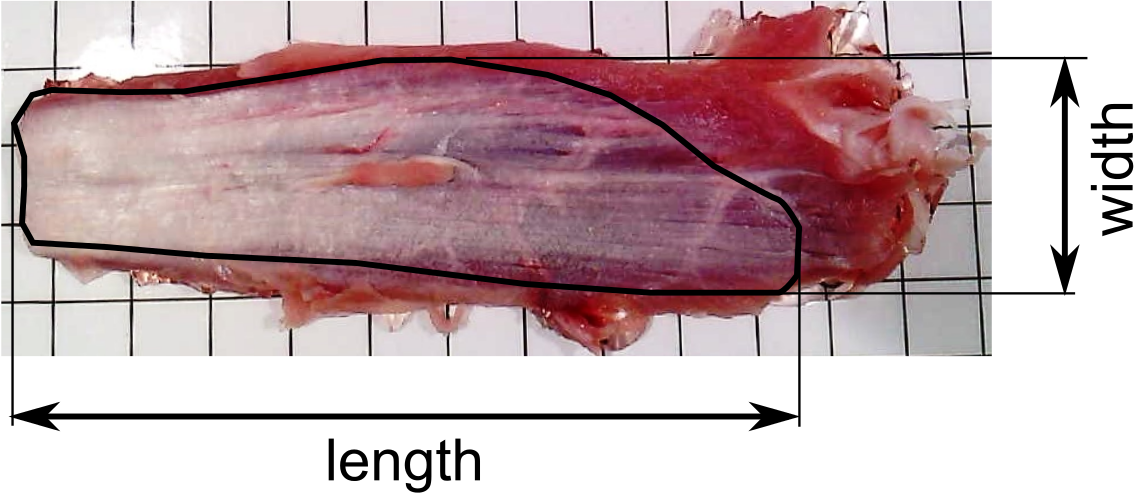
To measure aponeurosis dimensions through anatomical inspection, the muscles were pinned to a styrofoam board and the tip of a 3D digitiser (MicroScribe G2X, Immersion Corp., San Jose, USA) was slowly moved over the aponeurosis while storing 3D coordinates. Similar to the MRI measurements, the resulting point cloud (Fig. 3b) was projected onto a 2D plane and measurements of aponeurosis width and length were made. Each aponeurosis was digitised by three raters. Differences between measurements obtained from MRI scans and measurements made with dissection and digitisation were expressed as root mean square error (RMSE) and mean signed difference between the widths and lengths measured through digitisation (average of three raters) and MRI.
Results
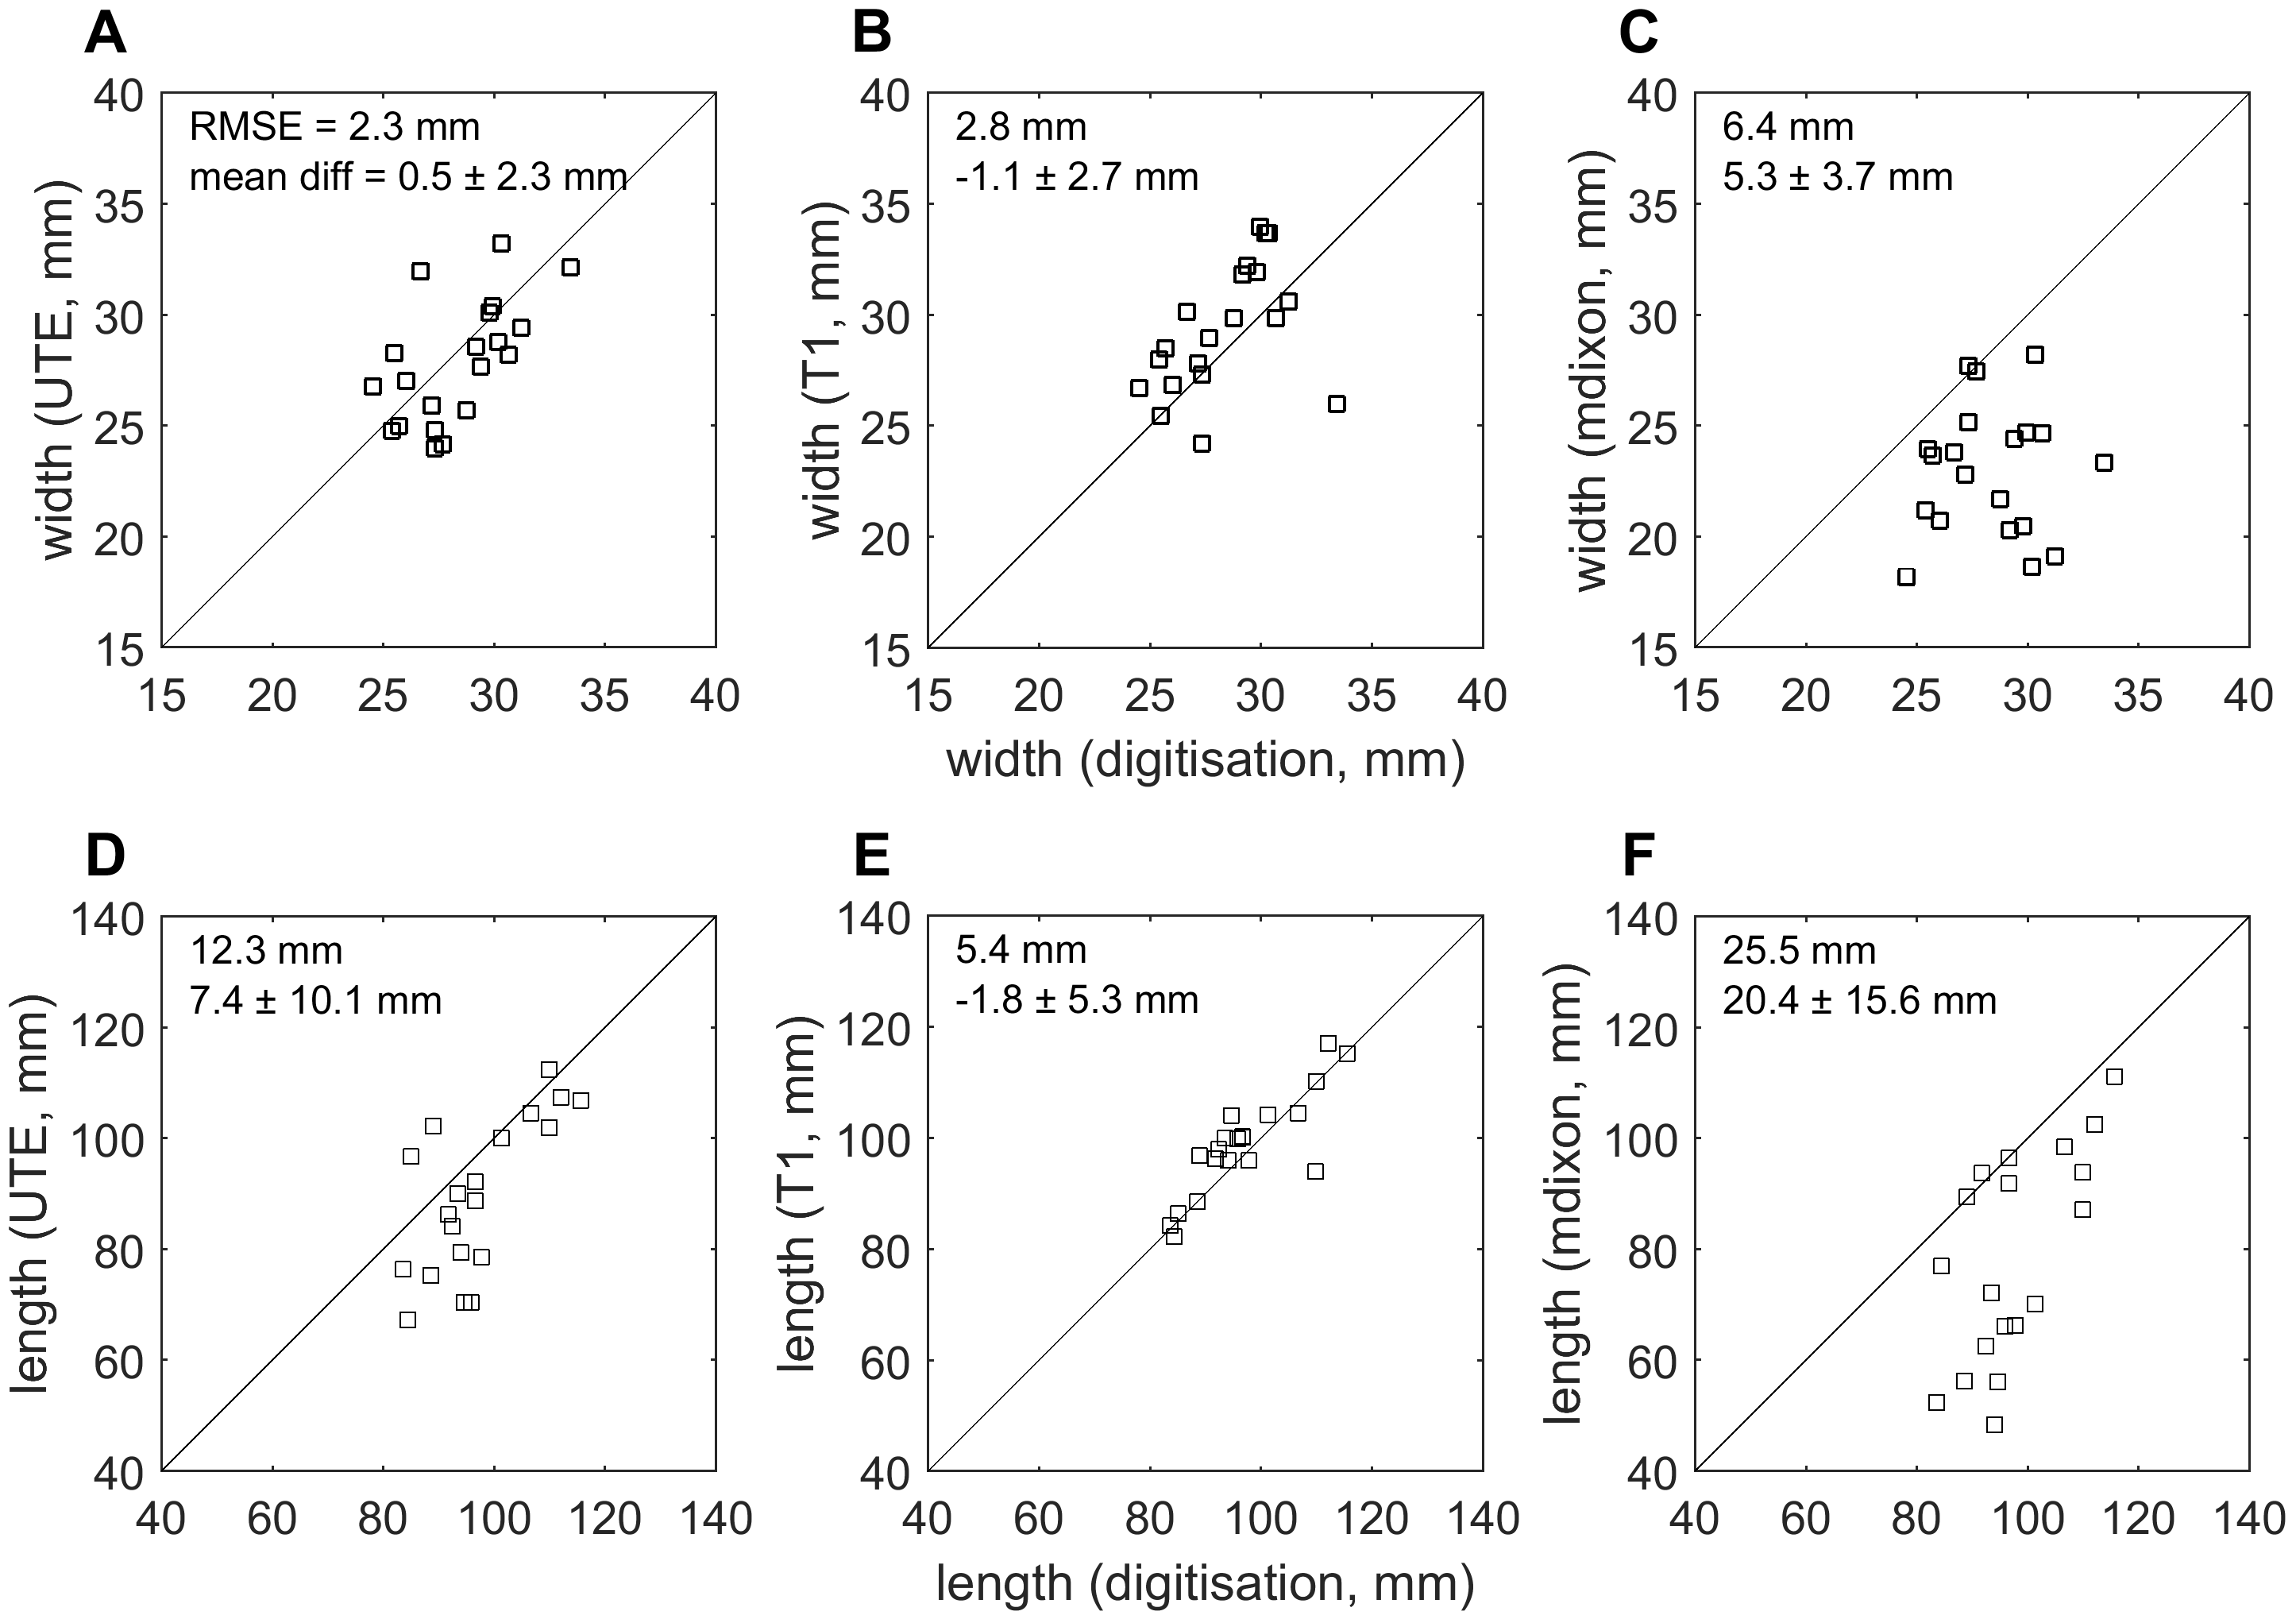
As expected, aponeuroses appeared with low intensity on the T1 and the mDixon, and with high intensity on the UTE scan(Figure 2). Aponeuroses were, on average, 26.7 ± 1.8 mm wide and 88.3 ± 12.7 mm long. Inter-rater reliability of measurements from digitisation was high: intra-class correlation coefficients were 0.94 and 0.89 for aponeurosis width and length, respectively. mDixon scans substantially underestimated both widths (mean difference (digitisation minus MRI) = 5.3 ± 3.7) and lengths (20.4 ± 15.6 mm; Figure 4). Lengths were most accurately measured from the T1 scan (-1.8 ± 5.3 mm). The UTE and T1-scans provided equally accurate measurements of aponeurosis widths (Figure 4).Conclusion
We present the first validation of measurements of aponeurosis dimensions from UTE, T1 and mDixon sequences that can be used in human studies. We found that mDixon scans, which had a coarser resolution than the other scans, resulted in substantial underestimations because the thin aponeuroses were not discernible on mDixon scans for a substantial part of their length. Measurements of aponeurosis width and length obtained from T1 and UTE scans had smaller errors and did not systematically underestimate or overestimate aponeurosis width and length. We conclude that aponeurosis dimensions can be measured using either T1-weighted or UTE scans.Acknowledgements
The study was supported by the Australian National Health and Medical Research Council (NHMRC; Program Grant APP1055084) and the National Imaging Facility. A. D’Souza is supported by a scholarship from the Royal Freemasons Benevolent Institute.References
1. Alexander RM. Tendon elasticity and muscle function. Comp Biochem Phys A. 2002;133(4):1001-1011.
2. Azizi E, Roberts TJ. Biaxial strain and variable stiffness in aponeuroses. J Physiol. 2009;587(17):4309-4318.
3. Raiteri BJ, Cresswell AG, Lichtwark GA. Three-dimensional geometrical changes of the human tibialis anterior muscle and its central aponeurosis measured with three-dimensional ultrasound during isometric contractions. PeerJ. 2016;4:e2260.
4. Kinugasa R, Shin D, Yamauchi J, et al. Phase-contrast MRI reveals mechanical behavior of superficial and deep aponeuroses in human medial gastrocnemius during isometric contraction. J Appl Physiol. 2008;105(4):1312-1320.
5. Hodgson JA, Finni T, Lai AM, Edgerton VR, Sinha S. Influence of structure on the tissue dynamics of the human soleus muscle observed in MRI studies during isometric contractions. J Morphol. 2006;267(5):584-601.
6. Robson MD, Benjamin M, Gishen P, Bydder GM. Magnetic resonance imaging of the Achilles tendon using ultrashort TE (UTE) pulse sequences. Clin Radiol. 2004;59(8):727-735.
Figures