1414
Analysis of the Orientation-Dependent Frequency of Tendon via Ultrashort Echo Time (UTE) MRI1Oxford Centre for Clinical Magnetic Resonance Research (OCMR), Division of Cardiovascular Medicine, Radcliffe Department of Medicine, University of Oxford, Oxford, United Kingdom
Synopsis
Tendon exhibits changes in T2, T2*, and resonant frequency as a function of its orientation with respect to B0. An ultrashort echo time (UTE) sequence was employed to characterize the frequency of fresh bovine digital flexor tendon at angles of 0⁰ to 90⁰ relative to B0, causing a maximal frequency shift of 1.0 ppm. Factors that could influence the frequency of tendon were evaluated. It was found that the frequency of tendon was affected by the enclosing container, but not the geometry of the tendon.
Introduction
Tendon is a connective tissue that consists of 90 – 100 % Type I collagen, and exhibits the “magic angle effect”, which refers to the dependence of T2 and T2* on the orientation of the tendon with respect to B0 1. Similarly, the resonant frequency of tendon has been shown to depend on its orientation relative to B0; Krasnosselskaia et al. reported a frequency shift of 3.1 ppm between 0⁰ and 90⁰ in bovine digital flexor tendon within a cylindrical glass tube via a free induction decay (FID) sequence at 2 T 2, whereas Du et al. reported a maximal frequency shift of 1.2 ppm in the Achilles tendon within a human ankle specimen via an ultrashort echo time spectroscopic imaging (UTESI) sequence at 3 T 3. Our objective was to investigate factors that affect the tendon frequency via a 3-T UTE pulse sequence.Methods
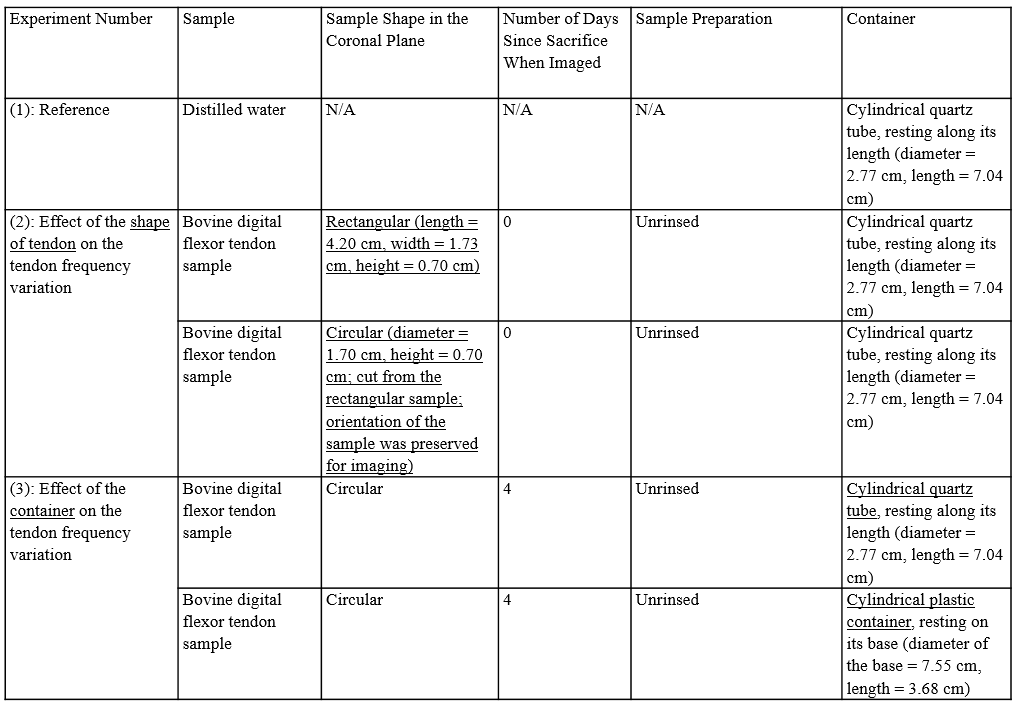
Three experiments were performed, according to Table 1, to investigate: (1) the orientation-dependent frequency of water, (2) the effect of the shape of the tendon on the orientation-dependent frequency of tendon, and (3) the effect of the container on the orientation-dependent frequency of tendon. For Experiments (2) – (3), bovine digital flexor tendon was obtained from a local abattoir within 1 hour of the sacrifice; one sample (length = 4.20 cm, width = 1.73 cm, height = 0.70 cm) was cut along the length of the tendon.
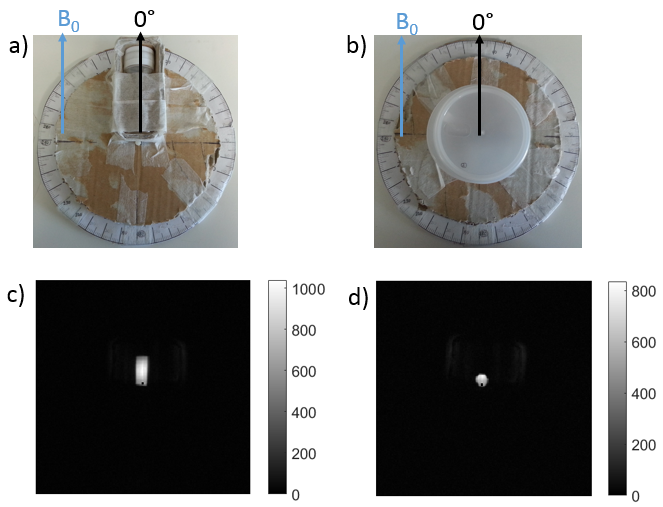
The water and tendon samples were placed in a container on a rotating plate to position the sample at angles of 0⁰, 10⁰, 20⁰, 30⁰, 40⁰, 50⁰, 55⁰, 60⁰, 70⁰, 80⁰, and 90⁰ to B0 (Figure 1). At each angle, the sample was imaged at 3 T using a four-channel carotid coil (Machnet, The Netherlands), and a 2D-UTE sequence with a half-pulse excitation and radial sampling (Image Orientation: Coronal; TR = 50 ms; FA = 4⁰; NA = 4; ST = 8 mm; FOV = 300 mm x 300 mm; Matrix = 256 x 256; BW = 980 Hz/pixel). TEs were 2.69, 3.94, 5.19, 6.44, 7.69, 8.94, and 10.19 ms for the water sample (Experiment 1); and 0.23, 0.29, 0.39, 0.54, 0.69, 0.94, and 1.29 ms for tendon (Experiments (2) – (3)). The tendon sample was stored at 4 ⁰C between imaging sessions. The signal from a 3-pixel x 3-pixel ROI at each angle was fitted via $$$S(TE) = S_{0}e^{i2\pi fTE}e^{i\phi} e^{-TE/T_{2}*}$$$ to obtain the frequency. As a reference, the frequency shift of water within a cylindrical tube was fitted via $$$f(\theta) = \frac{\triangle\chi}{2}(cos^{2}\theta - \frac{1}{3}) + offset$$$, which describes the frequency variation of an infinite cylinder; the magnetic susceptibility of water (χ) was subsequently calculated.
The correlation of determination (R2) between the frequency difference and the angle was found; the frequency difference was between varying shapes of tendon in Experiment (2), and between varying containers enclosing the tendon in Experiment (3).
Results and Discussion
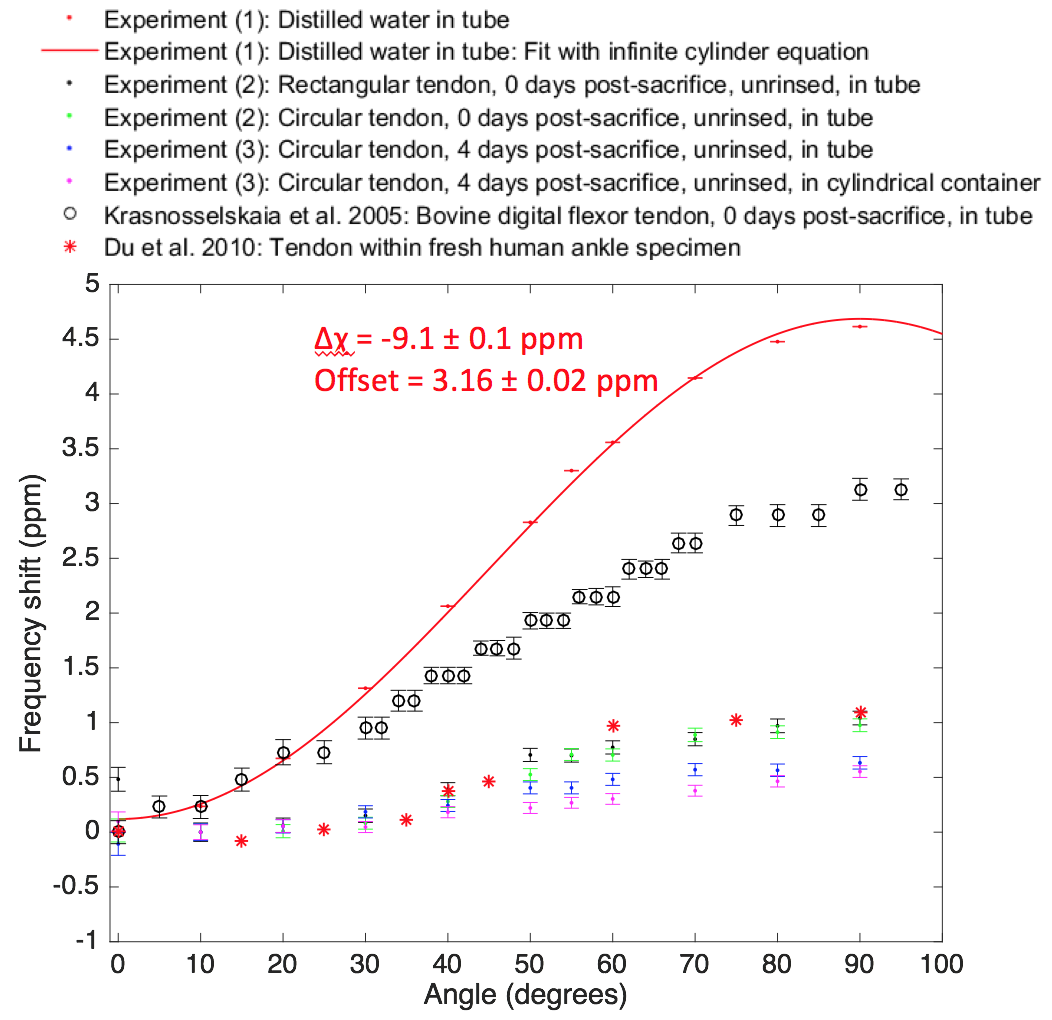
Figure 2 illustrates the magnitude of the frequency shift as a function of the orientation relative to B0.
From Experiment (1), the difference in magnetic susceptibility between air and water (Δχ) was determined to be -9.1 ± 0.1 ppm. Assuming the magnetic susceptibility of air to be 0.36 ppm, the magnetic susceptibility of water derived from the experiment was -8.8 ± 0.1 ppm, which was similar to the actual value of -9.05 ppm 4. This suggested that the frequency shift of water was dependent on the geometry of the cylindrical tube containing the water.
Experiment (2) indicated that the shape of the tendon had no detectable effect on the tendon frequency shift (R2 = 0.23, p = 0.14). Experiment (3) demonstrated a small but significant effect of the container on the tendon frequency shift (R2 = 0.47, p = 0.02). Contributing factors may have included the container geometry and material.
The maximal frequency shift of 1.0 ppm in the tendon sample was lower than the maximal frequency shift of 3.1 ppm found by Krasnosselskaia et al. acquired under similar conditions. We are continuing to explore the mechanism for these differences. Our measurements were similar to those of Du et al., who found a frequency change of 1.2 ppm; however, our samples were different: their tendon sample was in a cadaverous ankle, where the frequency shift may have been influenced by surrounding tissue in the specimen.
These experiments demonstrated that the
frequency shift of tendon was influenced by the container, but not the geometry
of the tendon.
Conclusion
The orientation-dependent frequency of fresh tendon was found to vary by 1.0 ppm.Acknowledgements
This research was supported by the British Heart Foundation.References
1. Fullerton GD. Physical Chemistry of Collagen : The Molecular Basis of Magic Angle Contrast. 2012;1:903-914. doi:10.1002/9780470034590.emrstm1281.
2. Krasnosselskaia L V, Fullerton GD, Dodd SJ, Cameron IL. Water in tendon: orientational analysis of the free induction decay. Magn Reson Med. 2005;54(2):280-288. doi:10.1002/mrm.20540.
3. Du J, Chiang AJ-T, Chung CB, et al. Orientational analysis of the Achilles tendon and enthesis using an ultrashort echo time spectroscopic imaging sequence. Magn Reson Imaging. 2010;28(2):178-184. doi:10.1016/j.mri.2009.06.002.
4. Schenck JF. The role of magnetic susceptibility in magnetic resonance imaging: MRI magnetic compatibility of the first and second kinds. Med Phys. 1996;23(6):815. doi:10.1118/1.597854.
Figures