1413
Dynamic contrast enhanced MR imaging in early stage knee osteoarthritis: A test-retest repeatability study1Bioxydyn, Manchester, United Kingdom, 2Centre for Imaging Sciences, University of Manchester, Manchester, United Kingdom, 3Department of Radiology, University of Cambridge, Cambridge, United Kingdom, 4Department of Trauma & Orthopaedics, University of Cambridge, Cambridge, United Kingdom, 5GSK, Stevenage, United Kingdom
Synopsis
Dynamic contrast-enhanced MRI (DCE-MRI) has proven to be an effective method for qualitative and quantitative measurement of synovitis in the knee. Here we evaluate the test-retest repeatability of DCE-MRI measurements in the knee at 3 T. Eight patients with mild/moderate knee osteoarthritis (OA) were scanned twice, 4 weeks apart. DCE biomarkers from the extended Tofts model were measured. This is the first demonstration of the repeatability of DCE-MRI in knee OA. This evaluation provides data to enable sample size calculations for further longitudinal and interventional studies using DCE-MRI as a biomarker of inflammation in OA.
Introduction
Knee osteoarthritis (OA) exhibits signs of synovial activation in the early phase of the disease (1). There is a correlation between the amount of synovitis and pain (1). Dynamic contrast-enhanced (DCE) MRI provides a more quantitative measurement of the vascular disruption associated with synovitis than techniques currently used in standard clinical practice (2). Synovitis has been successfully measured with DCE-MRI (3). The purpose of this ongoing study is to determine the test-retest repeatability of DCE-MRI in the knee at 3 T in early phase knee OA in different knee regions. This will provide the basis of evaluating potential new treatment options using DCE-MR imaging and enable effect and sample size calculations for further longitudinal and interventional studies.Methods:
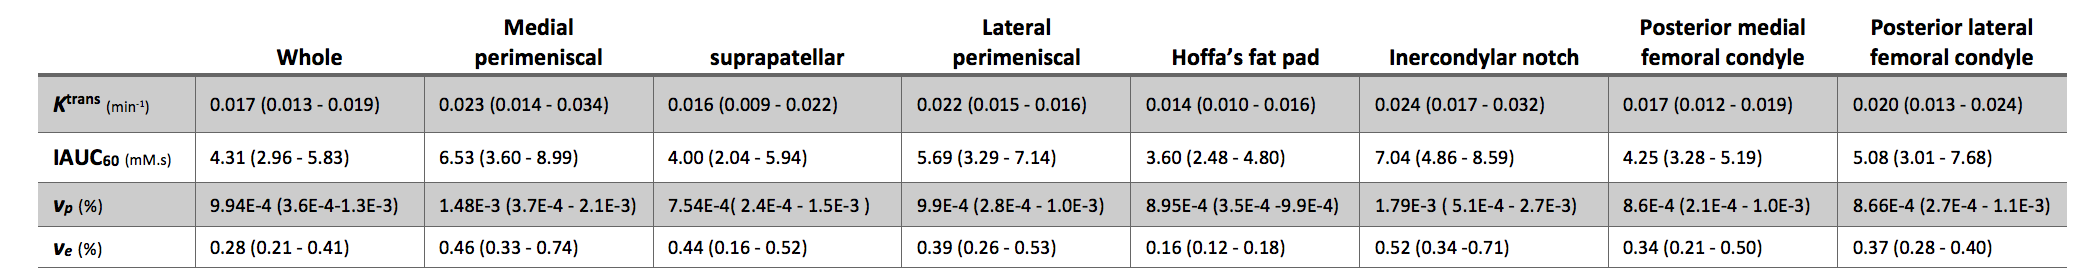
DCE-MR imaging of the knee on 8 patients with mild/moderate knee OA (age range=49-57 years, 4F/4M) was performed with a knee coil (8-channel transmit/receive, Invivo) on a 3 T Discovery MR750 GE scanner. All included subjects had a clinical diagnosis of knee OA as per American College of Rheumatology criteria (4), the two main inclusion criteria were: (i) imaging confirmation of OA radiologically defined as Kellgren-Lawrence grade 2 or 3 (5) and (ii) BMI<35 kg/m2. Each patient was scanned twice, 4 weeks apart. The protocol was based on a 3D sagittal spoiled gradient echo sequence (TR/TE = 3.8/2.4 ms, FOV: 320 mm × 320 mm × 144 mm, special resolution: 0.8 mm × 0.8 mm × 0.5 mm). A total of 3 pre-contrast injection series were obtained with nominal flip angles of 2, 6 and 14 degrees for baseline T1 calculation. A series of 35 consecutive phases formed the DCE-MRI series (temporal resolution: 14 seconds per volume). After the sixth phase, contrast agent (Dotarem (0.4 mL/kg)) was administrated by power injector at the rate of 3 ml/s followed by a 50-ml saline flush. Image acquisition continued during and after contrast administration over approximately 6 minutes. All images were registered together using a nonlinear deformation model with the Advanced Normalization Tools [http://stnava.github.io/ANTs]. Four biomarkers were calculated from the DCE images: Ktrans(min-1), the volume transfer constant for contrast agent (CA) between blood plasma and extravascular extracellular space; vp (%), the blood plasma volume, per unit volume tissue. ve (%), the volume of extravascular extracellular space per unit volume tissue, all estimated using the extended Tofts (6) compartmental model with population arterial function (7); and IAUC60 (mM.s), the initial area under CA concentration curve over 60 s post-arrival in tissue. Manual segmentation to identify structures of interest was performed by a radiologist. Regions of interest (ROIs) included: suprapatellar, Hoffa’s fat pad, intercondylar notch, medial/lateral perimeniscal, posterior medial/lateral femoral condyles. Each biomarker was summarised taking the median over each ROI.Results:
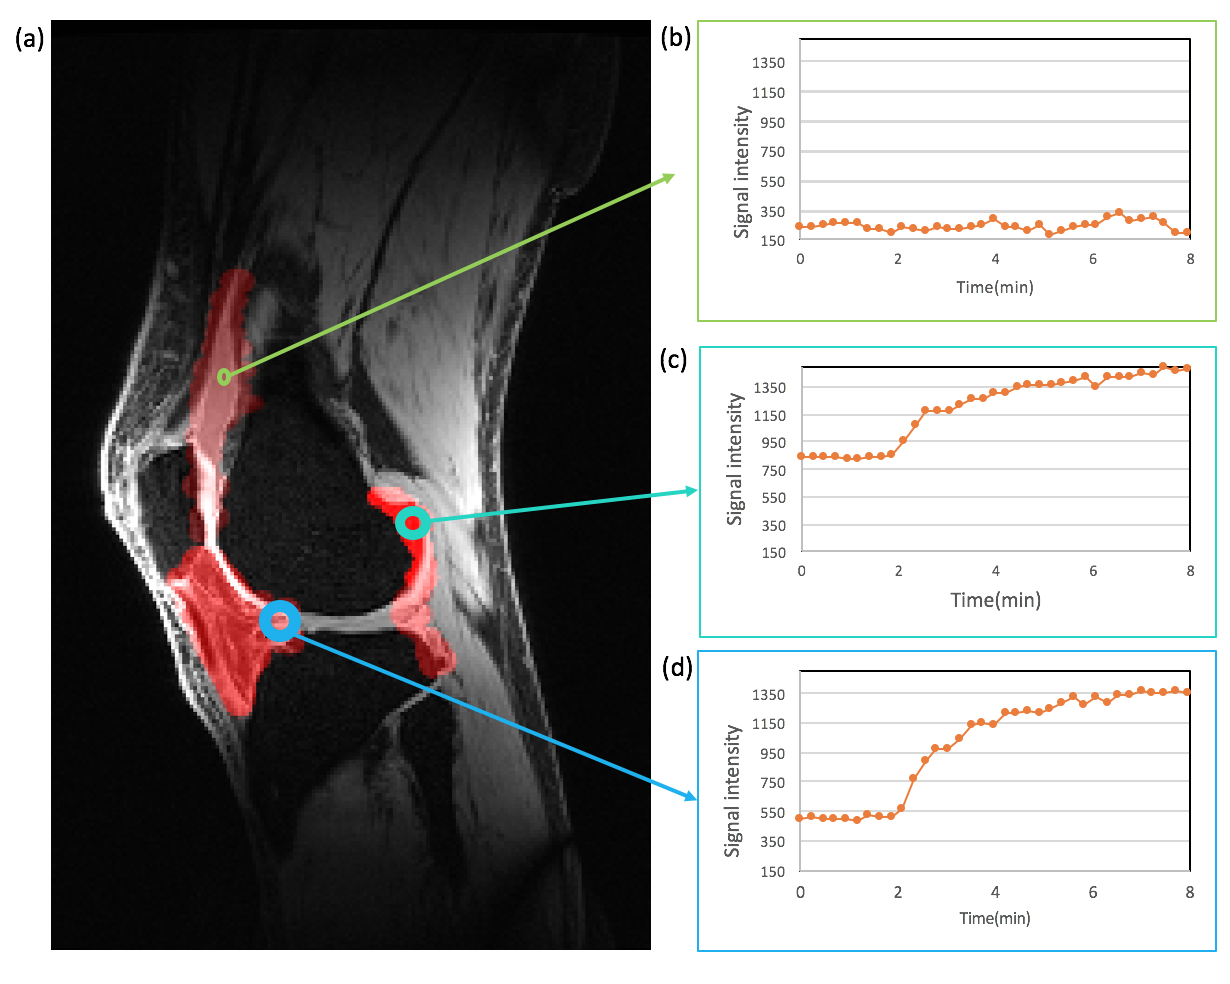
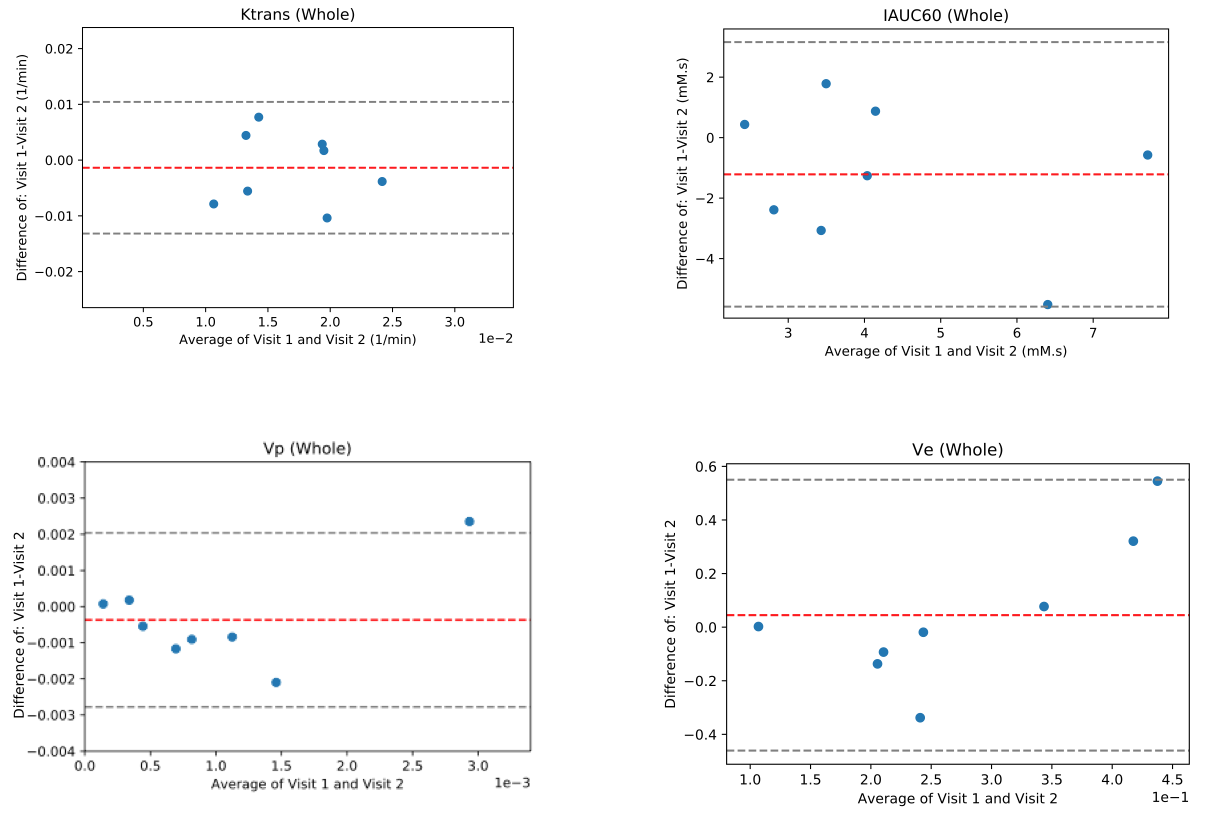
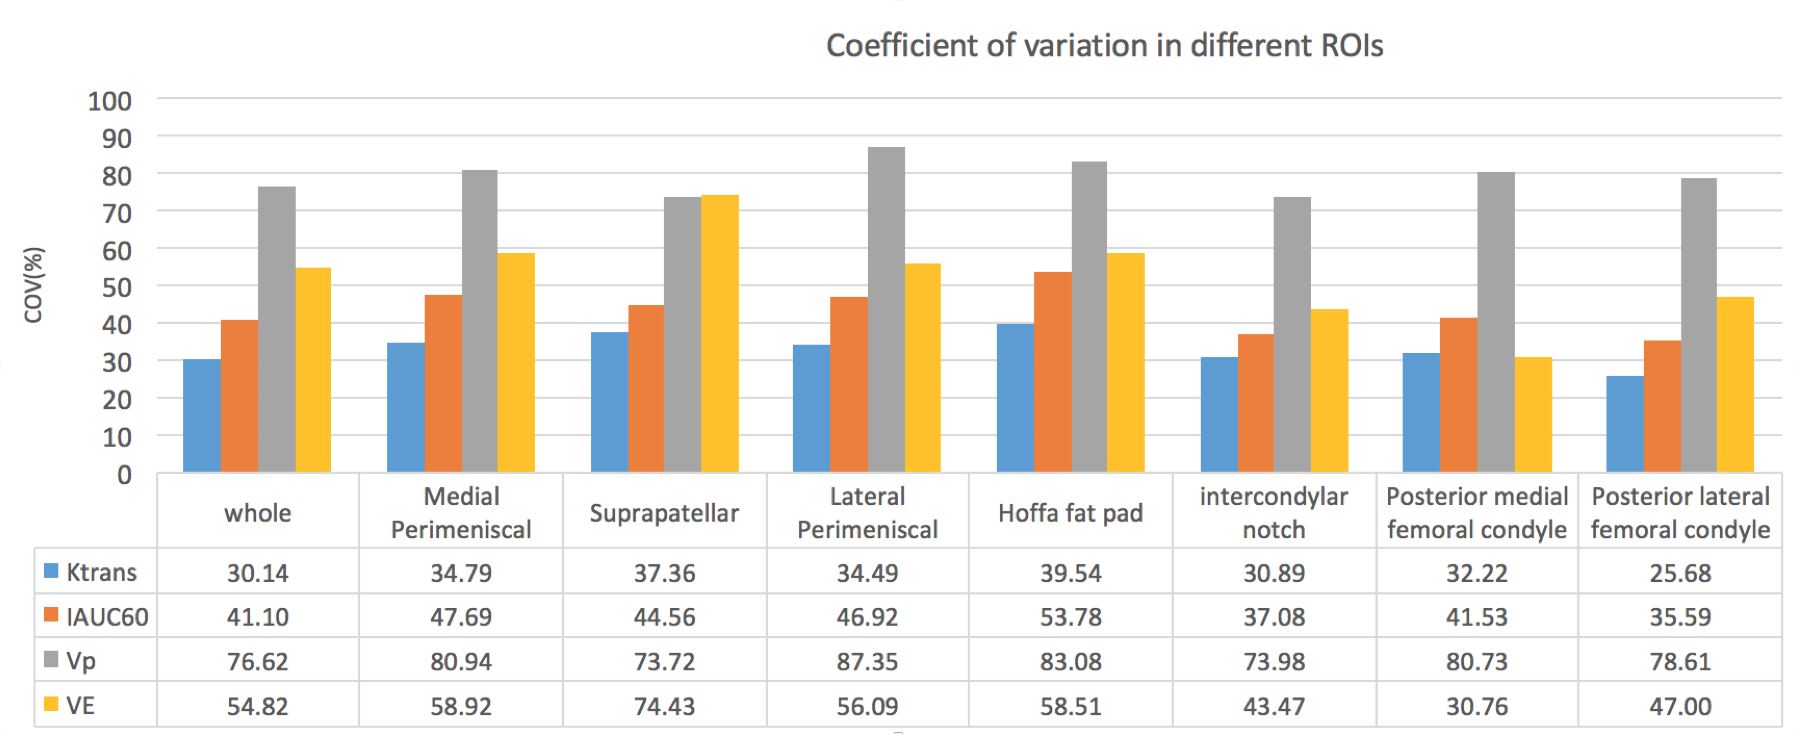
Fig. 1 shows a sample patient’s post contrast image overlaid with the combined segmentation mask and uptake curves in 3 different regions extracted from the DCE image series. The difference in the uptake curves indicates different CA distribution due to different microvascular characteristics. As can be seen in this example, the contrast agent does not penetrate the synovial fluid in this stage of the disease soon after contrast administration. Fig. 2 shows Bland-Altman (8) plots of median Ktrans, IAUC60, vp and ve across a combination of all ROIs. Fig. 3 shows the root mean square coefficient of variation (9) in all segmented regions. In all regions Ktrans has the lowest coefficient of variation (CoV), with the lowest value in the posterior lateral femoral condyle and the highest value in the Hoffa's fat pad. vp has the highest CoV in all regions. Hoffa's fat pad has the highest CoV’s for all biomarkers except vp. A paired t-test was performed on biomarkers in all regions. None showed significant difference between the two visits (P>0.4). Table 1 lists the average value of all visits for each ROI. Different values may reflect the heterogeneous distribution of synovitis in different regions of the knee in OA.Conclusion:
Of the biomarkers assessed, Ktrans appears to have the best one-month repeatability followed by IAUC60, although this varies substantially from region to region. The relatively high CoV values may be explained in part by fluctuation in disease status over the one-month test-retest interval, a phenomenon which is well-recognised clinically, but not captured by traditional OA imaging biomarkers. Some of the variation could also be due to the manually defined ROIs and automated ROI definition could help improve repeatability.Acknowledgements
The research team acknowledges the support of the National Institute for Health Research Cambridge Biomedical Research Centre. This was a University of Cambridge sponsored study with funding provided by GlaxoSmithKline.References
1. Roemer F.W., Kassim Javaid M., Guermazi A., et al. “Anatomical distribution of synovitis in knee osteoarthritis and its association with joint effusion assessed on non-enhanced and contrast-enhanced MRI”. Osteoarthr. Cartil.;2010(18);1269-1274.
2. Wenham, C. Y. J. et al. The responsiveness of novel, dynamic, contrast-enhanced magnetic resonance measures of total knee synovitis after intra-articular corticosteroid for painful osteoarthritis. Osteoarthr. Cartil.; 2014(22); 1614–1618.
3. Gait AD, Hodgson R, Parkes MJ, et al. Synovial volume vs synovial measurements from dynamic contrast enhanced MRI as measures of response in osteoarthritis. Osteoarthr. Cartil.;2016(24);1392-1398.
4. Altman, R. et al. Development of criteria for the classification and reporting of osteoarthritis. Classification of osteoarthritis of the knee. Diagnostic and Therapeutic Criteria Committee of the American Rheumatism Association. Arthritis Rheum.;1986(29); 1039–1049.
5. Kellgren, J. H., and J. S. Lawrence. "Radiological assessment of osteo-arthrosis." Annals of the rheumatic diseases.;1957;494.
6. Tofts PS, Brix G, Buckley DL et al. Estimating kinetic parameters from dynamic contrast-enhanced T1 weighted MRI of a diffusable tracer: standardized quantities and symbols. J Magn Reson Imaging.;1999(10);223–232.
7. Parker, Geoff JM, et al. "Experimentally‐derived functional form for a population‐averaged high‐temporal‐resolution arterial input function for dynamic contrast‐enhanced MRI." Magnetic resonance in medicine.;2006(56):993-1000.
8. Bland, J. Martin, and Douglas G. Altman. "Measuring agreement in method comparison studies." Statistical methods in medical research.; 1999(8); 135-160.
9. Glüer, C. C. et al. Accurate assessment of precision errors: how to measure the reproducibility of bone densitometry techniques. Osteoporos Int.;1995(5);262–270.
Figures