1411
Multi-Parametric MRI characterization for damaged dystrophic muscle1Radiology, University of Washington, Seattle, WA, United States, 2Neurology, University of Washington, Seattle, WA, United States, 3Senator Paul D. Wellstone Muscular Dystrophy Cooperative Research Center, Seattle, WA, United States
Synopsis
Muscular dystrophy is a family of inherited diseases characterized by progressive muscle weakness that leads to muscle damage and wasting. Clinical measures of muscular dystrophy rely on surgical biopsy, which is invasive and limited. Magnetic resonance imaging (MRI) can provide valuable information pertaining to tissue characteristics of this disease noninvasively. We performed multi-parametric MRI to assess the changes due to muscle damage and subsequent recovery over 3 weeks starting at 12 weeks of age in disease affected mice. The differences observed through MRI measurements demonstrate MRI can be used effectively to track disease progression and responses to future therapy.
Purpose
Duchenne muscular dystrophy (DMD) is the most prevalent forms of muscular dystrophy affecting approximately 1 in every 3600 male infants with an average life expectancy of 25 years.1,2 Advancements in gene therapy may provide relief and future treatment options for the muscular dystrophy pathologies. Regardless of the therapy model, historically, assessment of the tissue characteristics has been done by surgical biopsy which is limited by the narrow regions of sampling and need for tissue recovery. The emergence of multi-parametric Magnetic Resonance Imaging (MRI) has provided a non-invasive alternative for gathering tissue information without the same limitations.3 Understanding of the biomarkers present during pathology and treatment response can provide important information in future studies of treatment. The goal of this study was to evaluate, characterize, and compare changes in muscle tissue characteristics in both mdx and normal mice using MRI to better understand: the effects of damage to the muscle, the changes during muscle recovery, and to set a potential therapy plan exploring the possibility of better treatment outcomes.Methods
45 B6Ros.Cg-Dmdmdx-4Cv/J (abbreviated mdx4cv or mdx) mice along with 5 age matched normal C57BL/6J mice were imaged beginning at 12 weeks of age for this study. All mice were injected with 50 mL of 0.125 M myotoxin (BaCl2) in the anterior compartment of their right hindlimb targeting the tibialis anterior muscle (TA). Additionally, all mice were injected with 50 mL of saline in their left hindlimb (also targeting the TA muscle) to serve as a control. Five of the mdx mice, along with the 5 age-matched normal controls, were imaged longitudinally beginning on the day of injection with follow-up imaging at: 2, 3, 5, 7, 14, and 21 days post injection. The remaining 40 mdx mice were injected and imaged for a single timing point to provide histology results for each timing point. The mice were imaged on a Bruker 14T Avance MR spectrometer (Bruker Corp., Billerica, MA). The high resolution MRI protocol includes scout imaging (gradient echo; TR (repetition time)/TE (echo time) = 100/3.42 ms), planning for image planes (multi-slice RARE (rapid acquisition with refocused echoes): TR/TE = 667.54/4.47 ms), high resolution 2 dimensional imaging with 55 thin slices (200 micron thick) (multi-slice RARE: TE/TE = 5031.363/10 ms) for muscle volume evaluation, multi-slice images with refocused echoes for T1 measurements (TR/TE = 5500, 3000, 1500, 1000, 385.8/9.66), multi-slice multi-echo imaging (TR/TE = 4000/6.28 – 75.4 ms, 12 echoes with 6.28 ms spacing) for transverse relaxation time T2 measurements, magnetization transfer (MT) imaging (gradient echo; TR/TE = 938.94/2.28 ms, flip angle = 30°), diffusion imaging with a b values of 1000 s/mm2 sequence (TR/TE = 3751/27.5 ms). All mice were euthanized at the completion of imaging with the leg tissues harvested for histology.Results and Discussion
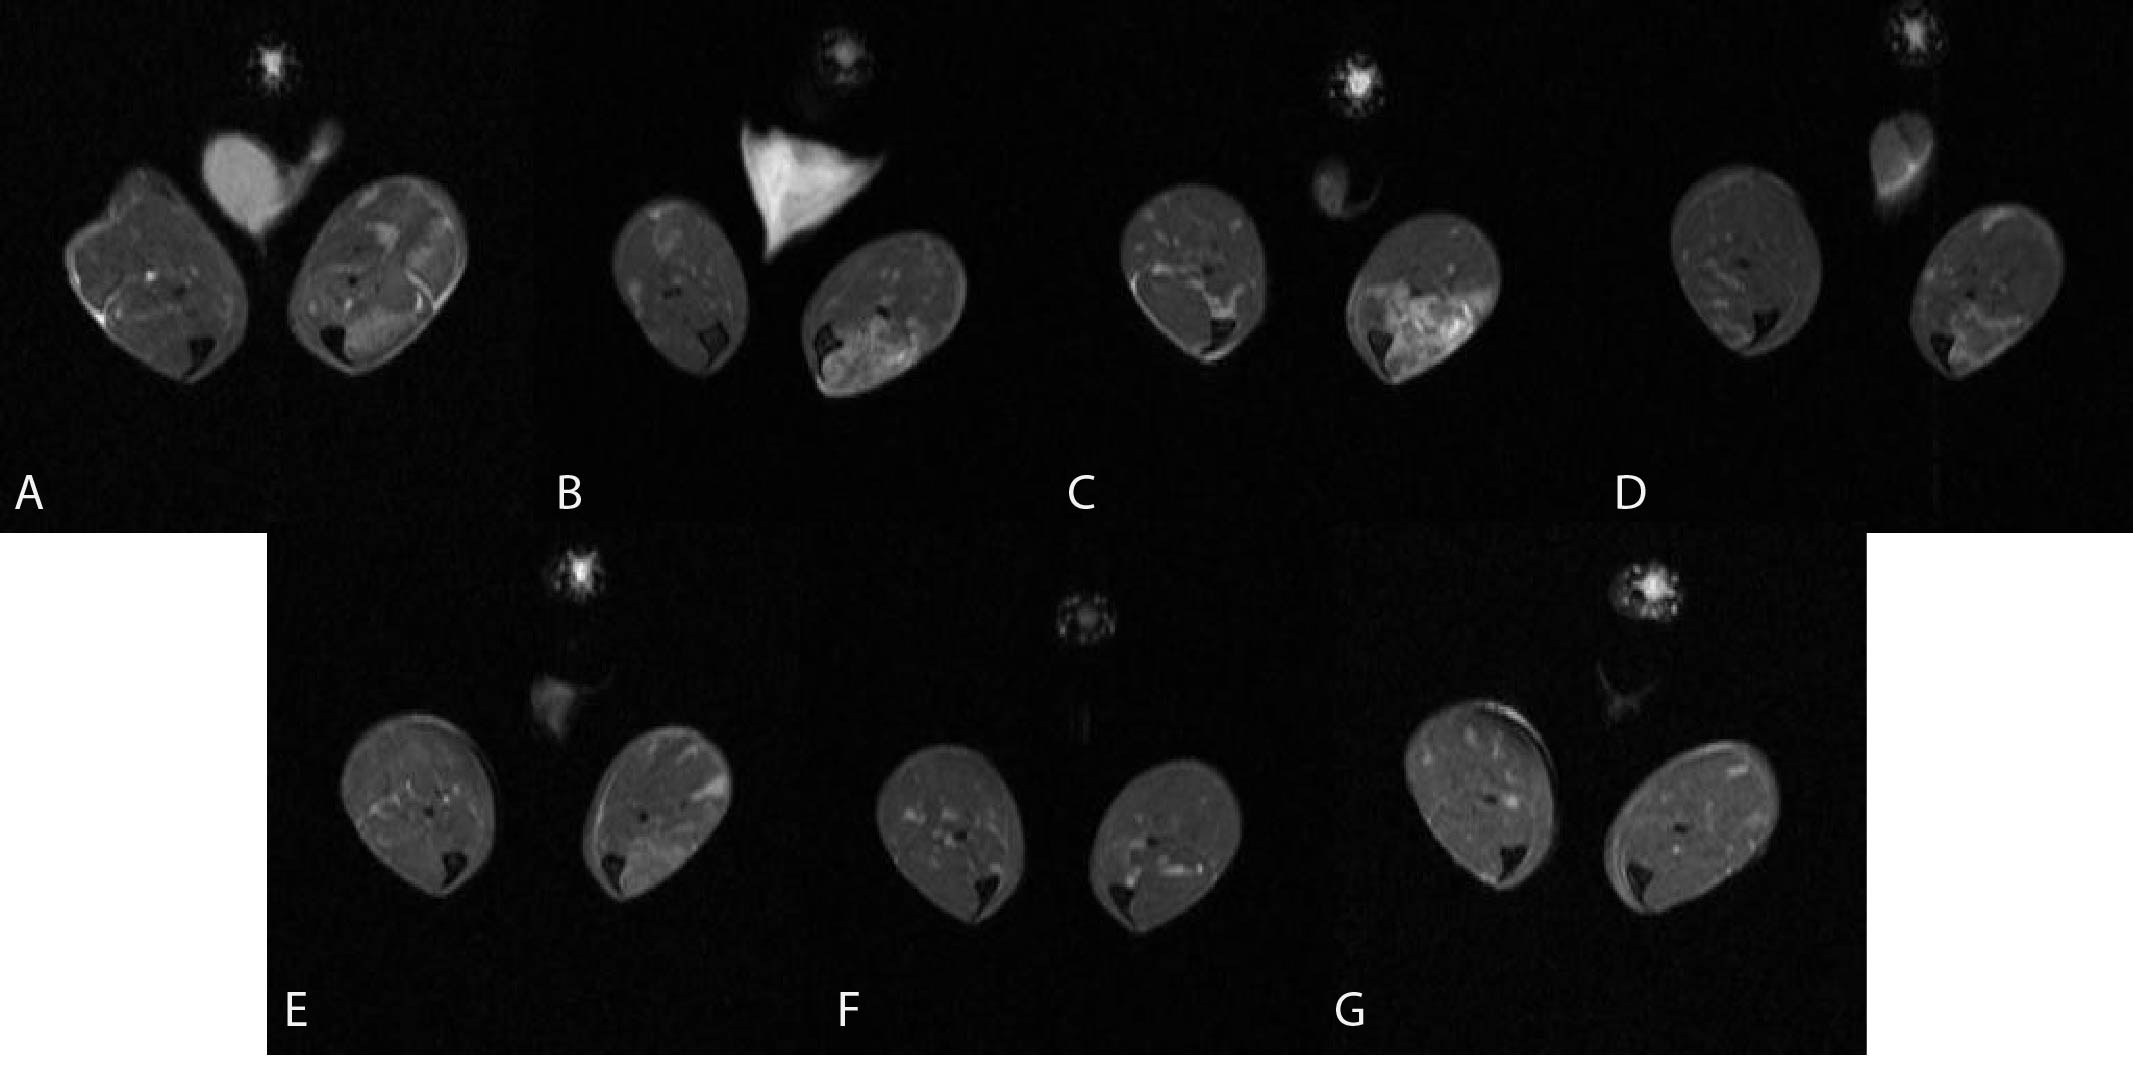
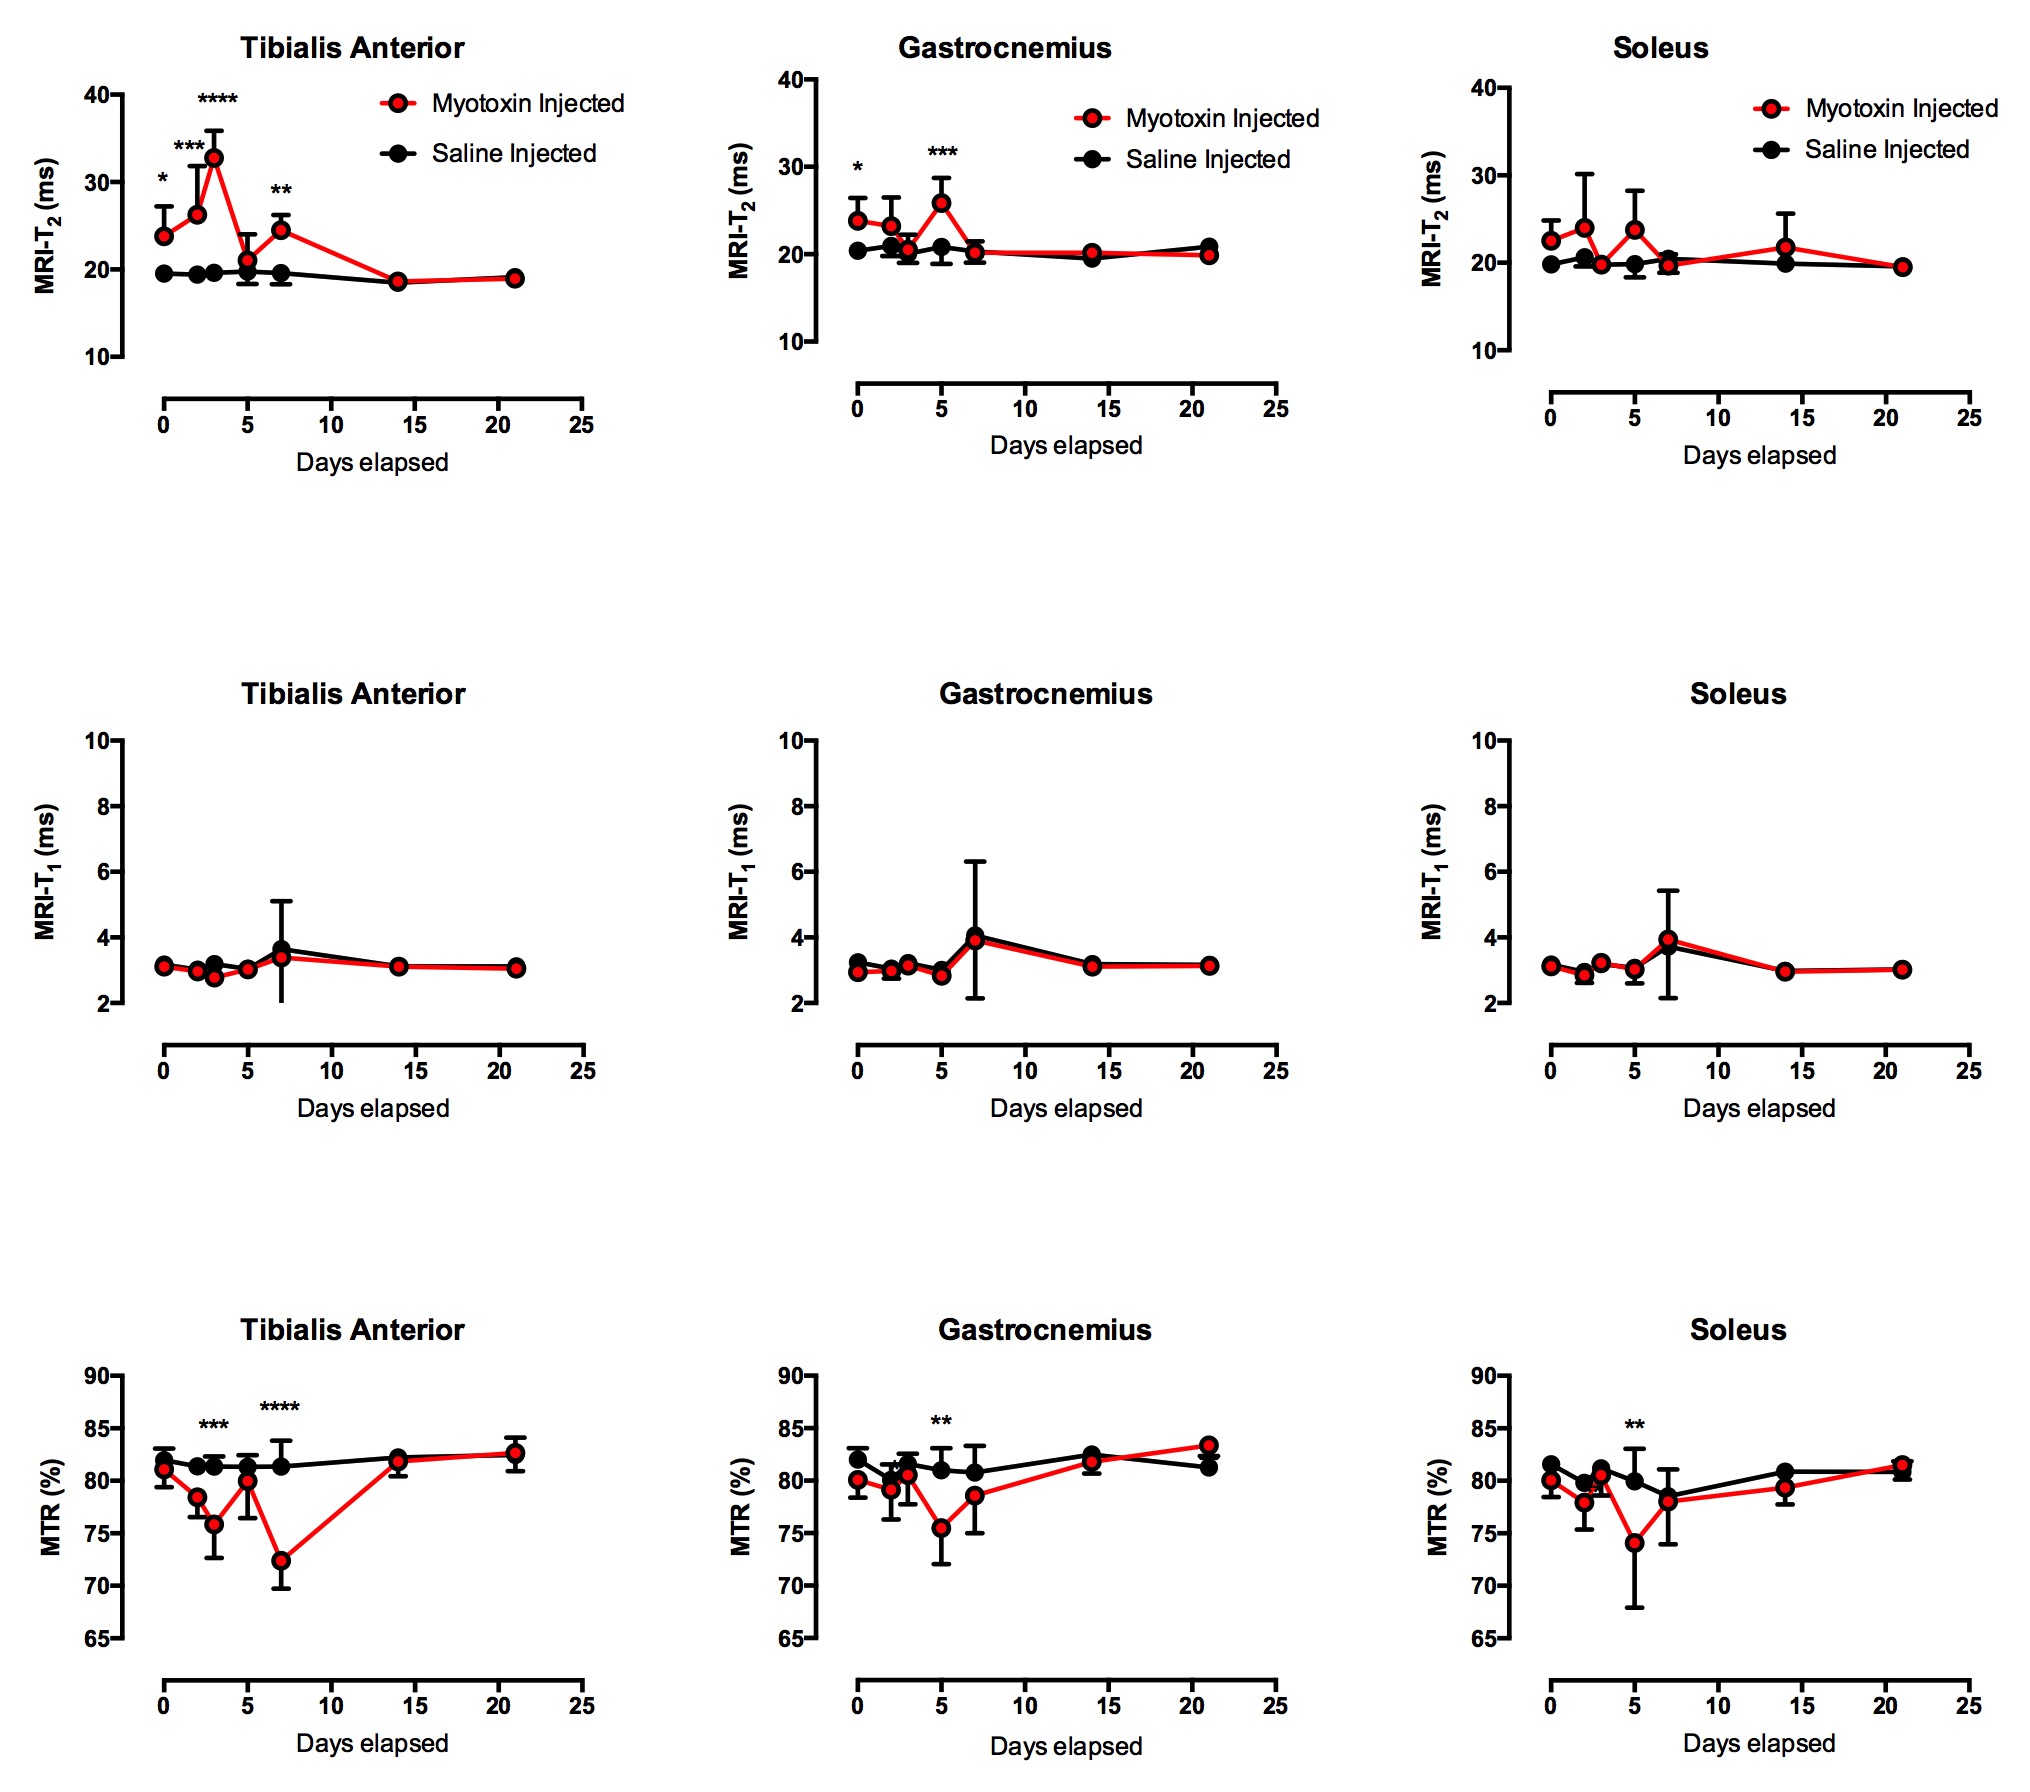
The measurements of the tibialis anterior (TA) and gastronemius (GA) muscles showed significant differences in the T2 when comparing the myotoxin injected leg of the mdx group against the saline control injected leg (Figure 1) – the TA showed significant differences for the post injection, 2, 3, and 7 day post injection timing points (e.g. 23.8 ± 3.4 vs 19.5 ± 0.73 post injection) while the GA showed significant differences at the post injection and 5 days post injection timing points (e.g. 23.8 ± 2.6 vs 20.4 ± 0.4 post injection). All three imaging modalities of T2, T1, and magnetization transfer ratio (MTR) showed the myotoxin-injected mdx muscle returning to similar baseline values of saline-injected muscle by the end of 21 days with the bulk of the recovery occurring within 7 days (Figure 2). T2 continues to show the most sensitivity in preclinical models of DMD.3-5 MTR has been shown to increase when there is an increase in fibrotic content (in the mdx mouse model, fibrosis typically does not occur until very late stages of life) but decrease in the presence of myopathic processes.6 Additional fiber analysis and histology, alongside comparisons to the normal control muscle injected with the myotoxin, may provide increased understanding of the relationship between changes in T2, radial diffusivity, and MTR and their relationships to the regenerative and recovery processes of the affected skeletal muscle.Conclusions
The multi-parametric MRI demonstrated that even between the two differing injections in the mdx mice, there were quantifiable differences that could be identified and monitored. Similar MRI protocols could be explored and utilized as a noninvasive means of tracking disease progression and treatment response in future clinical trials of muscular dystrophy treatment.Acknowledgements
No acknowledgement found.References
1. Emery AE. The muscular dystrophies. Lancet. 2002;359(9307):687–95.
2. Rall S, Grimm T. Survival in Duchenne muscular dystrophy. Acta myologica: myopathies and cardiomyopathies: official journal of the Mediterranean Society of Myology / edited by the Gaetano Conte Academy for the study of striated muscle diseases. 2012;31(2):117–20.
3. Park J, Wicki J, Knoblaugh SE, Chamberlain JS, Lee D. Multi-Parametric MRI at 14T for Muscular Dystrophy Mice Treated with AAV Vector-Mediated Gene Therapy. PLoS ONE 2015 10(4): e0124914
4. Vohra RS, Mathur S, Bryant ND, Forbes SC, Vandenborne K, Walter GA. Age-related T2 changes in hindlimb muscles of mdx mice. Muscle Nerve. 2016;53(1):84-90. doi: 10.1002/mus.24675. PubMed PMID: 25846867; PubMed Central PMCID: PMCPMC4600631.
5. Feng S, Chen D, Kushmerick M, Lee D. Multiparameter MRI analysis of the time course of induced muscle damage and regeneration. J Magn Reson Imaging. 2014;40(4):779-88. doi: 10.1002/jmri.24417. PubMed PMID: 24923472; PubMed Central PMCID: PMCPMC4059785.
6. McDaniel, J.D., et al., Magnetization transfer imaging of skeletal muscle in autosomal recessive limb girdle muscular dystrophy. J Comput Assist Tomogr, 1999. 23(4): p. 609-14.
Figures