1409
Assessment of perfusion-metabolism matching in exercising muscle from dynamic contrast-enhanced MRI and T2 mappingGwenael Layec1, christopher Conlin2, Jiawei Dong2, Stephen Decker3, Corey R Hart3, Nan Hu2, Mariya A Chadovich2, Michelle A Mueller2, Lillian Khor3, Christopher Hanrahan2, Vivian S Lee2, and Jeff L Zhang2
1VA Medical Center GRECC 182, 1D23A 500 Foothill Drive, University of Utah, Salt Lake City, UT, United States, 2Radiology, University of Utah, Salt Lake City, UT, United States, 3University of Utah, Salt Lake City, UT, United States
Synopsis
Using an MR approach combining DCE-MRI and T2 mapping, this study revealed that unlike PAD patients, muscle tissue perfusion was tightly correlated to exercise-induced changes in R2 in the lower leg muscles of healthy individuals. These findings suggest Q/Met mismatch following exercise in the skeletal muscle of PAD patients. The combination of DCE-MRI and T2 mapping opens a new avenue of research to investigate perfusion-metabolism heterogeneity in normal physiological conditions and muscle-related pathologies.
Introduction
During exercise, a fundamental function of the cardiovascular system is to supply O2 to the active muscles to meet metabolic demand. Skeletal muscle perfusion is therefore thought to be tightly coordinated with O2 requirements among and within muscles. This balance between muscle O2 delivery and metabolism is critical as it sets the driving pressure for blood-myocyte O2 flux and influences the control of mitochondrial respiration. However, in some pathological conditions, this perfusion-metabolism (Q/Met) matching may be compromised and results in muscle weakness and exercise intolerance (2). Despite the potential importance of Q/Met in underlying functional muscle abnormalities seen with aging and other muscle related pathologies (1, 4), there is a paucity of information on the spatial matching of Q/Met in human. The lack of standard in vivo techniques to characterize Q/Met in humans is probably the major culprit responsible for this gap in our knowledge. Therefore, the purpose of this study was to assess Q/Met in the lower leg muscles of healthy subjects and patients with peripheral arterial disease (PAD) using dynamic contrast-enhanced (DCE) MRI for tissue perfusion combined with T2 mapping to determine the degree of metabolic demand (5).Methods
Nine healthy control subjects performed constant-load dynamic sub-maximal plantar flexion at 5.4 watts for 3 min (frequency of 1 Hz) in the whole body 3T MRI scanner (TimTrio; Siemens) using a 4-channel flex coil wrapped around the calf for image acquisition. With a similar set-up, a second group of 4 patients with PAD performed constant-load dynamic sub-maximal plantar flexion at 2.7 watts for 3 min and a graded exercise to exhaustion. At the end of exercise, 0.05 mmol/kg gadoteridol (Prohance; Bracco) was injected intravenously at a rate of 5 mL/s, and dynamic imaging was continuously recorded for 4 minutes. The dynamic images were acquired from an axial slice through the greatest circumference of the calf, using a 2D saturation-recovery turboFLASH sequence (7) (delay-time: 300 ms, TR: 527ms, TE: 1.42ms, flip-angle: 15°, slice thickness: 10mm, matrix: 128×128, FOV: 160×160mm, temporal resolution: 1 s/frame). To quantify gadolinium concentration from the dynamic images, proton density was measured from the same slice using the same pulse sequence and TR of 4000ms. T2 maps were obtained using a single-slice 2D turbo spin echo (field of view: 160x160mm, matrix size: 192x192, repetition time (TR): 1000ms, echo times (TEs): 6, 30, 54, 78, 103, 127ms, flip angle: 120degrees). For perfusion analysis, an arterial input function (AIF) was manually sampled from the anterior tibial or peroneal artery visible in the imaged slice. Voxel-wise perfusion was then calculated by fitting the contrast enhancement curve of each muscle voxel with a tracer-kinetic model that expresses the muscle gadolinium-concentration as a convolution of the AIF and the muscle’s impulse retention function (3, 6, 8). T2 decay was fitted using a mono-exponential function and R2 was calculated as 1/T2. For each map, regions of interest were manually defined to compute the average perfusion of the medial and lateral gastrocnemius (MG and LG), soleus (S), anterior and posterior tibialis (AT and PT), and peroneus longus (Per) muscles. Pearson’s correlation coefficients were calculated to assess the relationship between perfusion and R2.Results
Representative maps of the tissue perfusion and muscle activation measured by DCE-MRI and T2 mapping are presented in Figure 1. Table 1 summarizes tissue perfusion and R2 values of the individual muscles for both groups. Within each subject, R2 was significantly correlated to tissue perfusion in healthy subjects (r = 0.73 ± 0.16) whereas these parameters were not significantly related in patients with PAD (r = 0.02 ± 0.46).Discussion-Conclusion
Using an MR approach combining DCE-MRI and T2 mapping, this study sought to examine perfusion-metabolism matching in the skeletal muscle of healthy individuals and patients with PAD following plantar flexion exercise. The main findings of this study were that 1) exercise-induced changes in R2 for each individual muscle of the lower leg were not significantly different between groups, indicative of similar muscle activation and metabolic demand in healthy subjects and PAD patients, 2) in contrast, tissue perfusion was significantly higher in the healthy subjects compared to PAD patients, and 3) unlike PAD patients, muscle tissue perfusion was tightly correlated to exercise-induced changes in R2 in the lower leg muscles of healthy individuals. Together, these findings suggest Q/Met mismatch following exercise in the skeletal muscle of PAD patients, which was revealed using a unique combination of DCE-MRI and T2 mapping. This novel MR approach open a new avenue of research to investigate perfusion-metabolism heterogeneity in normal physiological conditions and muscle-related pathologies.Acknowledgements
This work was funded in part by grants from the Flight Attendant Medical Research Institute (FAMRI) and NIH National Heart, Lung, and Blood Institute (K99HL125756)References
1. Anderson JD, Epstein FH, Meyer CH, Hagspiel KD, Wang H, Berr SS, Harthun NL, Weltman A, Dimaria JM, West AM, and Kramer CM. Multifactorial determinants of functional capacity in peripheral arterial disease: uncoupling of calf muscle perfusion and metabolism. Journal of the American College of Cardiology 54: 628-635, 2009. 2. Cano I, Roca J, and Wagner PD. Effects of lung ventilation-perfusion and muscle metabolism-perfusion heterogeneities on maximal O2 transport and utilization. The Journal of physiology 593: 1841-1856, 2015. 3. Dennis Cheong LH, Markus Tan CK, Koh TS, Tchoyoson Lim CC, and Bisdas S. Functional Imaging: Dynamic Contrast-Enhanced CT using a Distributed-Parameter Physiologic Model for Accessing Stroke and Intracranial Tumor. Conference proceedings : Annual International Conference of the IEEE Engineering in Medicine and Biology Society IEEE Engineering in Medicine and Biology Society Annual Conference 1: 294-297, 2005. 4. Musch TI, Eklund KE, Hageman KS, and Poole DC. Altered regional blood flow responses to submaximal exercise in older rats. J Appl Physiol 96: 81-88, 2004. 5. Prior BM, Ploutz-Snyder LL, Cooper TG, and Meyer RA. Fiber type and metabolic dependence of T2 increases in stimulated rat muscles. J Appl Physiol (1985) 90: 615-623, 2001. 6. St Lawrence KS, and Lee TY. An adiabatic approximation to the tissue homogeneity model for water exchange in the brain: II. Experimental validation. J Cereb Blood Flow Metab 18: 1378-1385, 1998. 7. Vivier PH, Storey P, Rusinek H, Zhang JL, Yamamoto A, Tantillo K, Khan U, Lim RP, Babb JS, John D, Teperman LW, Chandarana H, Friedman K, Benstein JA, Skolnik EY, and Lee VS. Kidney function: glomerular filtration rate measurement with MR renography in patients with cirrhosis. Radiology 259: 462-470, 2011. 8. Zhang JL, Rusinek H, Bokacheva L, Lerman LO, Chen Q, Prince C, Oesingmann N, Song T, and Lee VS. Functional assessment of the kidney from magnetic resonance and computed tomography renography: impulse retention approach to a multicompartment model. Magn Reson Med 59: 278-288, 2008.Figures
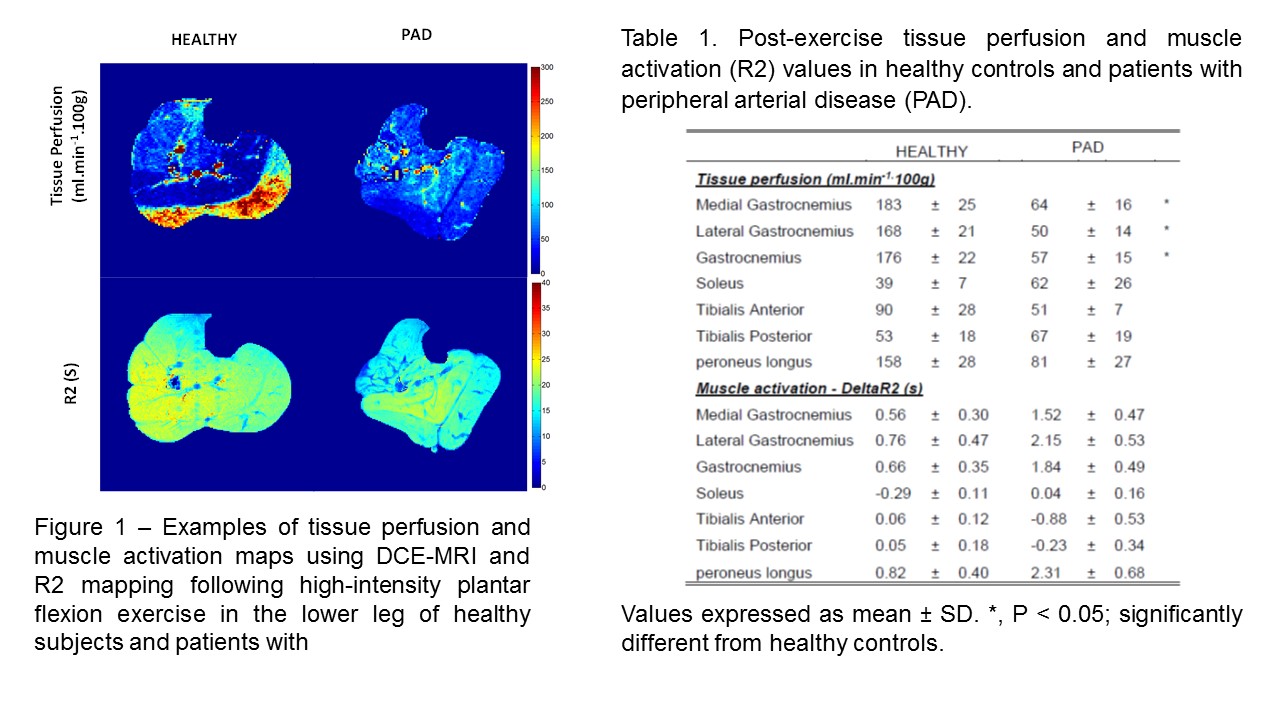
Figure1
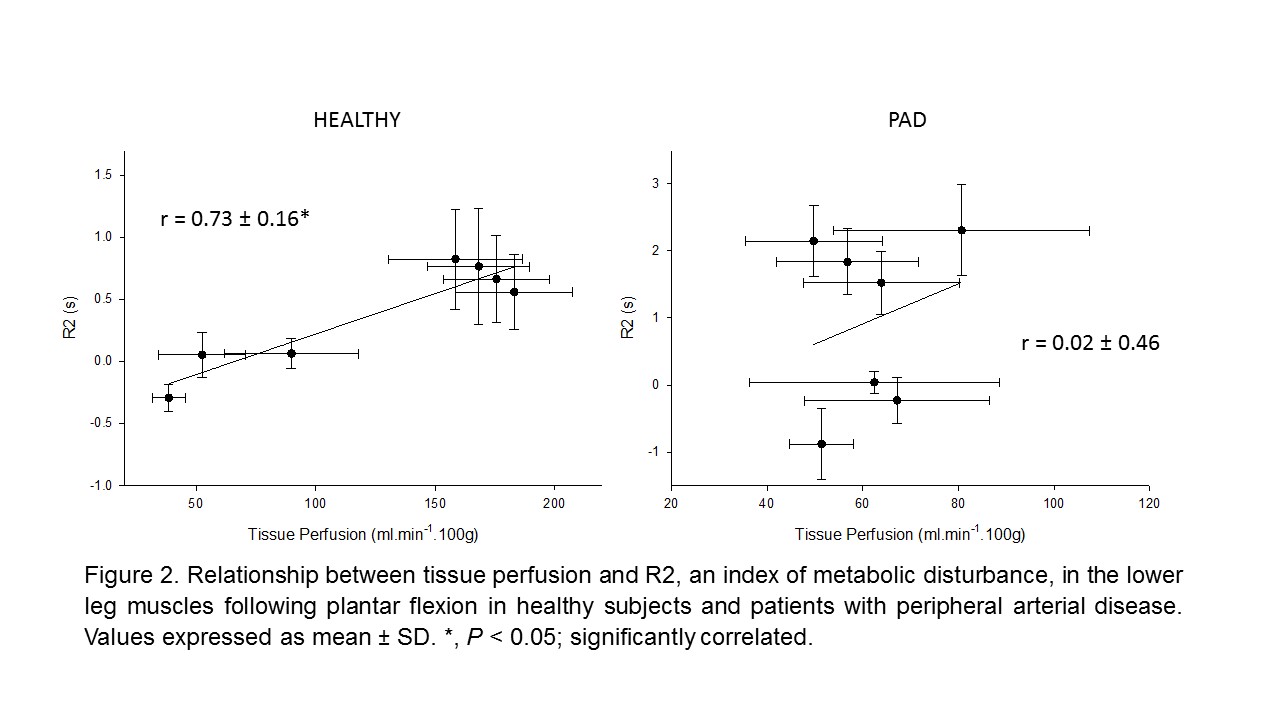
Figure 2