1408
Sensitivity of Quantitative Texture Metrics to Variations in Image Acquisition Parameters1Vanderbilt University School of Medicine, Nashville, TN, United States, 2Vanderbilt University, Nashville, TN, United States
Synopsis
The purpose of this study was to examine the dependence of a quantitative texture metric, the high gray level run length emphasis (HGRE) in T2-weighted images, on common variations in image acquisition parameters. We studied 13 muscle disease patients with quantitative fat/water MRI and contrast-based images. The ability of the HGRE was unaffected by image matrix size. We also measured the dependence of the regression parameters on TR and TE. The results support the use of quantitative texture analysis to study clinically acquired MR images in muscle disease patients.
Target Audience
Muscle physiologists, clinicians, and imaging scientists interested in muscle fat/water MRIIntroduction
Fat tissue infiltration is a common pathological feature of muscle disease. Its gold standard for MRI quantitation is fat-water MRI (FWMRI). Fat tissue is also detectable using standard contrast-based clinical MRI sequences. Texture analysis is a quantitative method for analyzing signal variations in contrast-based images and may allow researchers to analyze clinically obtained images quantitatively. The goals of this study were to determine the sensitivity of the high gray-level run length emphasis (HGRE), derived from the Gray Level Run-length Matrix (GLRM) (1), to image acquisition parameters commonly varied in clinical settings (voxel size and TR/TE).Methods
Five patients with dermatomyositis and eight patients with polymyositis were included in these analyses. Axial images were obtained at the mid-thigh using a 3T Philips Achieva MR imager/spectrometer over a field of view of 256´256 mm. FWMRI was performed using a 2D multi-slice, six-echo gradient-echo sequence with TR/ TE1/ΔTE =75.00/1.34/1.53 ms; matrix, 256´256; and a=22°. Multiple spin-echo data images were acquired using TR/TE=4000/{14, 28, 42…280} ms and matrix, 128´128. Inversion recovery data were acquired with TD/TI=1500/{50,100,200,500,1000,2000, and 6000} ms and matrix, 128´128. T1-weighted and T2-weighted anatomical images were acquired with a turbo-spin-echo sequence; TR/TE=530/6.2 ms and 3000/100 ms, respectively; and matrix, 512´512. A B1 map was also acquired.
To vary the matrix size, the 512x512 T2-weighted image was resized to 384x384 and 256x256. To vary contrast properties, images were resized, as necessary, to 128x128. An image was synthesized using the desired TR/TE values, spin-echo signal equation, and the T1, T2, and B1 maps. Fig. 1A shows a synthetic image with TR/TE=530/6.2 ms. The regression between the pixel-wise signal intensities in the synthetic image and resized T2-weighted image (Fig. 1B) was calculated (Fig. 1C). Finally, the regression equation was applied to the 512x512 T2-weighted image to synthesize a 512x512 image at the desired TR/TE (Fig. 1D). Figure 1E shows the acquired T1-weighted image. This analysis was repeated at all combinations of TR values ranging from 250-6000 ms (steps of 500 ms) and TE values ranging from 5-125 ms (steps of 10 ms).
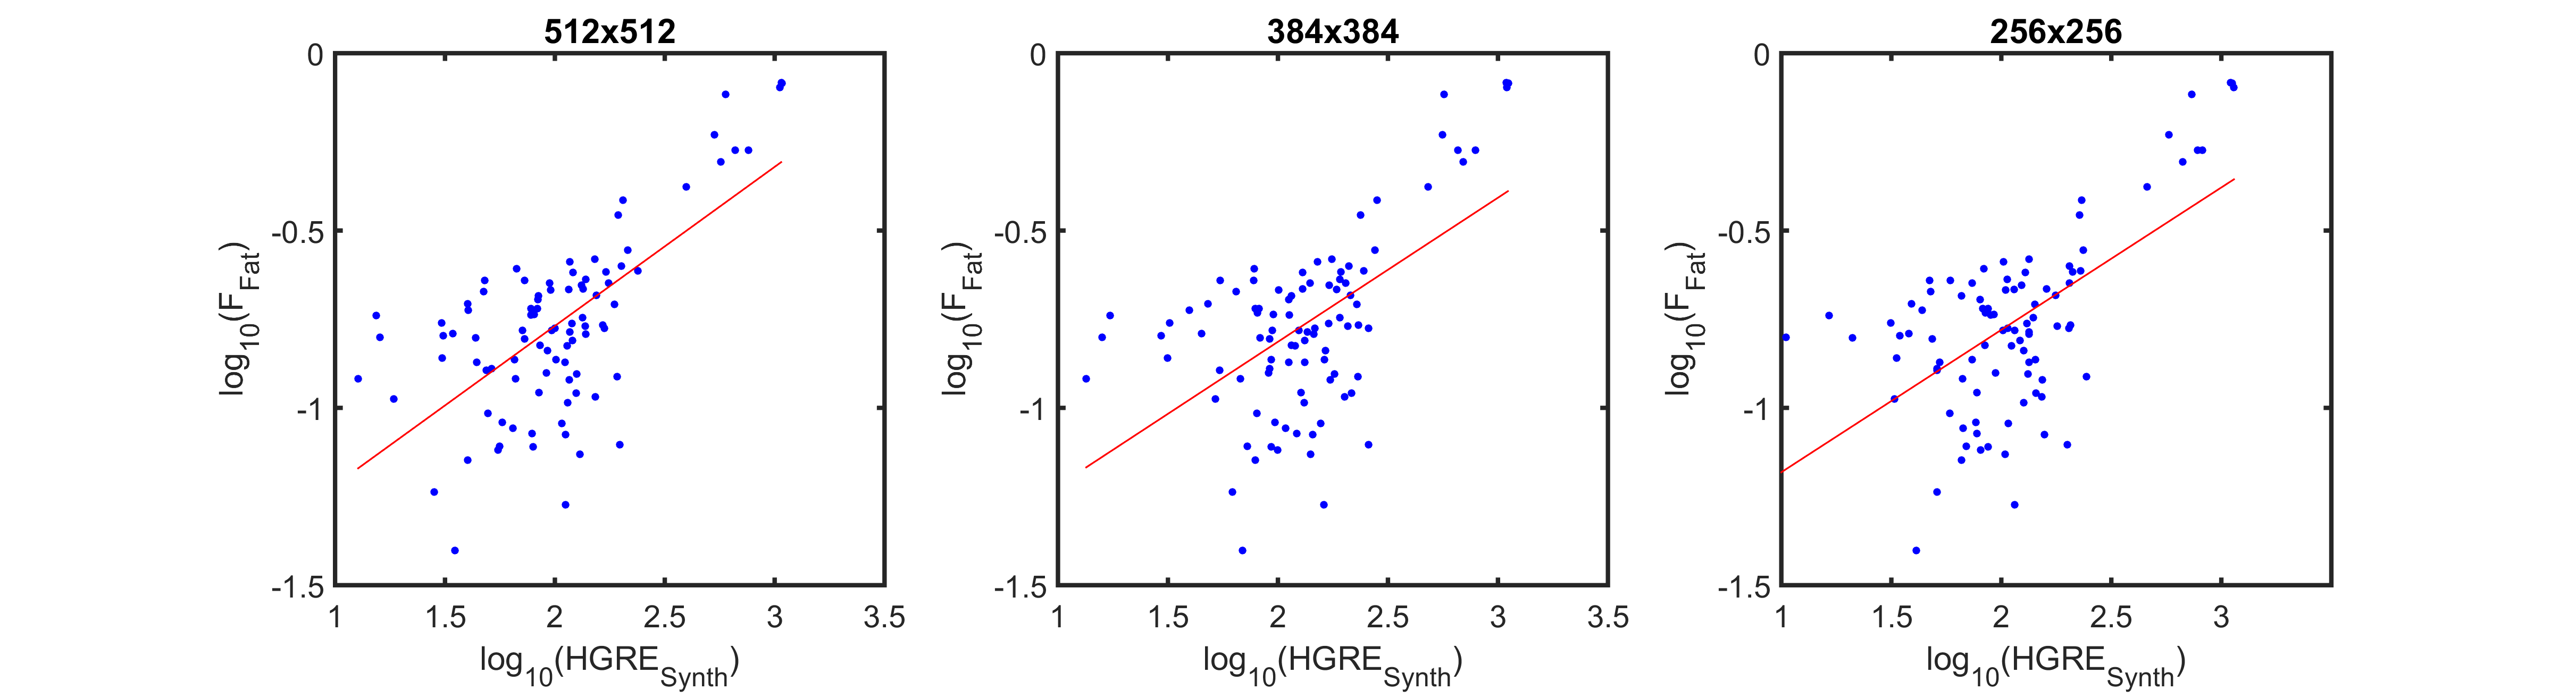
In each image, regions of interest (ROIs) were defined in eight muscles of the thigh. The HGRE and mean fat fraction (FFat) were calculated in each ROI. To test the effect of matrix size on the ability to predict FFat from HGRE, the linear regression of FFat on HGRE was calculated for 1) the original images and 2) the resized images. Log transforms were used to account for non-normal distributions. To test the effect of TR/TE on the ability to predict FFat from HGRE, the linear regression of FFat on HGRE was calculated for for each TR/TE combination. Statistical significance was accepted at p<0.05.
Results
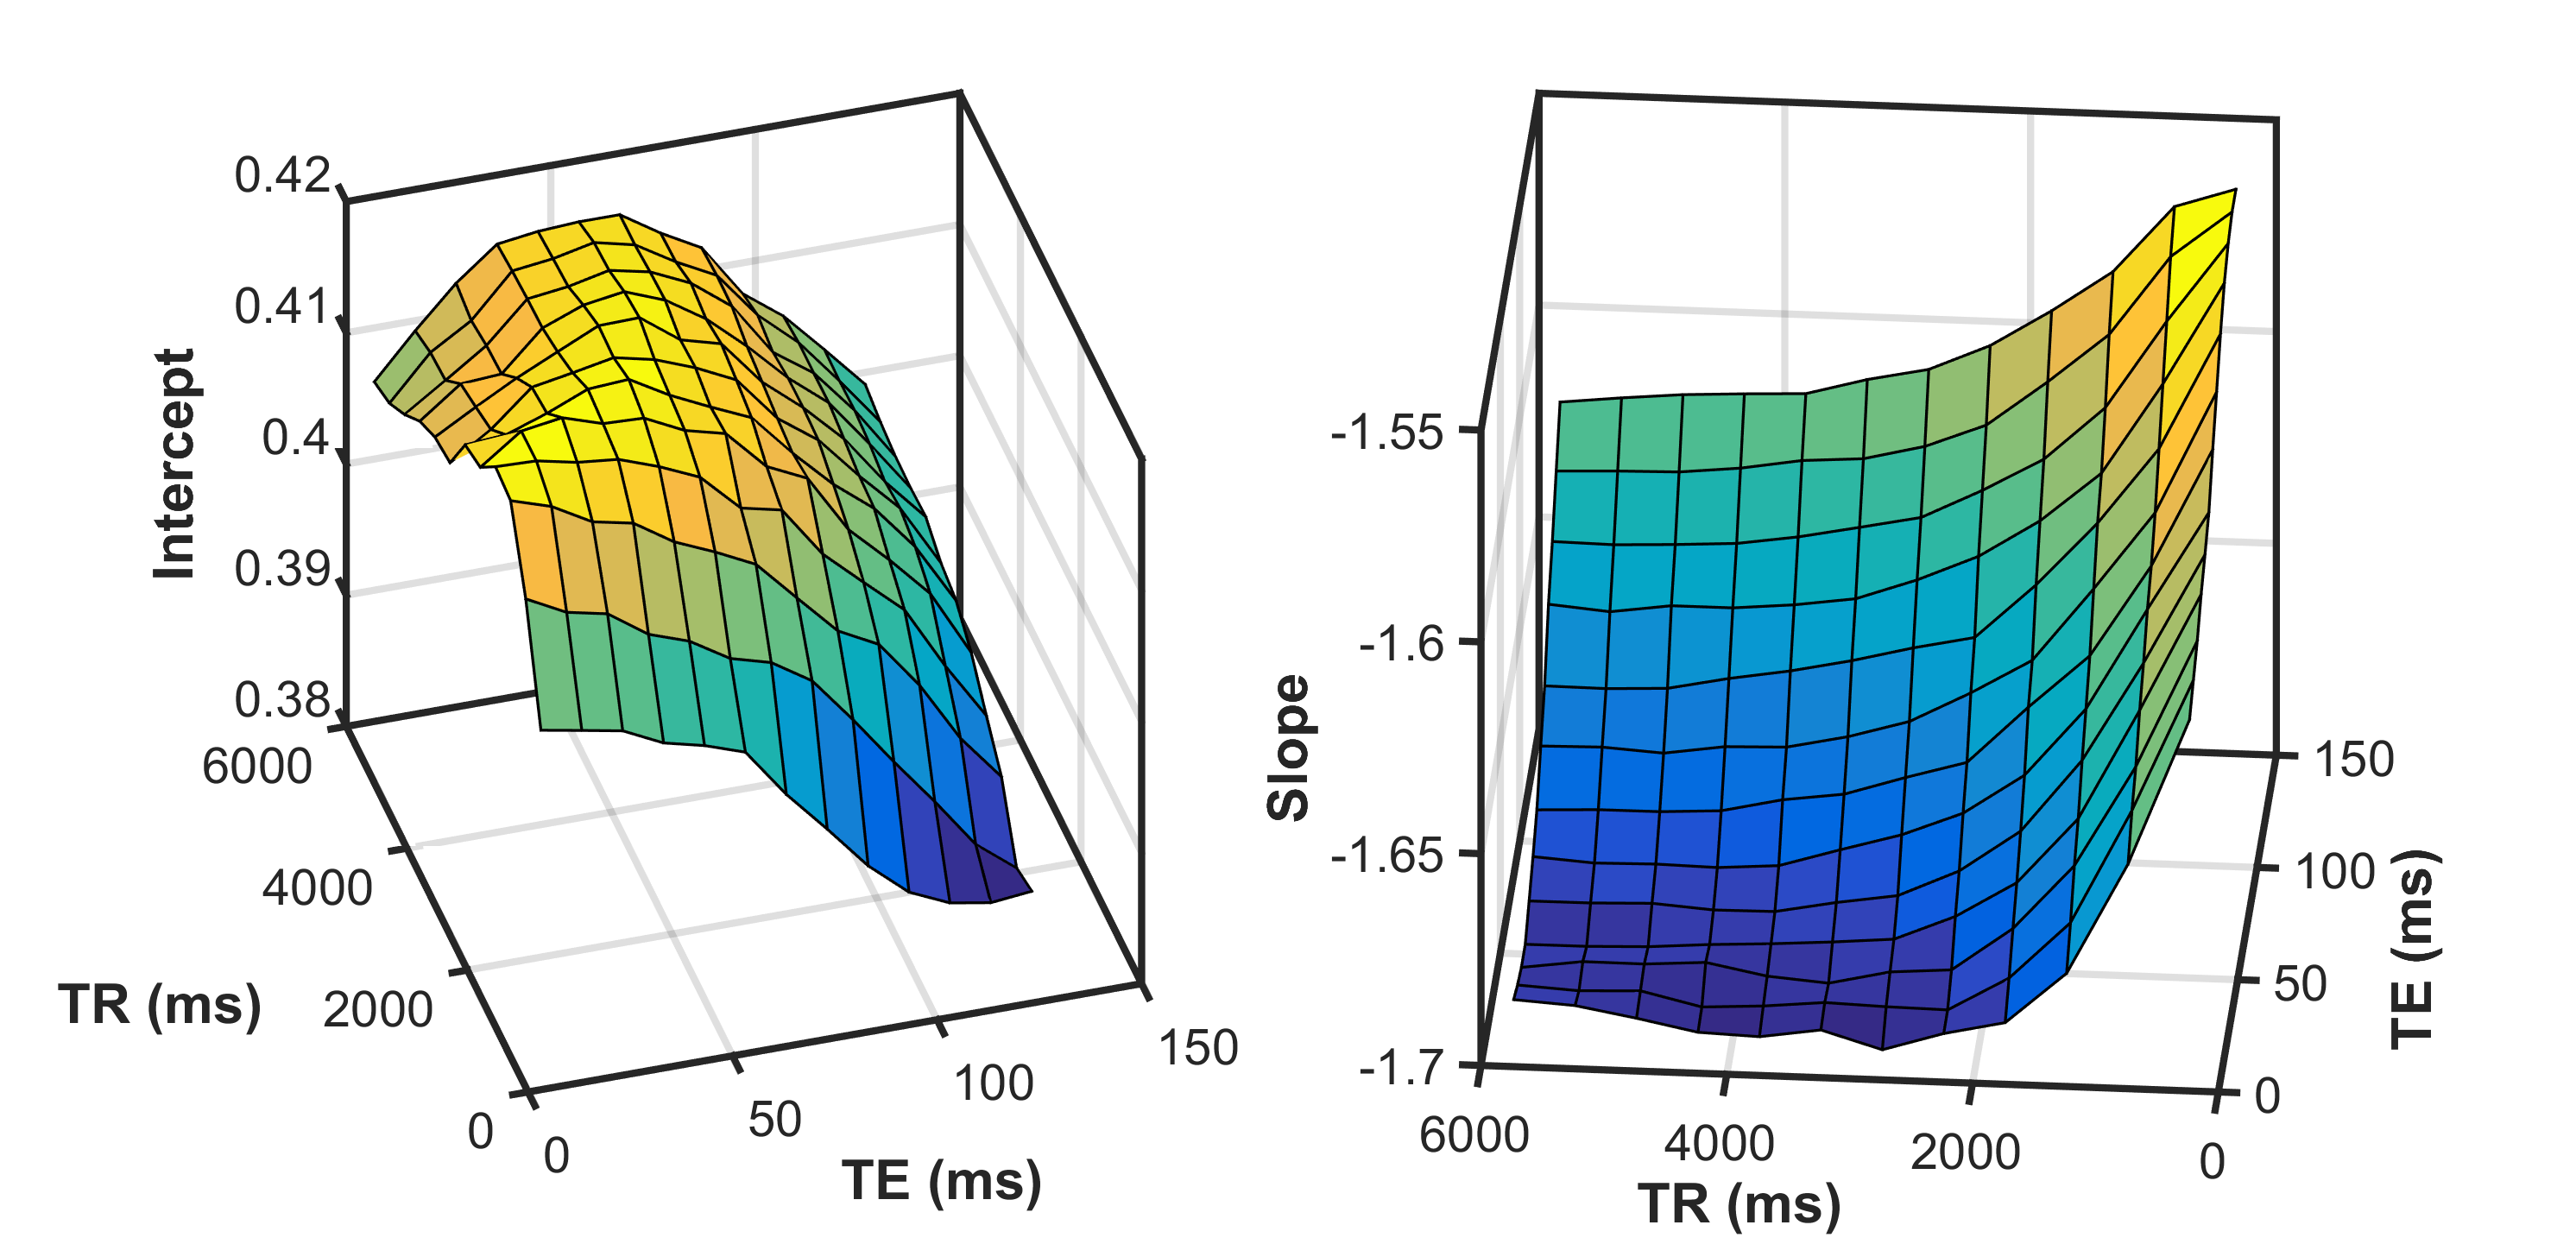
Figure 2 shows the regression of log(FFat) on log(HGRE) for the 512x512, 384x384, and 256x256 images. The slope and intercept coefficients did not differ significantly among the three image sizes. Figure 3 gives 3D surface plots illustrating the dependence of the HGRE intercept and slope on TR/TE.
Conclusions
The ability of HGRE to predict FFat from T2-weighted MR images of fat-infiltrated muscles is not significantly affected by changes in in-plane resolution ranging from 1 mm2 to 0.25 mm2. Predictably, the regression coefficients vary considerably across TR and TE values, but in a coherent manner. Together, these findings suggest that texture analysis of contrast-based MR images of muscle may provide a means for quantitative analysis of clinically obtained images.Acknowledgements
NIH R01 AR057091, U54 TR000123, and K25 EB013659References
(1) Galloway MM. (1975). Texture analysis using gray level run lengths. Com Graphics Image Proc. 4:172.Figures
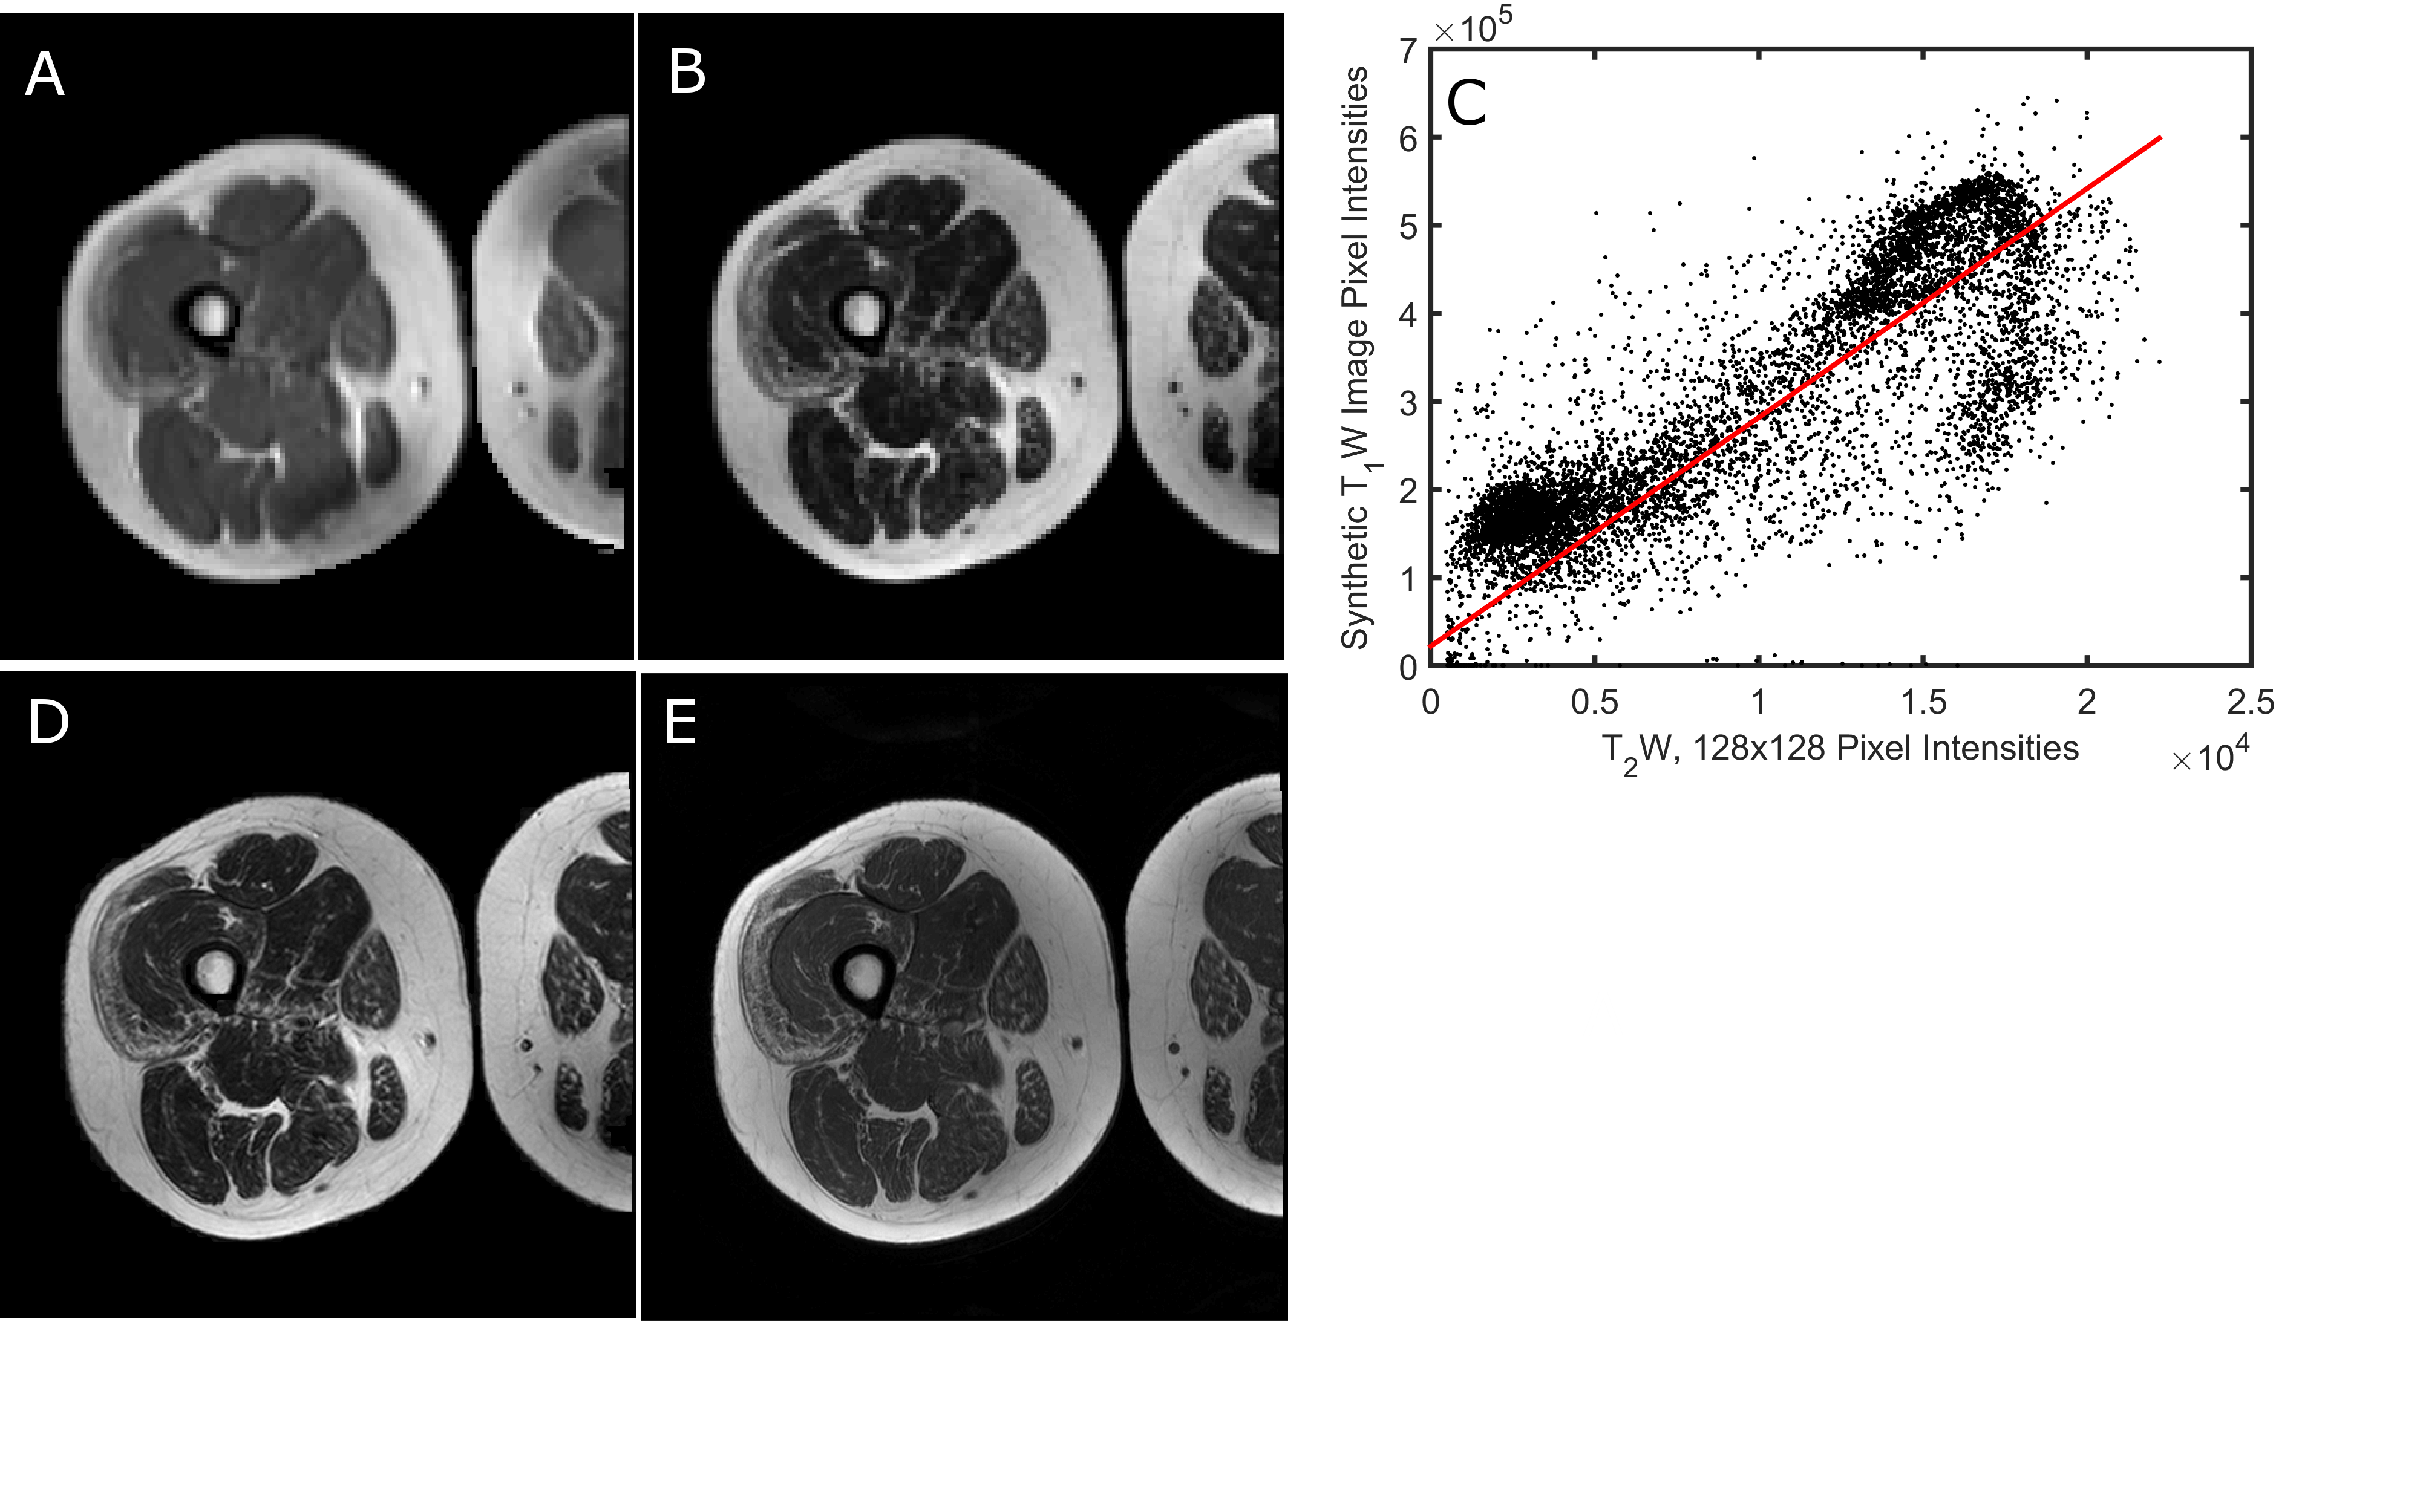
Figure 1. Method for synthesizing images at arbitrary TE/512x512 TE. A. Synthetic 128x128 image, formed using T1, T2, and B1 maps. B.128x128 T2-weighted image. C. Regression of pixel intensities in image A on pixel intensities in image B. D. Synthetic 512x512, T1-weighted image. E. Original 512x512 T1-weighted image.