1406
Validation of an Osirix Plugin for automatic fat infiltration measurements in Paraspinal muscles using T2 weighted images1Biomedical Imaging Center, Pontificia Universidad Catolica de Chile, Santiago, Chile, 2Department of Orthopaedic Surgery, School of Medicine, Pontificia Universidad Catolica de Chile, Santiago, Chile, 3Department of Radiology, Universidad del Desarrollo, Santiago, Chile, 4Department of Radiology, School of Medicine, Pontificia Universidad Catolica de Chile, Santiago, Chile
Synopsis
Paraspinal muscle fat infiltration has been related with low back pain. This measurements are typically evaluated using T2w images, however, the accuracy of this method needs a proper validation, since inhomogeneities may produce severe signal changes. In this work, we developed and validated an OsiriX plugin which allows to segment infiltrated fat in T2w images. This tool also allowed us for validating the use of T2w images, considering Dixon fat images as gold-standard. To validate our plugin, we evaluated 5 cross sectional areas (L1-S1) of 4 paraspinal muscle groups for T2w images of 37 patients. To validate T2w images, we analyzed 10 healthy volunteers and 10 patients. We found that T2w segmentation with our OsiriX plugin is a reliable and an accurate method to evaluate the fat infiltration in paraspinal muscles.
Introduction
MRI techniques allow the characterization of paraspinal muscles, particularly to quantify the fat signal fraction (FSF) and cross-sectional area, which have been correlated with multiple pathologies, including low back pain1. The FSF is normally measured using T2w images. However, the accuracy of this method needs a proper validation, since inhomogeneities may produce severe signal changes, and there is not a standard procedure to segment and quantify the fat infiltration2. This work has two-fold: (1) to develop and OsiriX3 plugin to semi-automatically segment the muscle infiltrated fat in T2w images and, (2) using this tool, to validate T2w-based FSF measurements using Dixon fat images.Methods
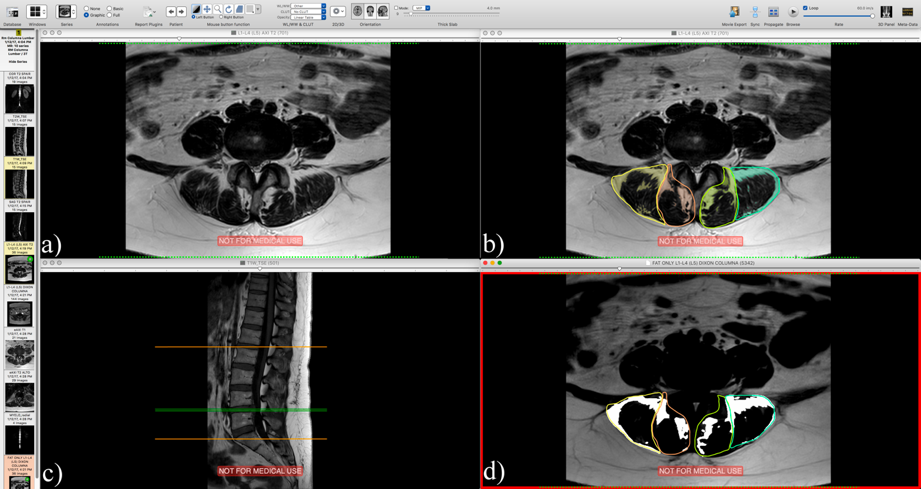
We develop the OsiriX plugin based on a customized version of pyOsiriX4. Our plugin is based on automatic Otsu5 and Yen6 thresholding algorithms, which are applied in manually segmented muscle groups, in this case the Multifidus (MF) and Erector Spinae (ES). The algorithm automatically identifies each muscle and reports the FSF. The segmentations were performed at 5 inter-disc levels, from L1 to S1. To validate our plugin, we compared manual against our plugin segmentations in T2w images of 37 with different clinical conditions (12 men, mean age 47.68 ± 14.90 years, mean weight 78.14 ± 11.86 kg). Data were acquired in a 1.5T MR scanner (Philips Achieva, Best, the Netherlands) with the following parameters: TE/TR 100/3332.29ms, acquisition matrix 168×121, voxel size 0.47´0.47´4 mm. To validated T2w-based measurements we compared our plugin segmentation with manual segmentation of fat Dixon images of 10 healthy volunteers and 10 patients. They were scanned in a 3.0T Philips Ingenia, with the following Dixon sequence parameters: acquisition matrix 324×324, voxel size 0.4×0.4×4 mm, TE1/DTE/TR 1.8/1.6/15 ms. We performed t-test, Bland-Altman analysis, correlation and linear regression for both datasets.Results
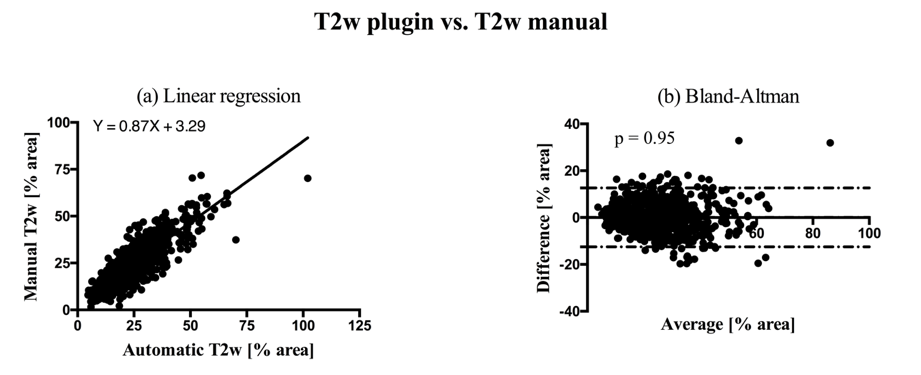
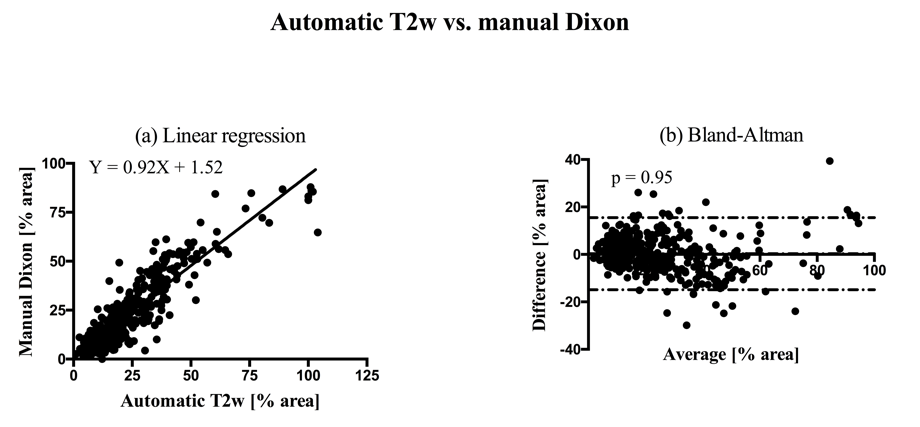
All the results report the percentage of fat area over muscle area. Segmentation with manual and automatic thresholding in T2w images (Fig. 1b) showed no significant differences (paired two tail t-test, P value = 0.82) and a strong correlation (r = 0.86). Bland-Altman analysis showed a bias of 0.05% and limits of agreement of [-12.52, 12.63] % of the muscle area. Linear regression showed a slope of 0.87±0.02 with a 95% confidence interval of [0.83, 0.90], an intercept of 3.29±0.53 with a 95% confidence interval of [2.25, 4.33], and a P value < 0.0001. Manual thresholding of Dixon fat images (Fig. 1d) and automatic thresholding of T2w images (Fig. 1b) showed no significant differences (paired two tail t-test, P value = 0.46). The linear regression showed a slope of 0.90 ± 0.02 with a 95% confidence interval of [0.87, 0.93], an intercept of 2.38 ± 0.47, a 95% confidence interval of [1.46, 3.30] and a P value < 0.0001. The correlation was strong (r = 0.90), and the Bland-Altman analysis showed a bias of 0.28% and limits of agreements of [-14.91, 15.48] % of the muscle area.Discussion
We developed and validated an OsiriX plugin to quantify the fat infiltration in paraspinal muscles using T2w images. Compared to manual segmentations, our plugin showed high level of agreement and strong correlation. A great advantage of our OsiriX plugin is that it reduces the processing time from minutes to a few seconds. As future work, we are developing techniques for facilitating the muscle groups delimitations to define the ROIs.Acknowledgements
CONICYT FONDEF/I Concurso IDeA en dos etapas ID15|10284.References
1. Wang Y-XJ, Zhao F, Griffith JF, Mok GSP, Leung JCS, Ahuja AT, Yuan J. T1rho and T2 relaxation times for lumbar disc degeneration: an in vivo comparative study at 3.0-Tesla MRI. Eur Radiol 2013;23:228–234.
2. Fortin M, Battié MC. Quantitative paraspinal muscle measurements: inter-software reliability and agreement using OsiriX and ImageJ. Phys Ther 2012;92:853– 864.
3. Rosset A, Spadola L, Ratib O. OsiriX: An open-source software for navigating in multidimensional DICOM images. J Digit Imaging 2004;17(3):205–216.
4. Blackledge MD, Collins DJ, Koh D-M, Leach MO. Rapid development of image analysis research tools: Bridging the gap between researcher and clinician with pyOsiriX. Comput. Bio Med 2016;69:203–212.
5. Otsu N. A threshold selection method from gray-level histograms. IEEE T Syst Man, Cyb 1979;9:62–66. 6. Yen JC, Chang FJ, Chang S. A new criterion for automatic multilevel thresholding. IEEE T Image Process 1995;4(3):370–378.
Figures