1405
Improved Spontaneous Activity Maps of Resting Skeletal Musculature by surface EMG-based Contraction Pattern Classification1Section on Experimental Radiology, University Hospital of Tübingen, Tübingen, Germany, 2Institute of Signal Processing and System Theory, University of Stuttgart, Stuttgart, Germany, 3Biomedical Magnetic Resonance, University Hospital of Tübingen, Tübingen, Germany, 4High-Field Magnetic Resonance Center, Max Planck Institute for Biological Cybernetics, Tübingen, Germany
Synopsis
Reliable assessment and analysis of spontaneous mechanical activities in musculature (SMAM) visible in repetitive DWI is a relatively new technique for non-invasive characterization of skeletal musculature. To correct for data corrupted by intentional contractions, a surface electromyography-based contraction state analysis was investigated to reject undesired DWI data. It is demonstrated that the presented method enables a more reliable quantification of SMAMs and improved spontaneous activity maps.
Introduction
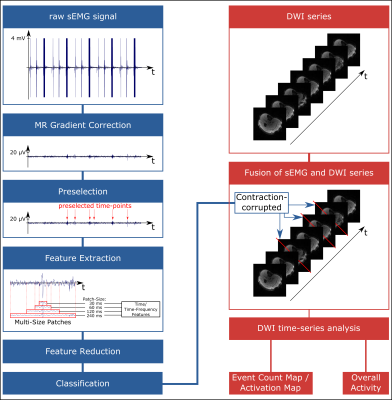
Spontaneous mechanical activities in musculature (SMAM) visible in DWI have shown a strong correlation to myoelectric signals acquired by simultaneous electromyography (sEMG).1,2 Besides spontaneous activities, other muscular contractions are also leading to signal voids in DWI, which are not distinguishable from SMAMs. However, contraction patterns are visible and well recognizable in sEMG (Figure 1). In order to investigate significant correlation and differences regarding SMAMs between healthy and non-healthy subjects and to enable cohort studies, reliable assessment and quantification of SMAMs is required. Due to this, non-spontaneous muscle contractions visible in DWI have to be excluded before data analysis. Therefore, contraction patterns have to be identified in sEMG data to reject DWI, which were affected by these non-spontaneous muscle contractions. A retrospective method based on automatic sEMG classification and DWI rejection to achieve reliable activity assessment is proposed.Methods
Three
healthy volunteers (age: 41±17, BMI: 28.5±4.2) were examined on a 3 T MR
scanner (MAGNETOM Prismafit, Siemens Healthcare, Erlangen, Germany)
with a 15-channel Tx/Rx-coil and concurrent recording of sEMG. DWI of the right
calf was conducted under three different muscular contraction states: resting, active
isometric contraction and active movement. Measurement parameters of DWI:
prototype stimulated-echo echo-planar imaging sequence (Siemens Healthcare
GmbH), matrix-size: 80 x 80, FOV: 192 x 192 mm², TE: 26 ms,
TR: 500 ms, GRAPPA: 2, BW: 2015 Hz/px;
slice-thickness: 6 mm, diffusion-sensitizing time Δ: 157 ms, b-value:
100 s/mm². sEMG measurements were concurrently recorded with a
MR-compatible system (BrainAmp ExG MR, Brain Products GmbH, Gilching, Germany)
at the DWI slice location with 5 kHz sampling rate and four channels. Each
muscular contraction state was recorded over 250 s (500 repetitions
in DWI). Data of four subjects, which were previously measured concurrently to
DWI, were additionally taken to provide sufficient amount of training data
regarding spontaneous events. sEMG
classification: Framework for retrospective muscle contraction
classification and data rejection is depicted in Figure 2 showing the sEMG
classification pipeline and connection to DWI. First, simultaneous sEMG
datasets were artifact-corrected and filtered.2-6 All sEMG signals
higher than 10 µV were split into patches and subsequently processed by a
two-class Support-Vector-Machine (SVM) to detect muscular contraction.
Afterwards, all patches containing sEMG activities were processed by a
four-class SVM for classification with features from multiple patch-sizes. Two
different groups of feature sets were employed on each patch-size step: 40
time-domain7-11 and 31 time-frequency-domain features7,12-13.
Time-domain features were also calculated from raw sEMG signal patches to
address the issue of MR residuals from MR gradients. Feature reduction was
performed by classical principal component analysis. Classification was based
on one-vs-one soft-margin multi-class SVM with radial-basis function utilizing
LIBSVM14. Four classes were investigated: active isometric contraction (1), active
movement (2), spontaneous activity (3) and MR residual artifact (4). 4680
signal patches (basic-size: 30 ms) (class: 1/2/3/4; 1825/1097/617/1141)
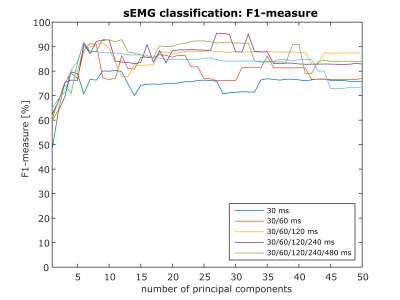
were manually labeled by a human observer. Hyperparameters of SVM (γ,C) were optimized via cross-validation. Evaluation: F1-measure of sEMG
classification was determined as a function of the number of principal components
by 7-fold CV (each subject was taken once as test data). To investigate the
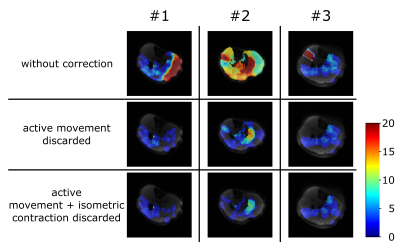
impact of different contraction patterns onto spontaneous activity maps
(event count maps – ECM), three composed datasets (one for each volunteer) were
evaluated. Each dataset contained 500 DWI with following muscle contraction
states: 70 % resting, 20 % isometric contraction and 10 % active movement.
Thus, each dataset represents a clinical feasible acquisition. DWI were
processed by self-written code in MATLAB (The MathWorks, Inc., Natick, MA,
USA).15 DWI classified as "movement" or "isometric
contraction" were discarded from ECM calculation to compare activity
maps with and without rejection of contraction-corrupted images.Results & Discussion
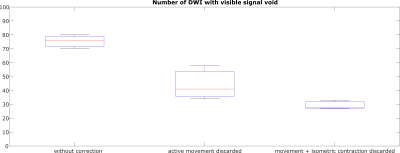
In Figure 3, result of sEMG classification is shown. F1-measure of 95.49 % was achieved with 27 principle components and four hierarchical features patches (size: 30/60/120/240 ms). Thus a reliable identification of contraction-corrupted DWI is ensured. Comparing ECM with and without data rejection reveals clear differences (Figure 4). As shown in Figure 4/5, few images containing active movement lead to overestimation of spontaneous activity. Number of DWI with signal voids were reduced from 75, 44 to 29 in average by rejection of contraction-corrupted DWI.Conclusion
Reliable classification of sEMG contraction patterns was shown. Moreover, reliable assessment of overall spontaneous activity and improved activity maps were investigated by sEMG-based signal classification and contraction pattern analysis. Rejection of DWI with these muscle contractions, which are not from spontaneous nature, is highly recommended before data analysis to yield trustworthy data in healthy and non-healthy subjects.Acknowledgements
We thank Stemmer, A., Siemens Healthcare GmbH, and Ramos-Murguialday, A., Institute for Medical Psychology and Behavioural Neurobiology, University of Tübingen, for their valuable technical support on this project.References
1. Steidle G, Schick F. Addressing spontaneous signal voids in repetitive single-shot DWI of musculature: spatial and temporal patterns in the calves of healthy volunteers and consideration of unintended muscle activities as underlying mechanism. NMR Biomed 2015;28(7):801-10
2. Schwartz M, Steidle G, Martirosian P, et al. Spontaneous mechanical and electrical activities of human calf musculature at rest assessed by repetitive single-shot diffusion-weighted MRI and simultaneous surface electromyography. Magn Reson Med 2017;doi: 10.1002/mrm.26921. [Epub ahead of print]
3. Niazy RK, Beckmann CF, Ianetti GD, et al. Removal of FMRI environment artifacts from EEG data using optimal basis sets. Neuroimage 2005;28(3):720-37
4. Ianetti GD, Niazy RK, Wise RG, et al. Simultaneous recording of laser-evoked brain potentials and continuous, high-field functional magnetic resonance imaging in humans. Neuroimage 2005;32(3):1120-6
5. Delorme A, Makeig S. EEGLAB: an open source toolbox for analysis of single-trial EEG dynamics including independent component analysis. J Neurosci Methods 2004;134(1):9-21
6. Glaser J, Beisteiner R, Bauer H, et al. FACET – a flexible artifact correction and evaluation toolbox for concurrently recorded EEG/fMRI data. BMC NeuroSci 2013;14:138
7. Phinyomark A, Phukpattaranont P, Limsakul C. Feature reduction and selection for EMG signal classification. Expert Syst Appl. 2012;39:7420-31
8. Hudgins B, Parker P, Scott RN. A new strategy for multifunction myoelectric control. IEEE Trans Biomed Eng. 1993;40(1):82-94
9. Kaiser JF. On a simple algorithm to calculate the 'energy' of a signal. IEEE ICASSP 1990:381-84
10. Kaiser JF. Some useful properties of Teager's energy operators. IEEE ICASSP 1993:149-52
11. Higuchi T. Approach to an irregular time series on the basis of the fractal theory. Physica D 1988;31(2):277-83
12. Lo Conte L, Merletti R, Sandri GV. Hermite Expansions of Compact Support Waveforms: Applications to Myoelectric Signals. IEEE Trans on Biomed Eng 1994;41(12):1147-59
13. Merlo A, Farina D. A Fast and Reliable Technique for Muscle Activity Detection From Surface EMG Signals. IEEE Trans Biomed Eng 2003;50(3):316-23
14. Chang CC, Lin, CJ. LIBSVM: a library for support vector machines. ACM TIST 2011;2:27:1—27:27
15. Schwartz M, Steidle G, Martirosian P, et al. Graph-based segmentation of signal voids in time series of diffusion-weighted images of musculature in the human lower leg. Proc. Annual Meeting ISMRM 2016, May 2016, Singapore
Figures


