1404
Application of MR Elastography to Transvertebral Psoas Major Muscle1Department of Radiological Sciences, Graduate School of Human Health Sciences, Tokyo Metropolitan University, Tokyo, Japan, 2Health Research Institute, National Institute of Advanced Industrial Science and Technology, Tsukuba, Japan, 3Office of Radiation Technology, Keio University Hospital, Tokyo, Japan, 4Department of Judo Neurophysiotherapy, Graduate School of Medicine and Pharmaceutical Sciences, University of Toyama, Toyama, Japan, 5Mechanical Engineering, Tokyo Denki University, Tokyo, Japan, 6Department of System Emotional Science, Graduate School of Medicine and Pharmaceutical Sciences, University of Toyama, Toyama, Japan
Synopsis
The aim of the present work was to develop the vibration techniques for the psoas major muscle (PM) MR elastography (MRE). The results indicated that the PM well vibrated, due to transmission of vibration from the lumbar spine. These findings suggest that placement of a narrow vibration pad under the supine body, along the lumbar spine, would allow PM MRE. The present techniques for the PM MRE provide a quantitative diagnostic tool for LBP-associated changes in the muscles, since increased stiffness of the muscle due to continuous contraction is suggested to be an important cause of LBP.
INTRODUCTION
Low back pain (LBP) is a common disorder involving the lumbar muscles. Like other symptoms, such as headache and dizziness, it can have many underlying causes. The most common form of low back pain is non-specific low back pain, in which pathoanatomical causes of the pain cannot be determined. To our knowledge, no previous study has applied MR elastography (MRE) technique to investigate LBP. In this study, novel MRE technique based on conventional gradient echo type multi-echo sequence (GRE-MultiEcho-MRE) has been applied to investigate the psoas major muscle (PM). However, since position of PM is located in the deep, it is difficult to transmit vibrations to the PM. The aim of the present work was to investigate the vibration mode for the PM and to develop the vibration techniques for the PM MRE.
Our previous study reported a new method for MRE using the GRE-MultiEcho-MRE sequence without motion encoding gradient (MEG)1. The GRE-MultiEcho-MRE uses a series of echoes acquired as a train following after a single excitation pulse. The multiple symmetrical gradient-echoes in the GRE-MultiEcho-MRE are acquired by symmetrical bipolar readout gradient (GR). This GR has a function comparable to MEG (MEG-like effect).
Non-specific LBP has been investigated using conventional MR images. Such studies reported that specific paraspinal muscles underwent atrophy and fatty infiltration in patients with acute and chronic LBP2, while changes in the cross-sectional area of the psoas major muscles were associated with degenerative changes of lumbar spine in patients with low back pain3. However, these morphological changes cannot directly account for LBP, but continuous contraction of the muscle is suggested to be a cause of LBP. Thus, MRE can be used as a virtual palpation to image stiffness of the deep-lying muscles (e.g., PM).
METHODS
All MRE experiments were performed on a clinical MR imager (Achieva 3.0 T; Philips Healthcare, Best, The Netherlands) using a torso coil. A self-made waveform generation system (LabVIEW, USB-6221; National Instruments, TX, USA) was used to generate the vibration waveform. This system is capable of generating sinusoidal waveforms with arbitrary frequencies and phases. Power amplifier (XTi 1000; Crown, IN, USA) and a pneumatic pressure generator (Subwoofer TIT320C-4 12”; Dayton Audio, OH, USA) units were used to supply vibrations to a vibration pad. The vibration pad was designed using a three-dimensional (3D) printer (3D touch; 3D system, SC, USA) in order to adapt to the lower back region (Fig.1).
The GRE-MultiEcho-MRE sequence parameters were TR: 40 ms, 1st TE: 2.2 ms, 2nd TE: 12.2 ms, flip angle: 20 degree, scan matrix: 512×256, image matrix: 512×512 vibration frequency: 50 Hz, vibration phase offset: 4, total acquisition time: 82 s, MEG-like effect (RG) direction: A-P. All elastograms were produced by Local Frequency Estimate (LFE) algorithm freeware (MRE/Wave, MAYO CLINIC).
RESULTS and DISCUSSION
Figure 2 shows the wave images of one volunteer by using the center vibration of the three-way pad. The vibrations were transmitted from the lumbar spine (disc) to the left and right PMs. Furthermore, the transmission of the vibration was symmetrical. This tendency was observed in most volunteers. Figures 3 and 4 show wave images of one volunteer by using the left and right vibration of the three-way pad, respectively. It is noted that the PM of the opposite side of the vibration pad was also vibrating, suggesting that the PM well transmits vibration to the opposite side through the lumbar spine. Figure 5a shows the vibration amplitudes that varied with the positions of the activated pad. When activating the center pad, L/R ratios of vibration amplitudes were 1.65 and 1.18 times in the PM and erector spinae muscle (EM), respectively. When activating the left pad, the ratios were 1.88 and 8.54 times in the PM and EM, respectively. When activating the right pad, the R/L ratios were 2.07 and 7.62 times in the PM and EM, respectively. Even if either the left or right vibration pad was activated, the ratios were smaller in the PM than the EM, suggesting that the vibration of the PM might be transmitted mainly from the lumbar spine. Moreover, by activating the center pad, vibration was effectively transferred to the lumbar spine, which might in turn effectively transmit vibration to the PM in both sides. When activating two or three pads simultaneously, the PM vibration would be contaminated by side (left or right) pad vibration through the EM. These findings suggest that the center vibration pad is suitable for the PM MRE in the lower back region. Taken together, PM MRE can be used as a new imaging biomarker of LBP.Acknowledgements
No acknowledgement found.References
- Numano T, Mizuhara K, Hata J, et al. A simple method for MR elastography: a gradient-echo type multi-echo sequence. Magn Reson Imaging 2015;33(1):31-37.
- Mengiardi B, Schmid MR, Boos N, et al. Fat content of lumbar paraspinal muscles in patients with chronic low back pain and in asymptomatic volunteers: quantification with MR spectroscopy. Radiology 2006 Sep;240(3):786-92.
- Arbanas J, Pavlovic I, Marijancic V, et al. MRI features of the psoas major muscle in patients with low back pain. Eur Spine J 2013 Sep;22(9):1965-71.
Figures
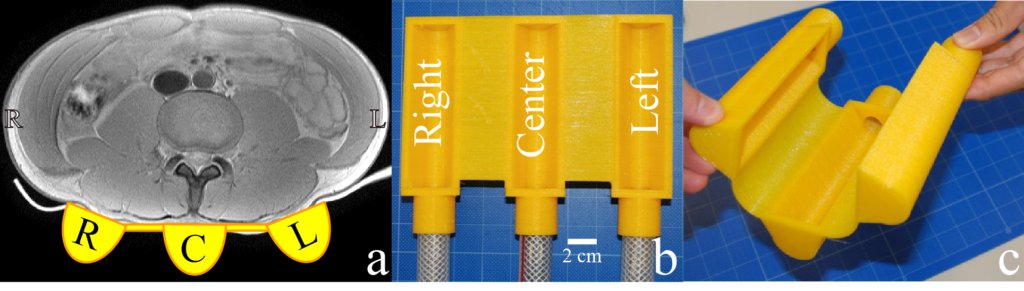
Figure 1 Three-way vibration pad
a: The axial image of the low back region (L3/L4) of a volunteer with the three-way vibration pad. The three-way vibration pad was placed under the volunteer in a supine position.
b: The three-way pad was made by a 3D printer. Each vibration pad (Right, Center, Left) was connected to a pneumatic pressure generator using a commercial hose. In this study, we activated the pad one by one.
c: The three-way pad has flexibility.
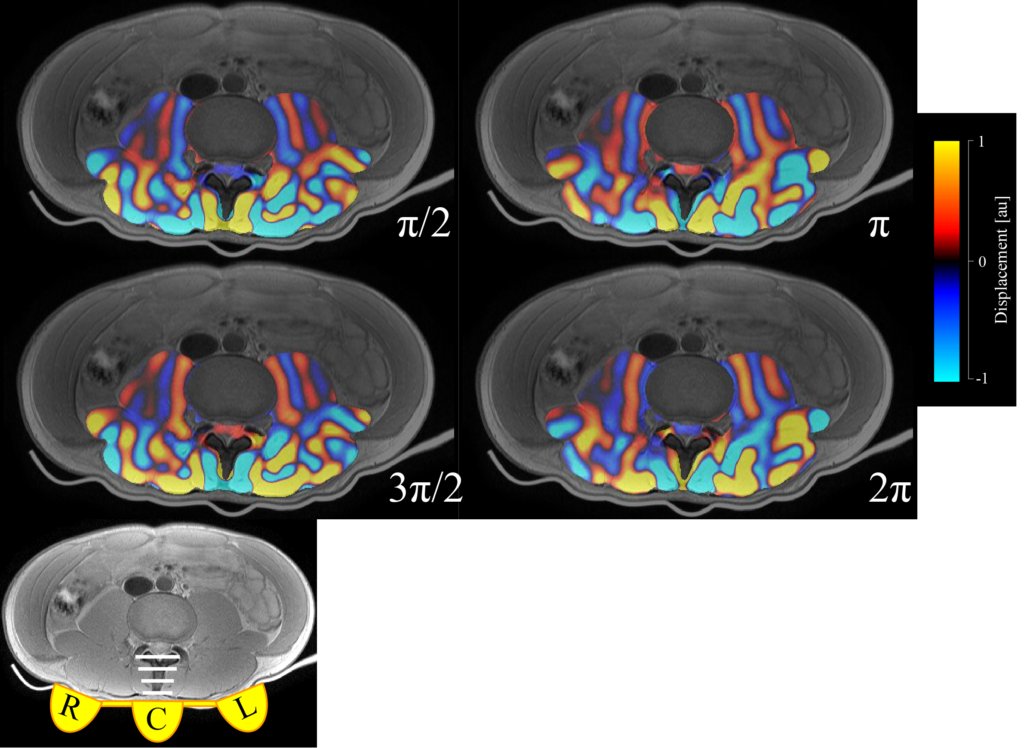
Figure 2 Wave images by activating the center vibration pad
Four vibration phase offsets (π/2, π, 3π/2, 2π) wave images are shown with the center vibration pad activated. Each image was made by fusion of the wave image with the magnitude image of the 1st echo.
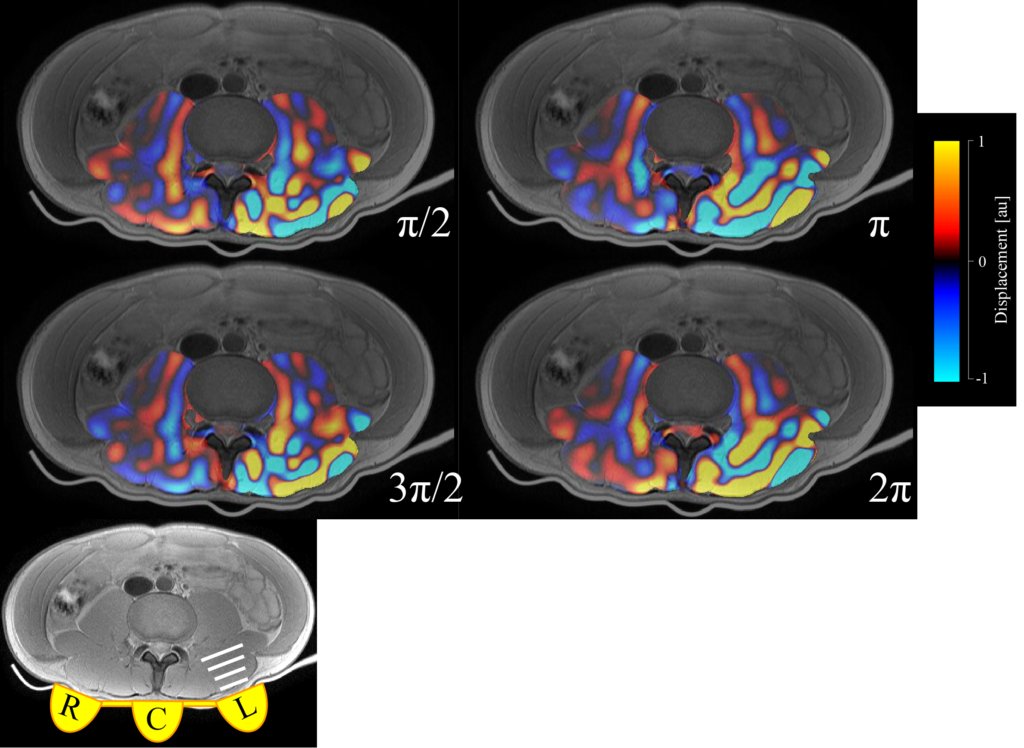
Figure 3 Wave images by activating the left pad
Four vibration phase offsets (π/2, π, 3π/2, 2π) wave images are shown with the left vibration pad activated. Each image was made by fusion of the wave image with the magnitude image of the 1st echo.
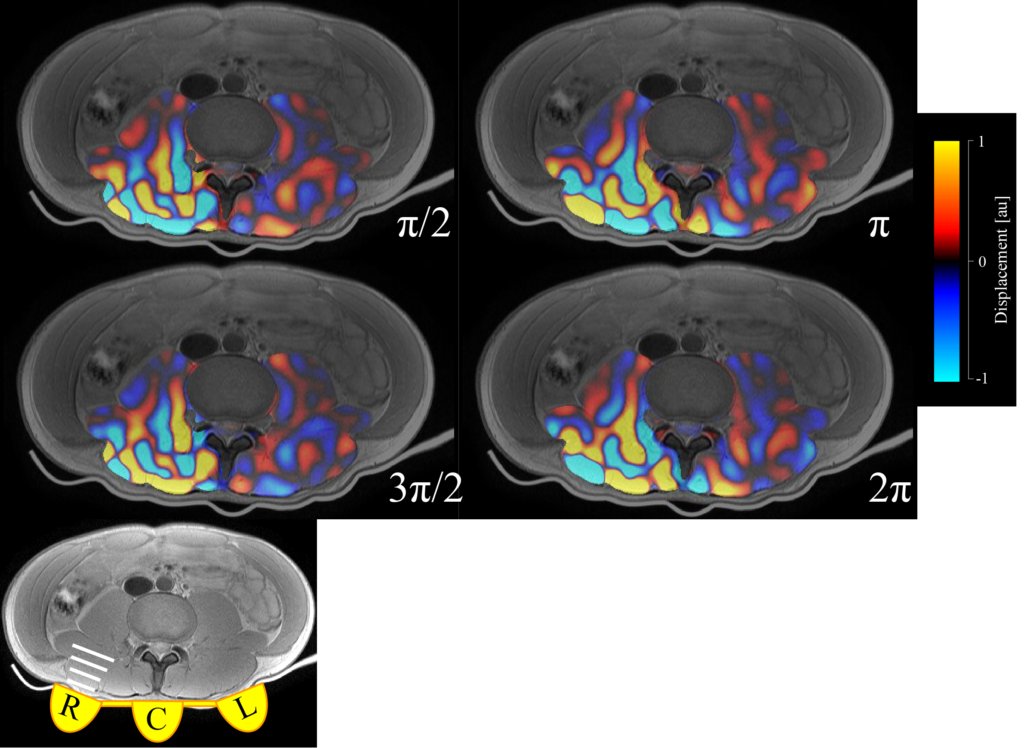
Figure 4 Wave images by activating right pad
Four vibration phase offsets (π/2, π, 3π/2, 2π) wave images are shown with the right vibration pad activated. Each image was made by fusion of the wave image with the magnitude image of the 1st echo.
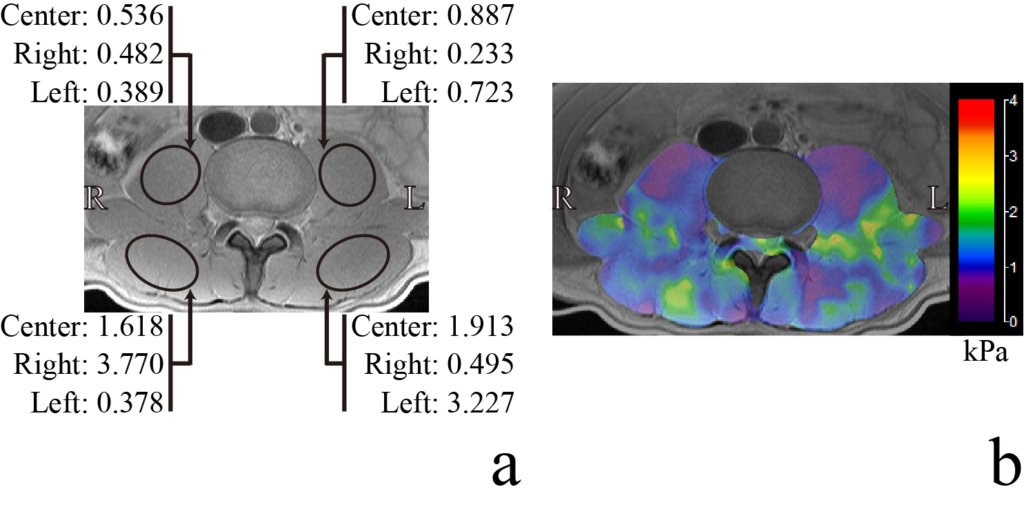
Figure 5 Mean value of vibration amplitude in each ROI (a), and the elastogram using the center pad (b)
a: “Center”, “Right” and “Left” indicate positions of the activated pad. Each numerical value indicates the vibration amplitude obtained by each pad activation.
b: The image was made by fusion of the elastogram with the magnitude image of the 1st echo.