1403
MRI characterization of skeletal muscles of two dystrophic mouse models1Department of Radiology, University of Washington, Seattle, WA, United States, 2Department of Neurology, University of Washington, Seattle, WA, United States, 3Senator Paul D. Wellstone Muscular Dystrophy Cooperative Research Center, University of Washington, Seattle, WA, United States
Synopsis
The mdx mouse model is one of the most commonly used animal model for Duchenne muscular dystrophy (DMD). However, it has a milder phenotype compared to patients with DMD. Evidence has demonstrated the presence of genetic modifiers that lead to phenotypic variability even with an identical gene mutation in both human and animal models of muscular dystrophy. We performed multi-parametric, high resolution MRI to demonstrate severity of disease progression in dystrophic mouse models on two different genetic backgrounds.
Introduction
Duchenne muscular dystrophy (DMD) is a progressive and life-threatening X-linked muscular disorder caused by mutations in the dystrophin (dys) gene. Animal models have helped advance the understanding of the underlying pathological changes that occur in the muscular dystrophies [1]. Even though mdx mice display a milder skeletal muscle phenotype, they have been used to develop and demonstrate efficacy for different therapeutic approaches. In recent years, it has been shown that the presence of genetic modifiers can lead to phenotypic variability even with an identical gene mutation [2, 3]. This led to discovery of a more severe dystrophic mouse model on the DBA/2 background i.e. D2.B10-Dmd mdx (D2-mdx). Magnetic resonance imaging (MRI) has emerged as a sensitive tool and has been used to monitor natural disease progression and efficacy of therapeutic interventions. The primary purpose of this study was to monitor skeletal muscle changes in D2-mdx mice using multi-parametric MRI.Methods
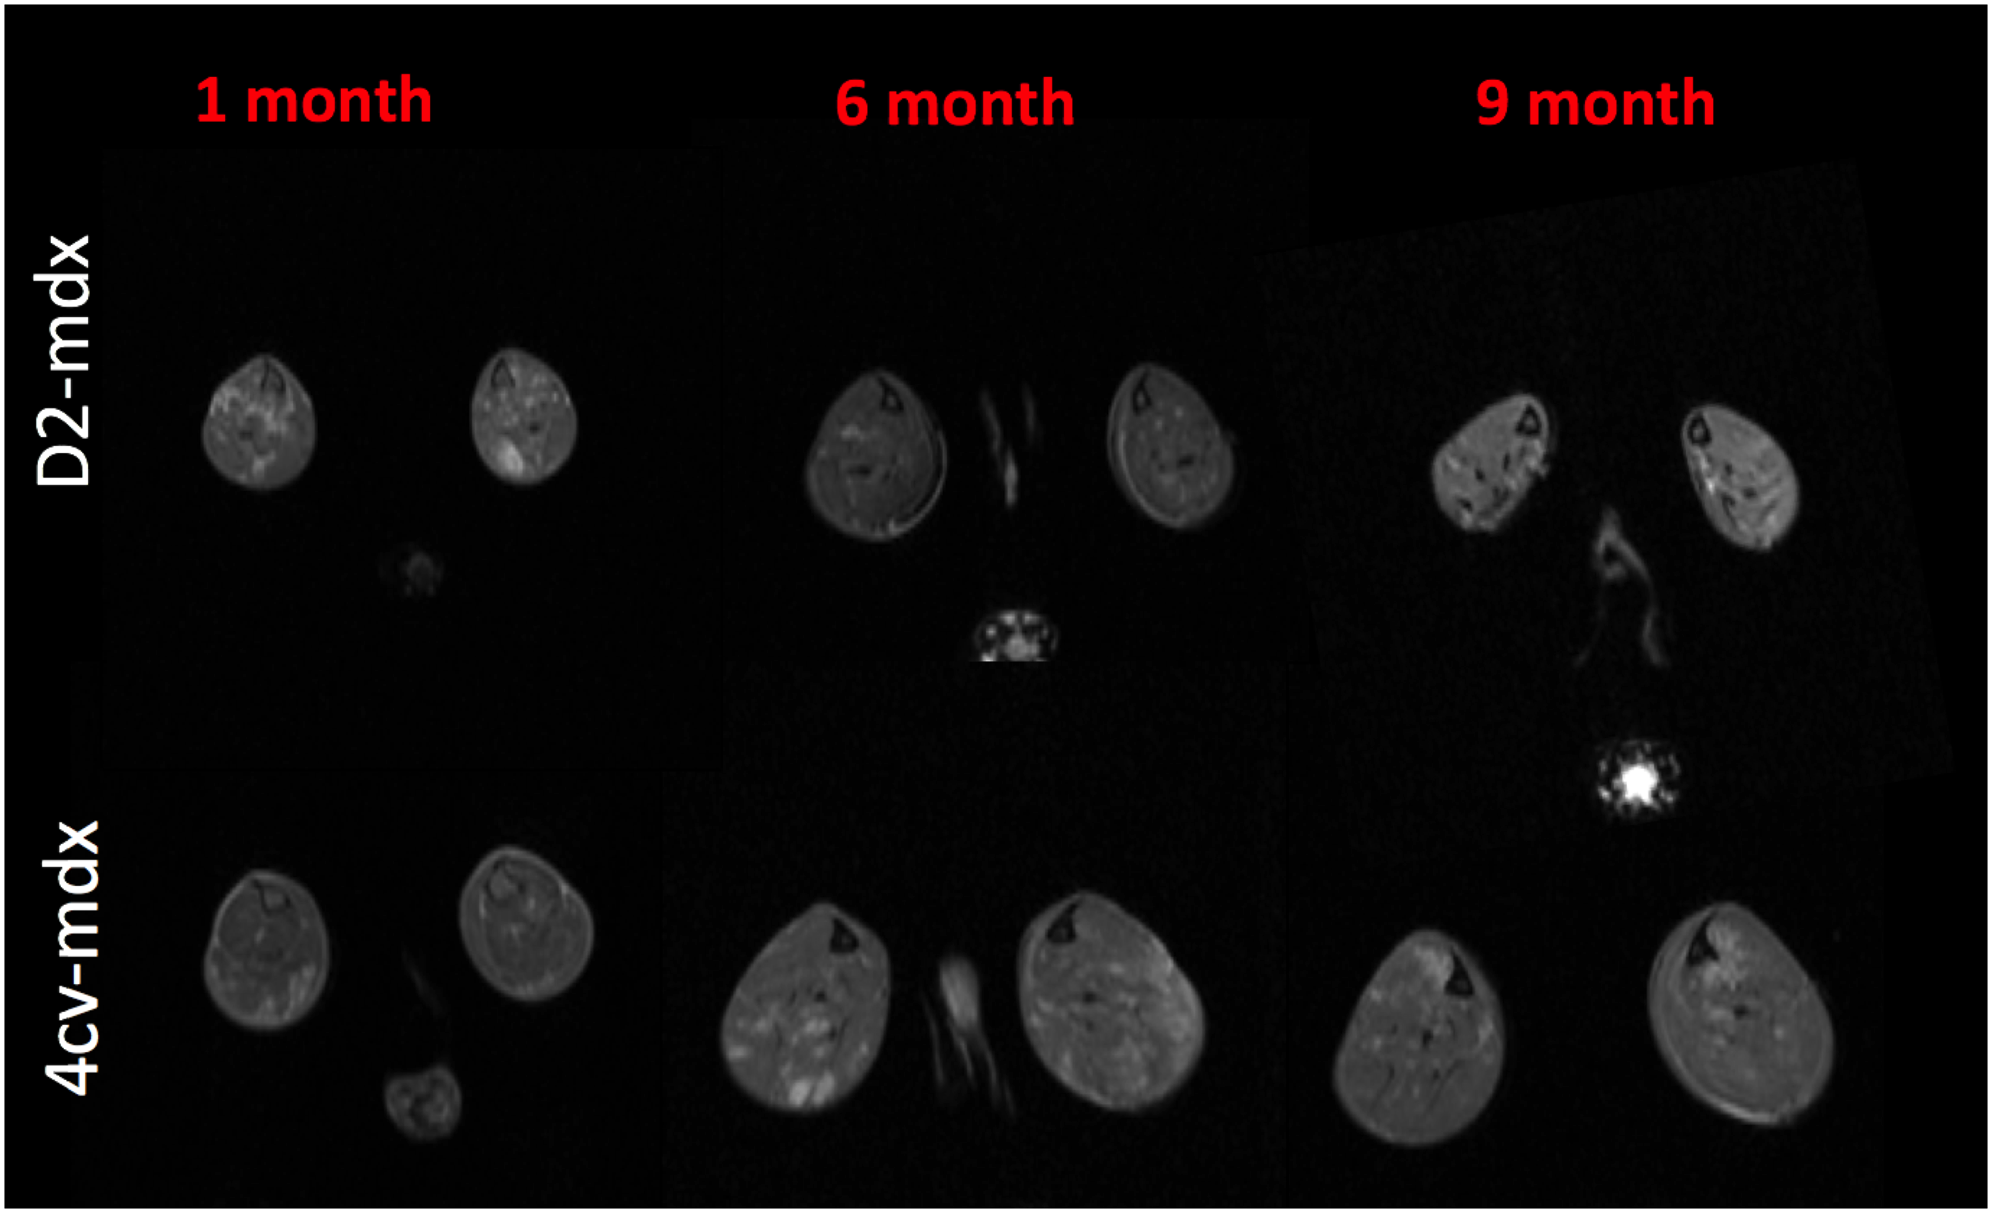
Hindlimb muscles of dystrophic mice (mdx4cv and D2-mdx) and their age matched control mice were imaged at 1,6, and 9 months of age. The mice were imaged on a Bruker 14T Avance 600 MHz/89 mm wide-bore vertical MR spectrometer (Bruker Corp., Billerica, MA). The high resolution MRI protocol includes scout imaging (gradient echo; TR (repetition time)/TE (echo time) = 100/3.42 ms), planning for image planes (multi-slice RARE (rapid acquisition with refocused echoes): TR/TE = 667.54/4.47 ms), multi-slice images with refocused echoes for T1 measurements (TR/TE = 5500, 3000, 1500, 1000, 385.8/9.66), multi-slice multi-echo imaging (TR/TE = 4000/6.28 – 75.4 ms, 12 echoes with 6.28 ms spacing) for transverse relaxation time T2 measurements, magnetization transfer (MT) imaging (gradient echo; TR/TE = 938.94/2.28 ms, flip angle = 30). Post MRI all mice were euthanized and muscles were harvested for histopathological confirmation. Image analysis was conducted using ImageJ software and all statistical analyses was done using Graph Pad Prism software.Results
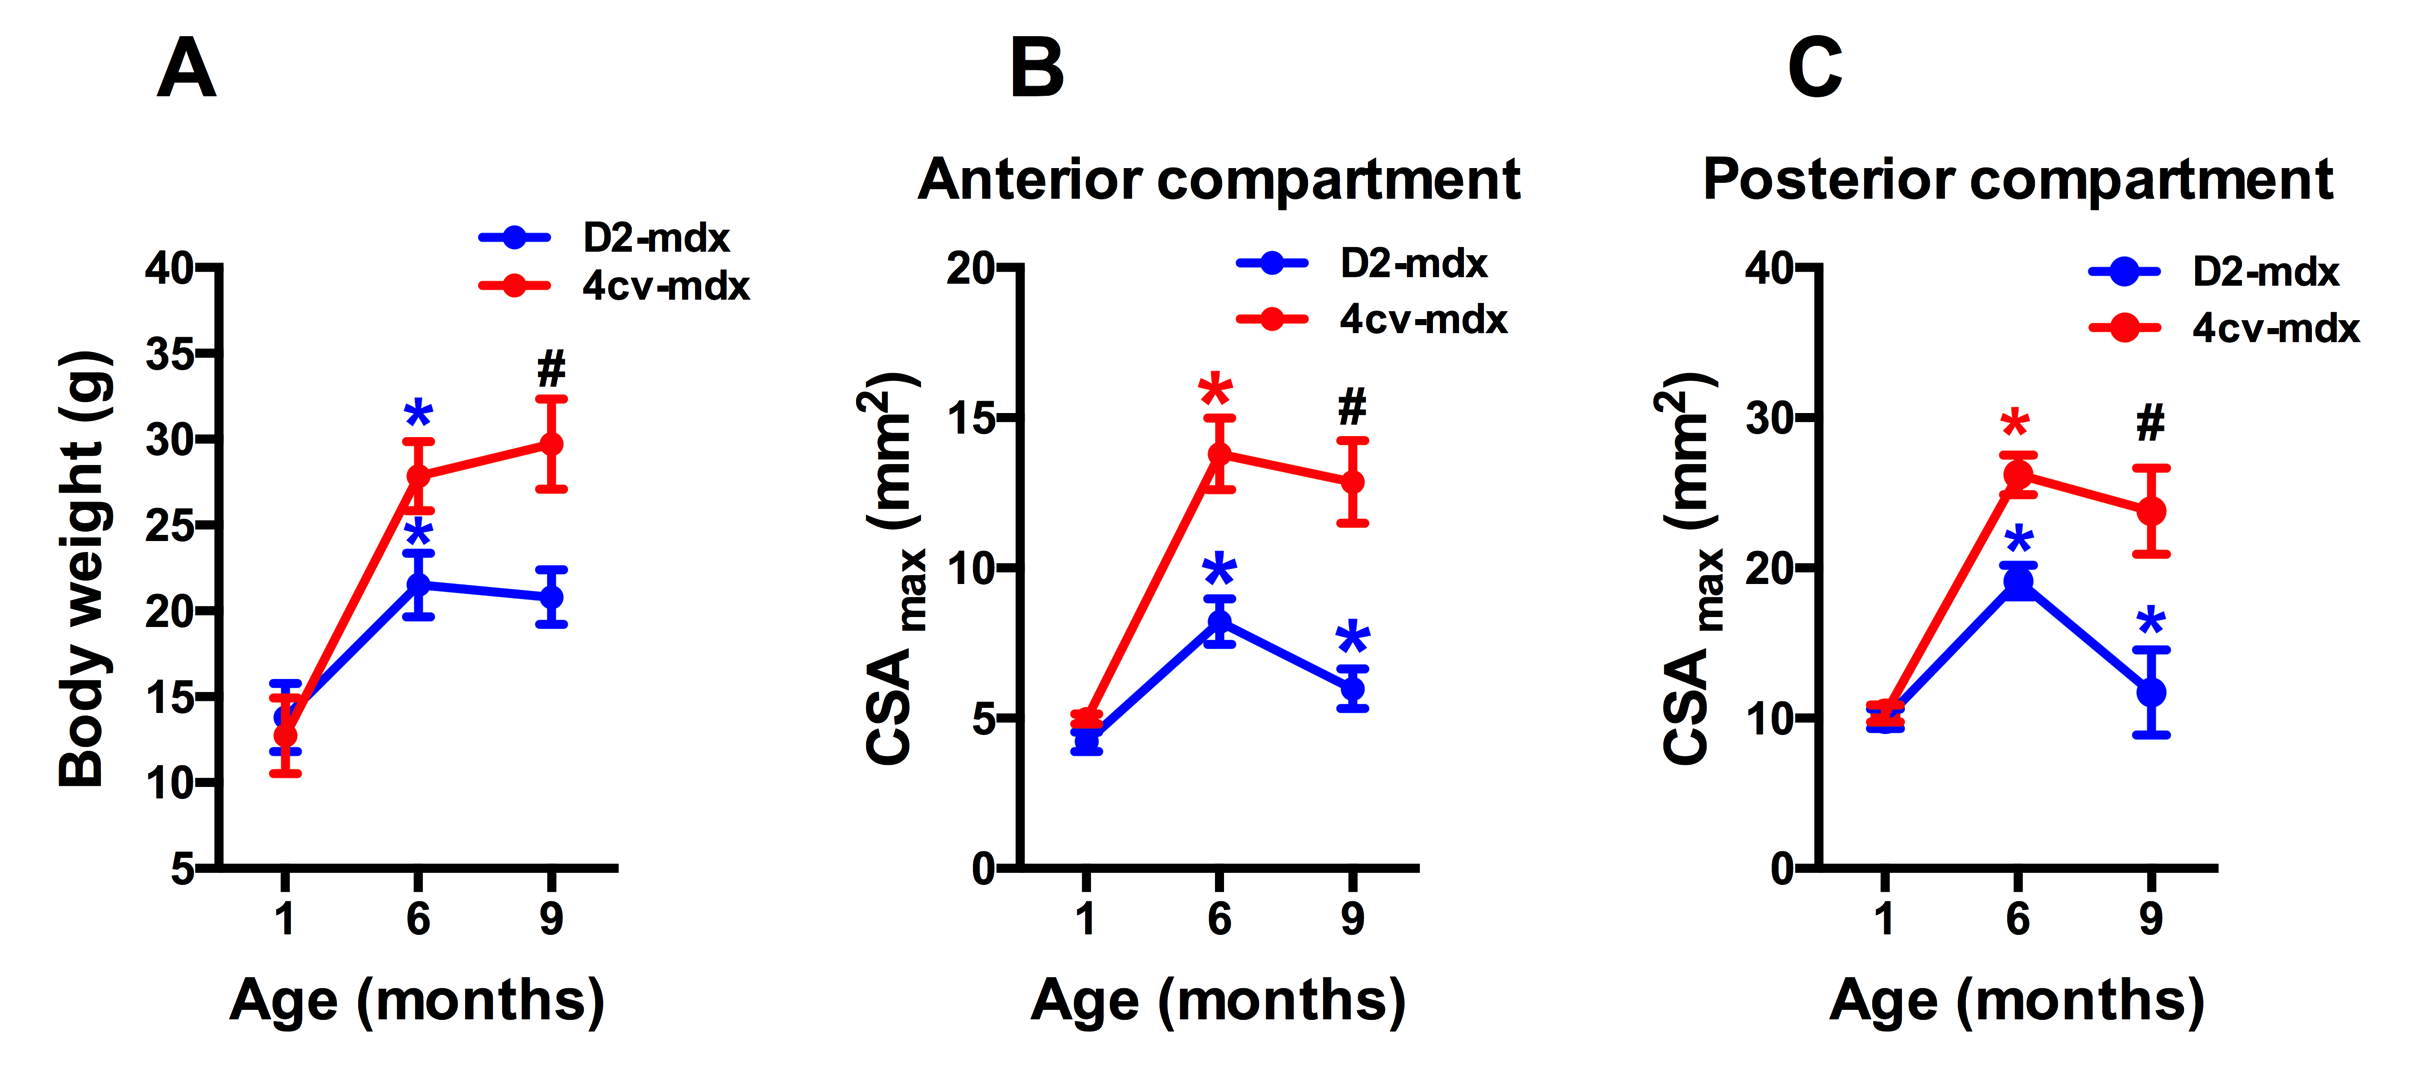
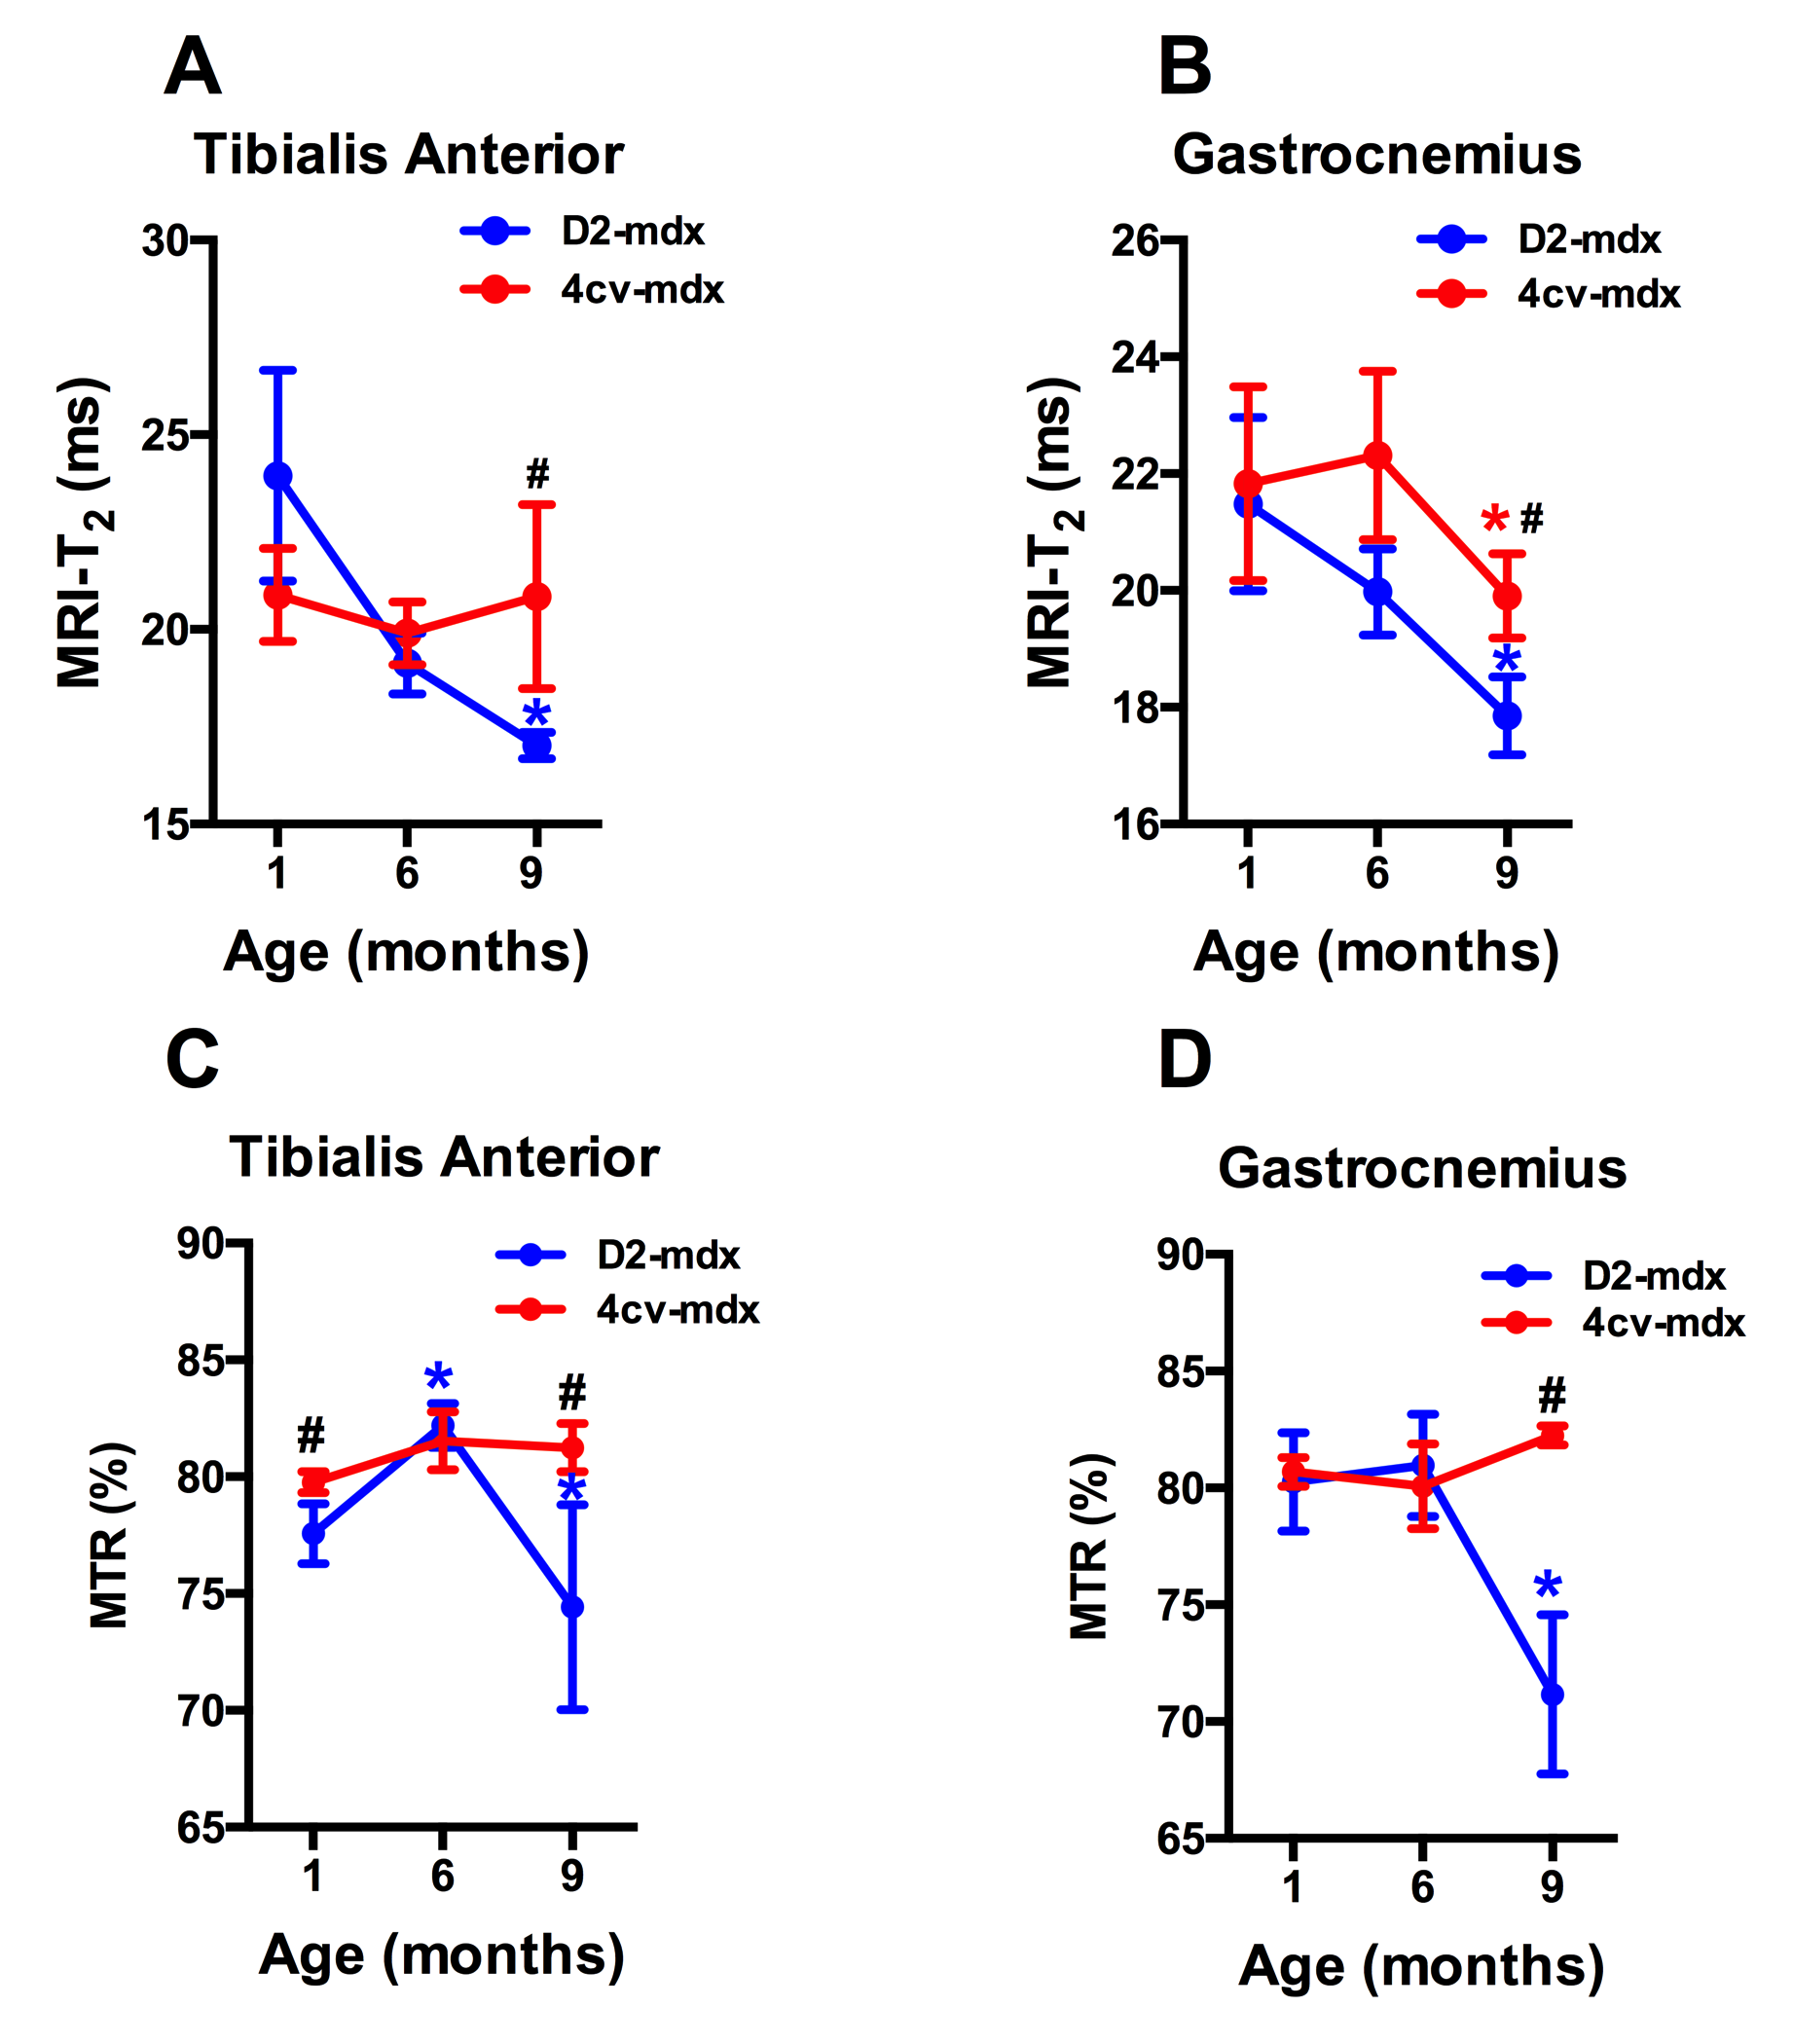
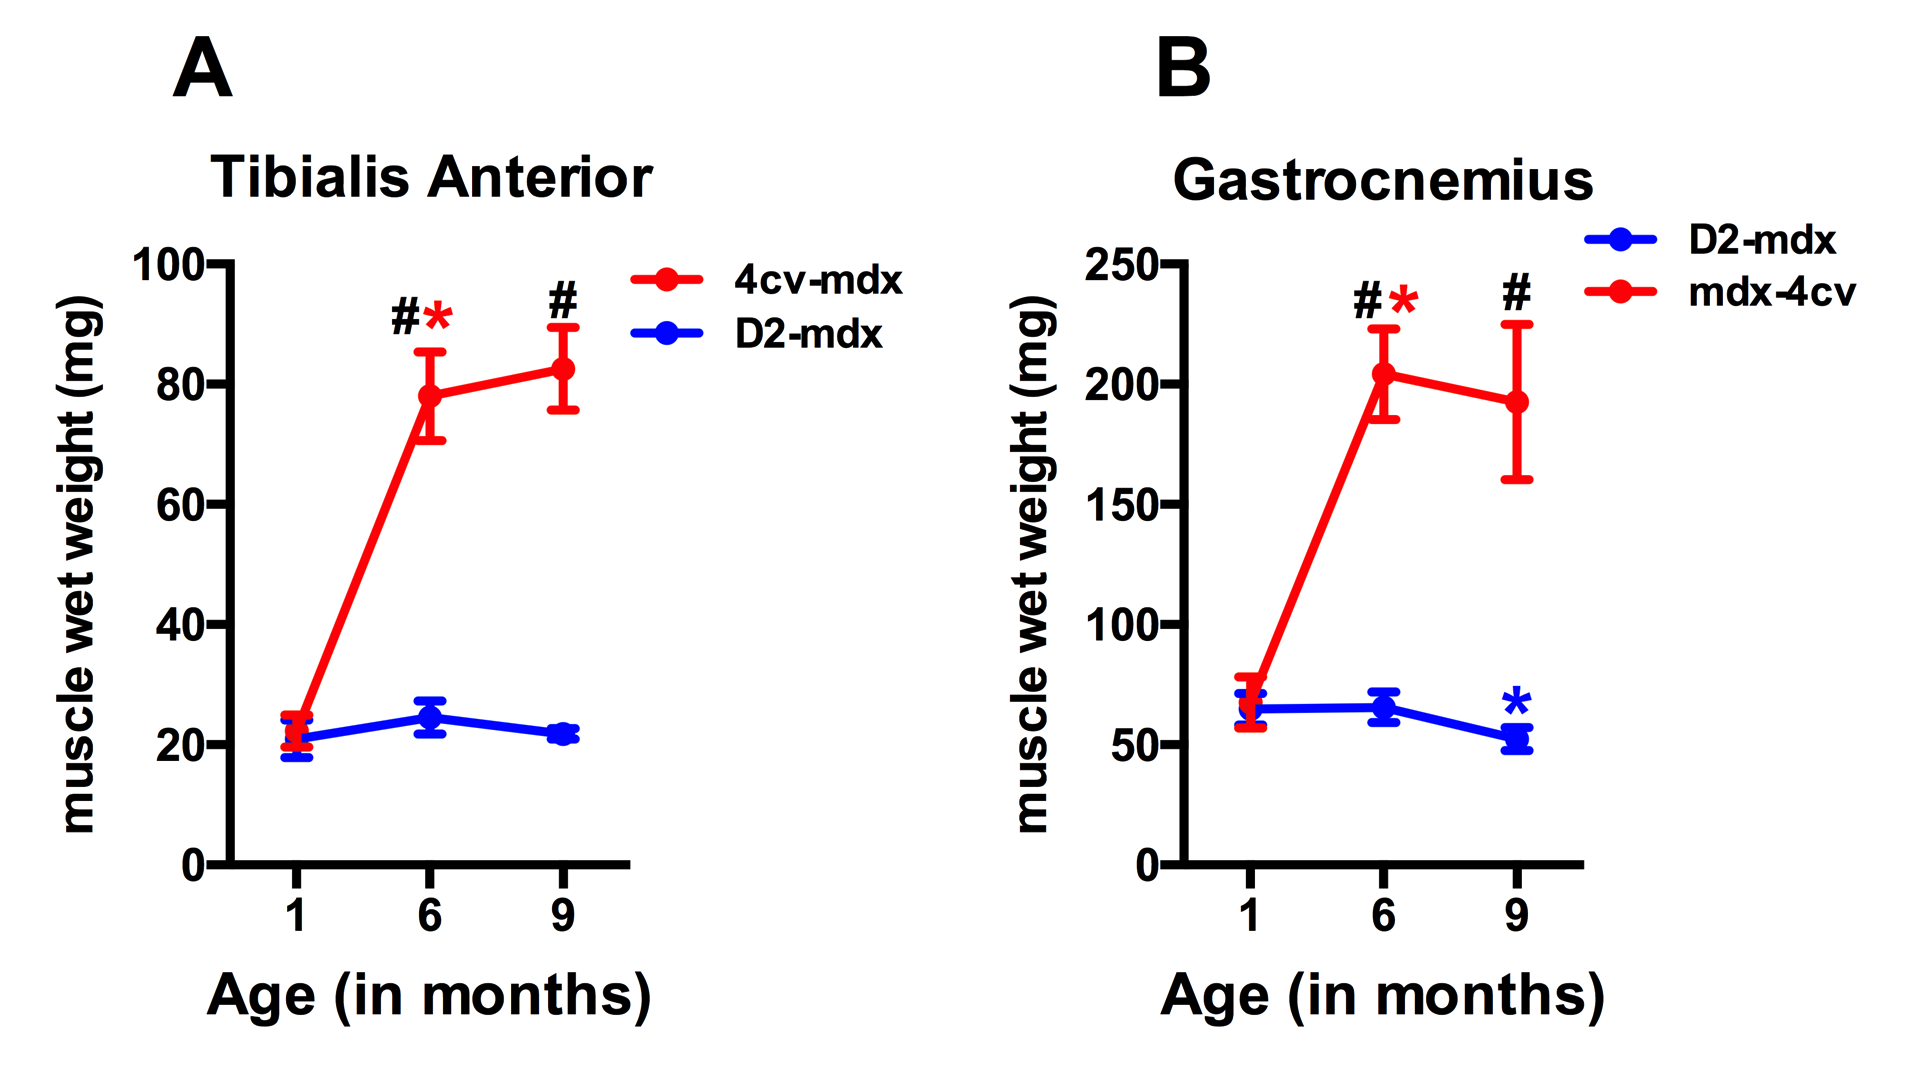
Significant age related differences in body weight and maximum muscle cross sectional area (CSAmax) were seen in both dystrophic mouse strains (Figure 1 and 2). A larger decrease in age dependent CSAmax was observed in D2 mdx mice compared to age matched mdx4cv mice. There was a significant age dependent decrease in skeletal muscle T2 of D2-mdx mice (Tibialis Anterior (TA); 1 month; 22.8±2.3 ms, 6 months; 18.1±0.7 ms, 9 months; 17.0±0.3 ms and Gastrocnemius (GA); 1 month; 21.5±1.5 ms, 6 months; 20.0±0.7 ms, 9 months; 17.9±0.7 ms) (Figure 3). Additionally, age dependent variations in MTR were seen in both mdx4cv and D2-mdx mice (Figure 3). Finally, D2-mdx muscles demonstrated significant muscle atrophy compared to age matched mdx4cv mice (Figure 4).Discussion
Multi-parametric MR measurements may provide greater insight into the underlying pathophysiological changes occurring in the skeletal muscles. For example, the decrease in CSAmax suggests increased muscle atrophy in dystrophic mice on the DBA/2 background. Further supportive data include a decrease in muscle wet weight and decrease in skeletal muscle T2, both of which are suggestive of increased muscle fibrotic tissue deposition [4]. Finally MTR has been shown to decrease in the presence of myopathic processes [5] and with changes in radial diffusivity [6].Conclusion
MR parameters such as T2 relaxation and MTR (%) are sensitive to underlying pathophysiological processes and helpful in differentiating these two dystrophic strains.Acknowledgements
This work was funded by support from National Institute of Health grant number U54 AR065139.References
1. Banks, G.B. and J.S. Chamberlain, The value of mammalian models for duchenne muscular dystrophy in developing therapeutic strategies. Curr Top Dev Biol, 2008. 84: p. 431-53.
2. McNally, E.M., et al., Mild and severe muscular dystrophy caused by a single gamma-sarcoglycan mutation. Am J Hum Genet, 1996. 59(5): p. 1040-7.
3. Beggs, A.H., et al., Exploring the molecular basis for variability among patients with Becker muscular dystrophy: dystrophin gene and protein studies. Am J Hum Genet, 1991. 49(1): p. 54-67.
4. Vohra, R., et al., Magnetic Resonance Monitoring of Disease Progression in mdx Mice on Different Genetic Backgrounds. Am J Pathol, 2017. 187(9): p. 2060-2070.
5. McDaniel, J.D., et al., Magnetization transfer imaging of skeletal muscle in autosomal recessive limb girdle muscular dystrophy. J Comput Assist Tomogr, 1999. 23(4): p. 609-14.
6. Ou, X., et al., Quantitative magnetization transfer measured pool-size ratio reflects optic nerve myelin content in ex vivo mice. Magn Reson Med, 2009. 61(2): p. 364-71.
Figures